

2027 Debt Wall Could Cut 20% Of SRS Income
A 62 year old in Toa Payoh loses S$150 every month when REIT distributions get cut 10%

Like a hawker facing doubled rent, over-leveraged REITs are struggling. Protect your SRS monthly cash flow from these rising costs.
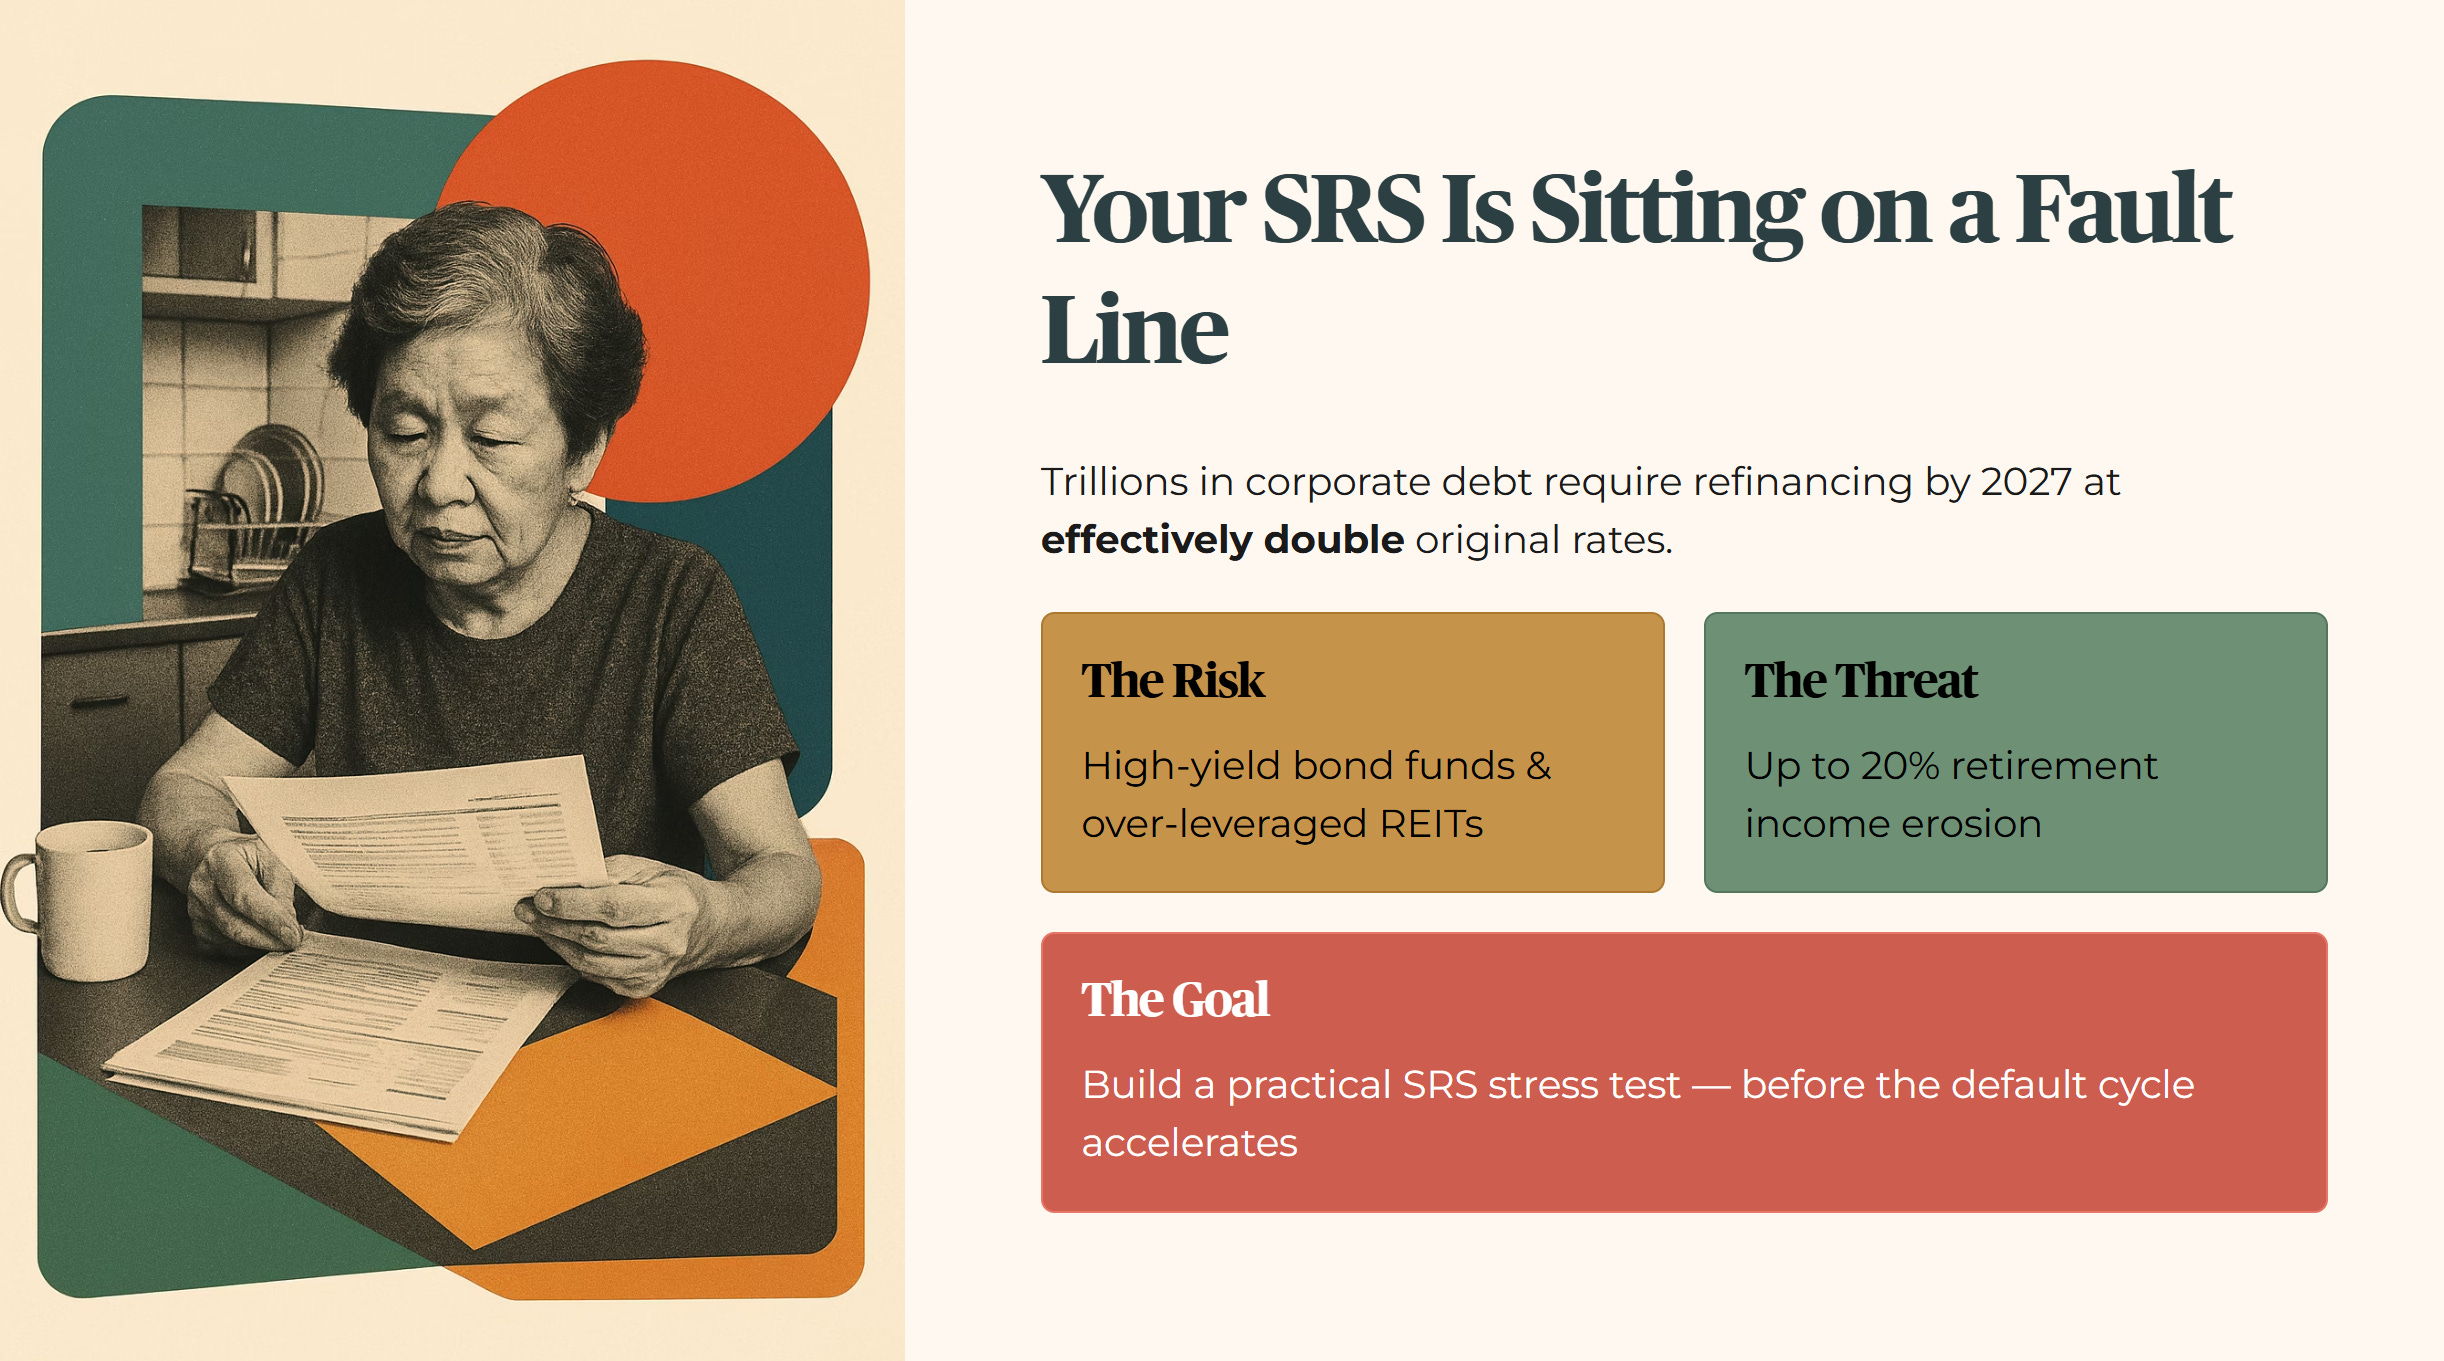
The global corporate debt load has surged to a record high, with trillions requiring refinancing by 2027 at rates effectively double their original coupons. If you are holding high-yield bond funds or over-leveraged REITs in your SRS, your retirement cash flow is sitting on a fault line that could erase 20% of your income. Today we build a practical SRS stress test to identify exactly what breaks first in your portfolio before the global default cycle accelerates.

In This Article:
Step 1 — the health check Macro solvency
The five-layer audit High-leverage industrial REITs
Step 2 — the wealth check Yield and cash flow
Step 3 — the price check Sector stress mapping
The DIY SRS stress test framework
Step 4 — the bottom line Forensic stance
STEP 1 — THE HEALTH CHECK (Macro Solvency)
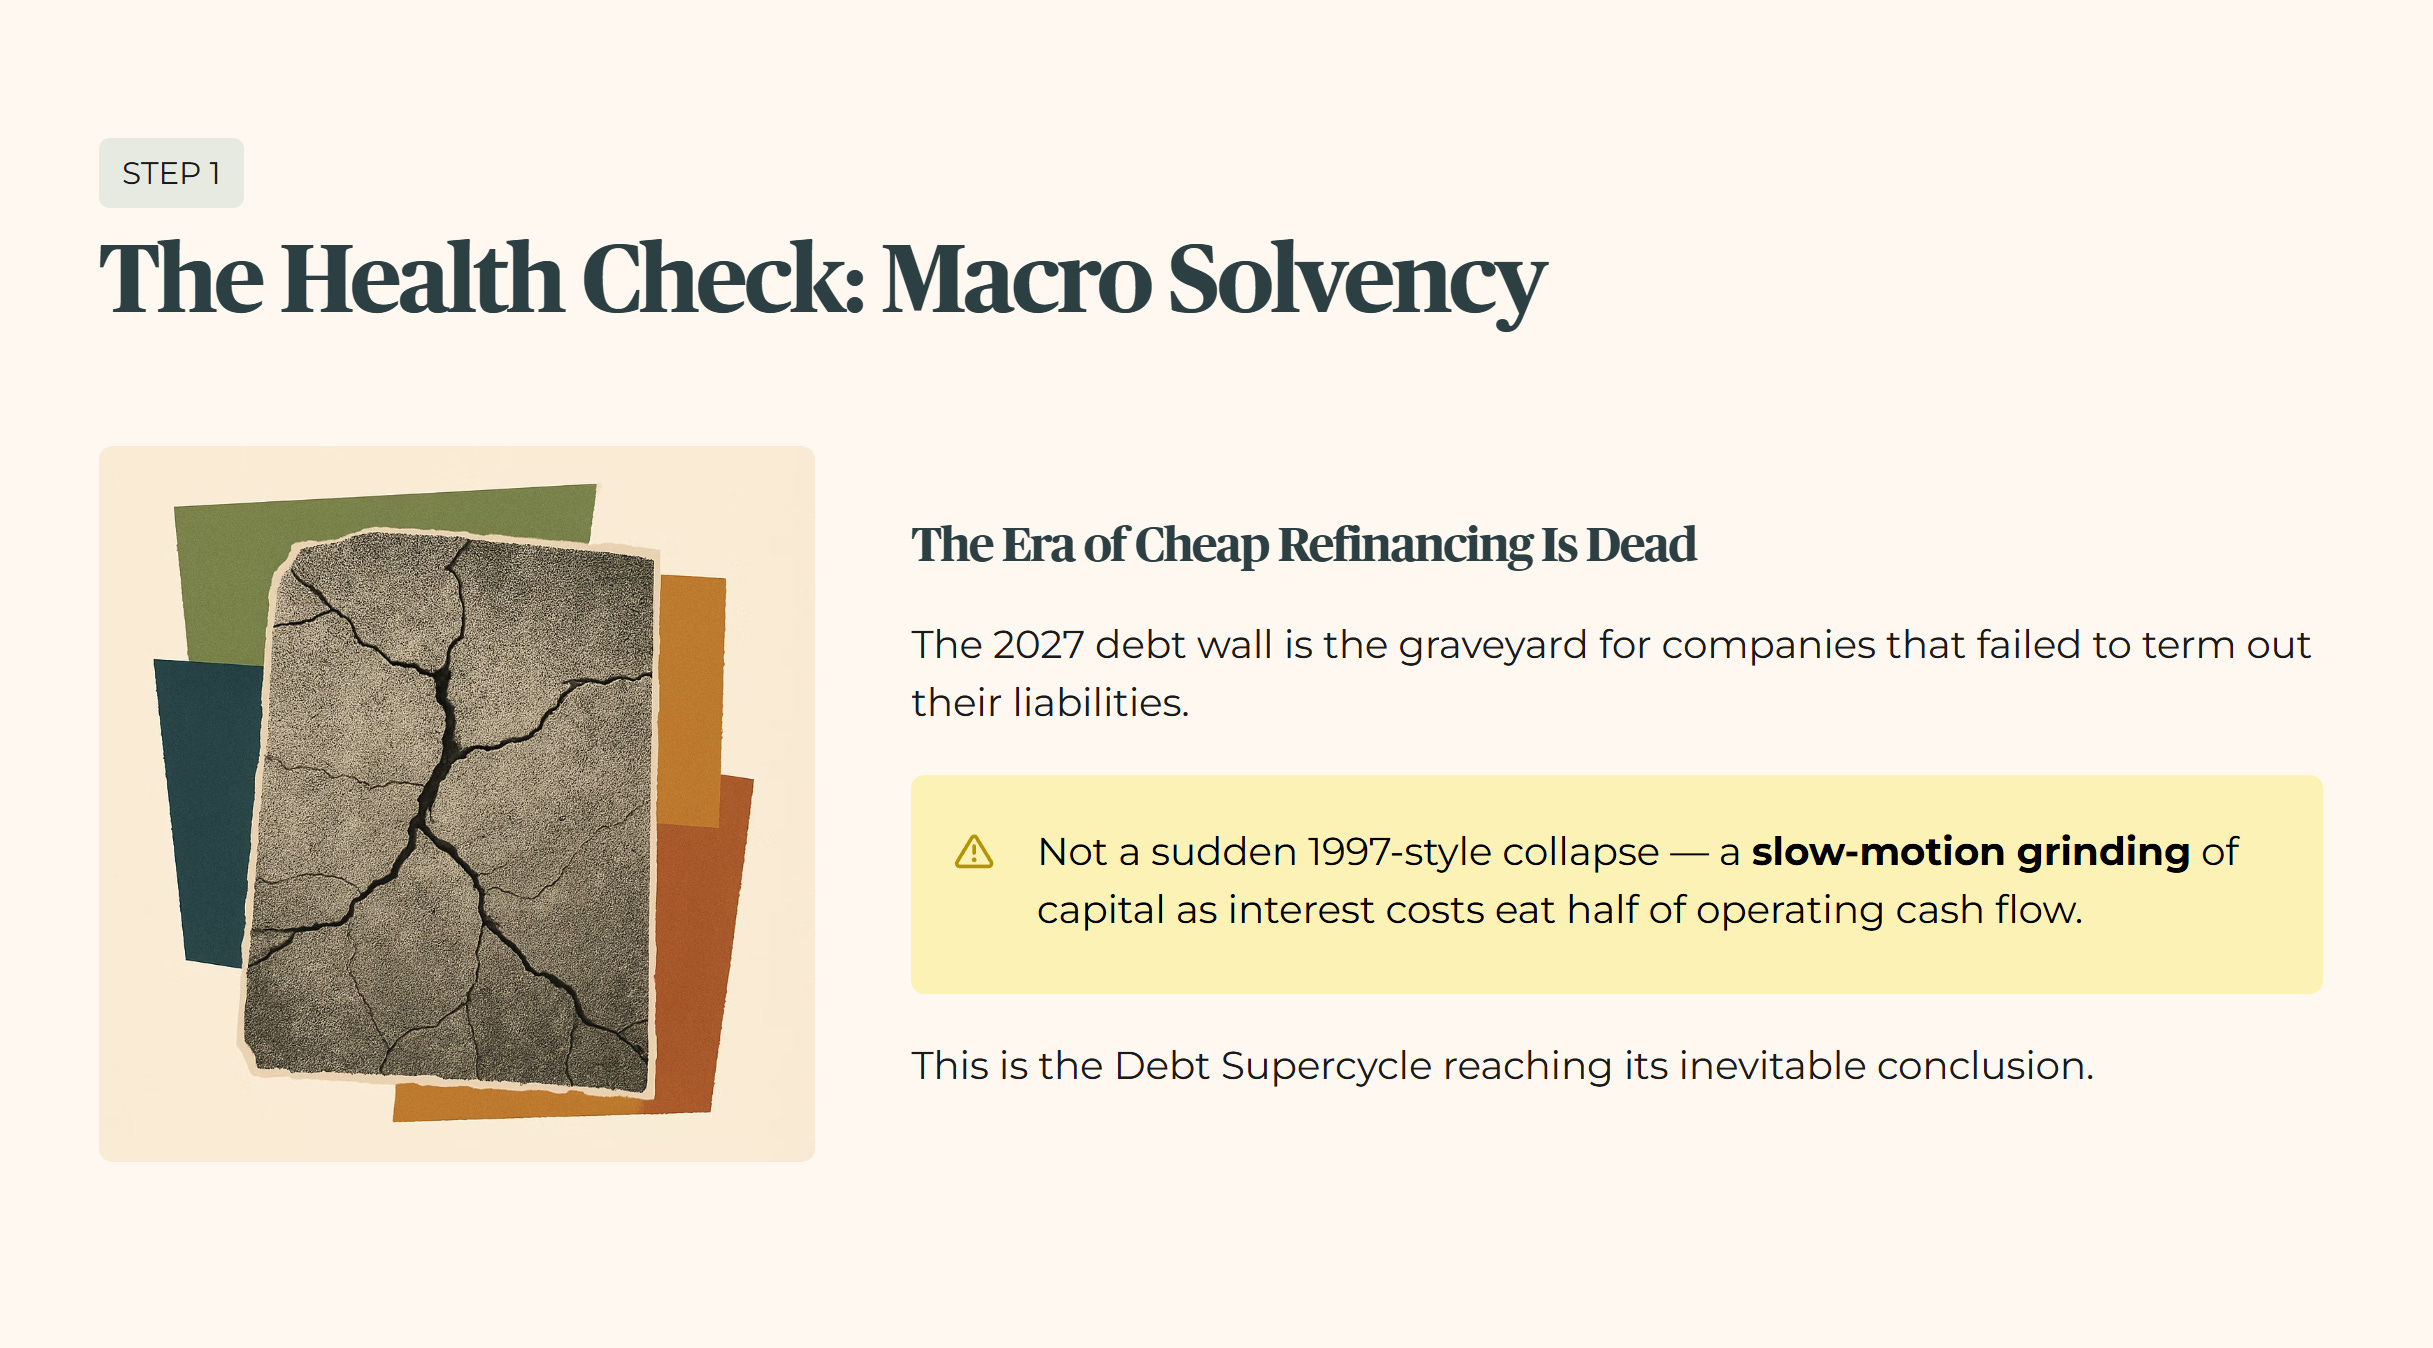
The era of cheap refinancing is dead, and the 2027 debt wall is the graveyard for companies that failed to term out their liabilities. We are not looking at a 1997-style collapse, which was a sudden currency and liquidity crisis. We are looking at a slow-motion grinding of capital as companies that gorged on cheap money now face a reality where interest costs eat half their operating cash flow. This is the Debt Supercycle reaching its inevitable conclusion.
GEARING ALERT Forensic Verdict Beat
This is where the dividend math breaks for the unprepared investor.
Financial Health Checklist: Global and SGX Macro Indicators
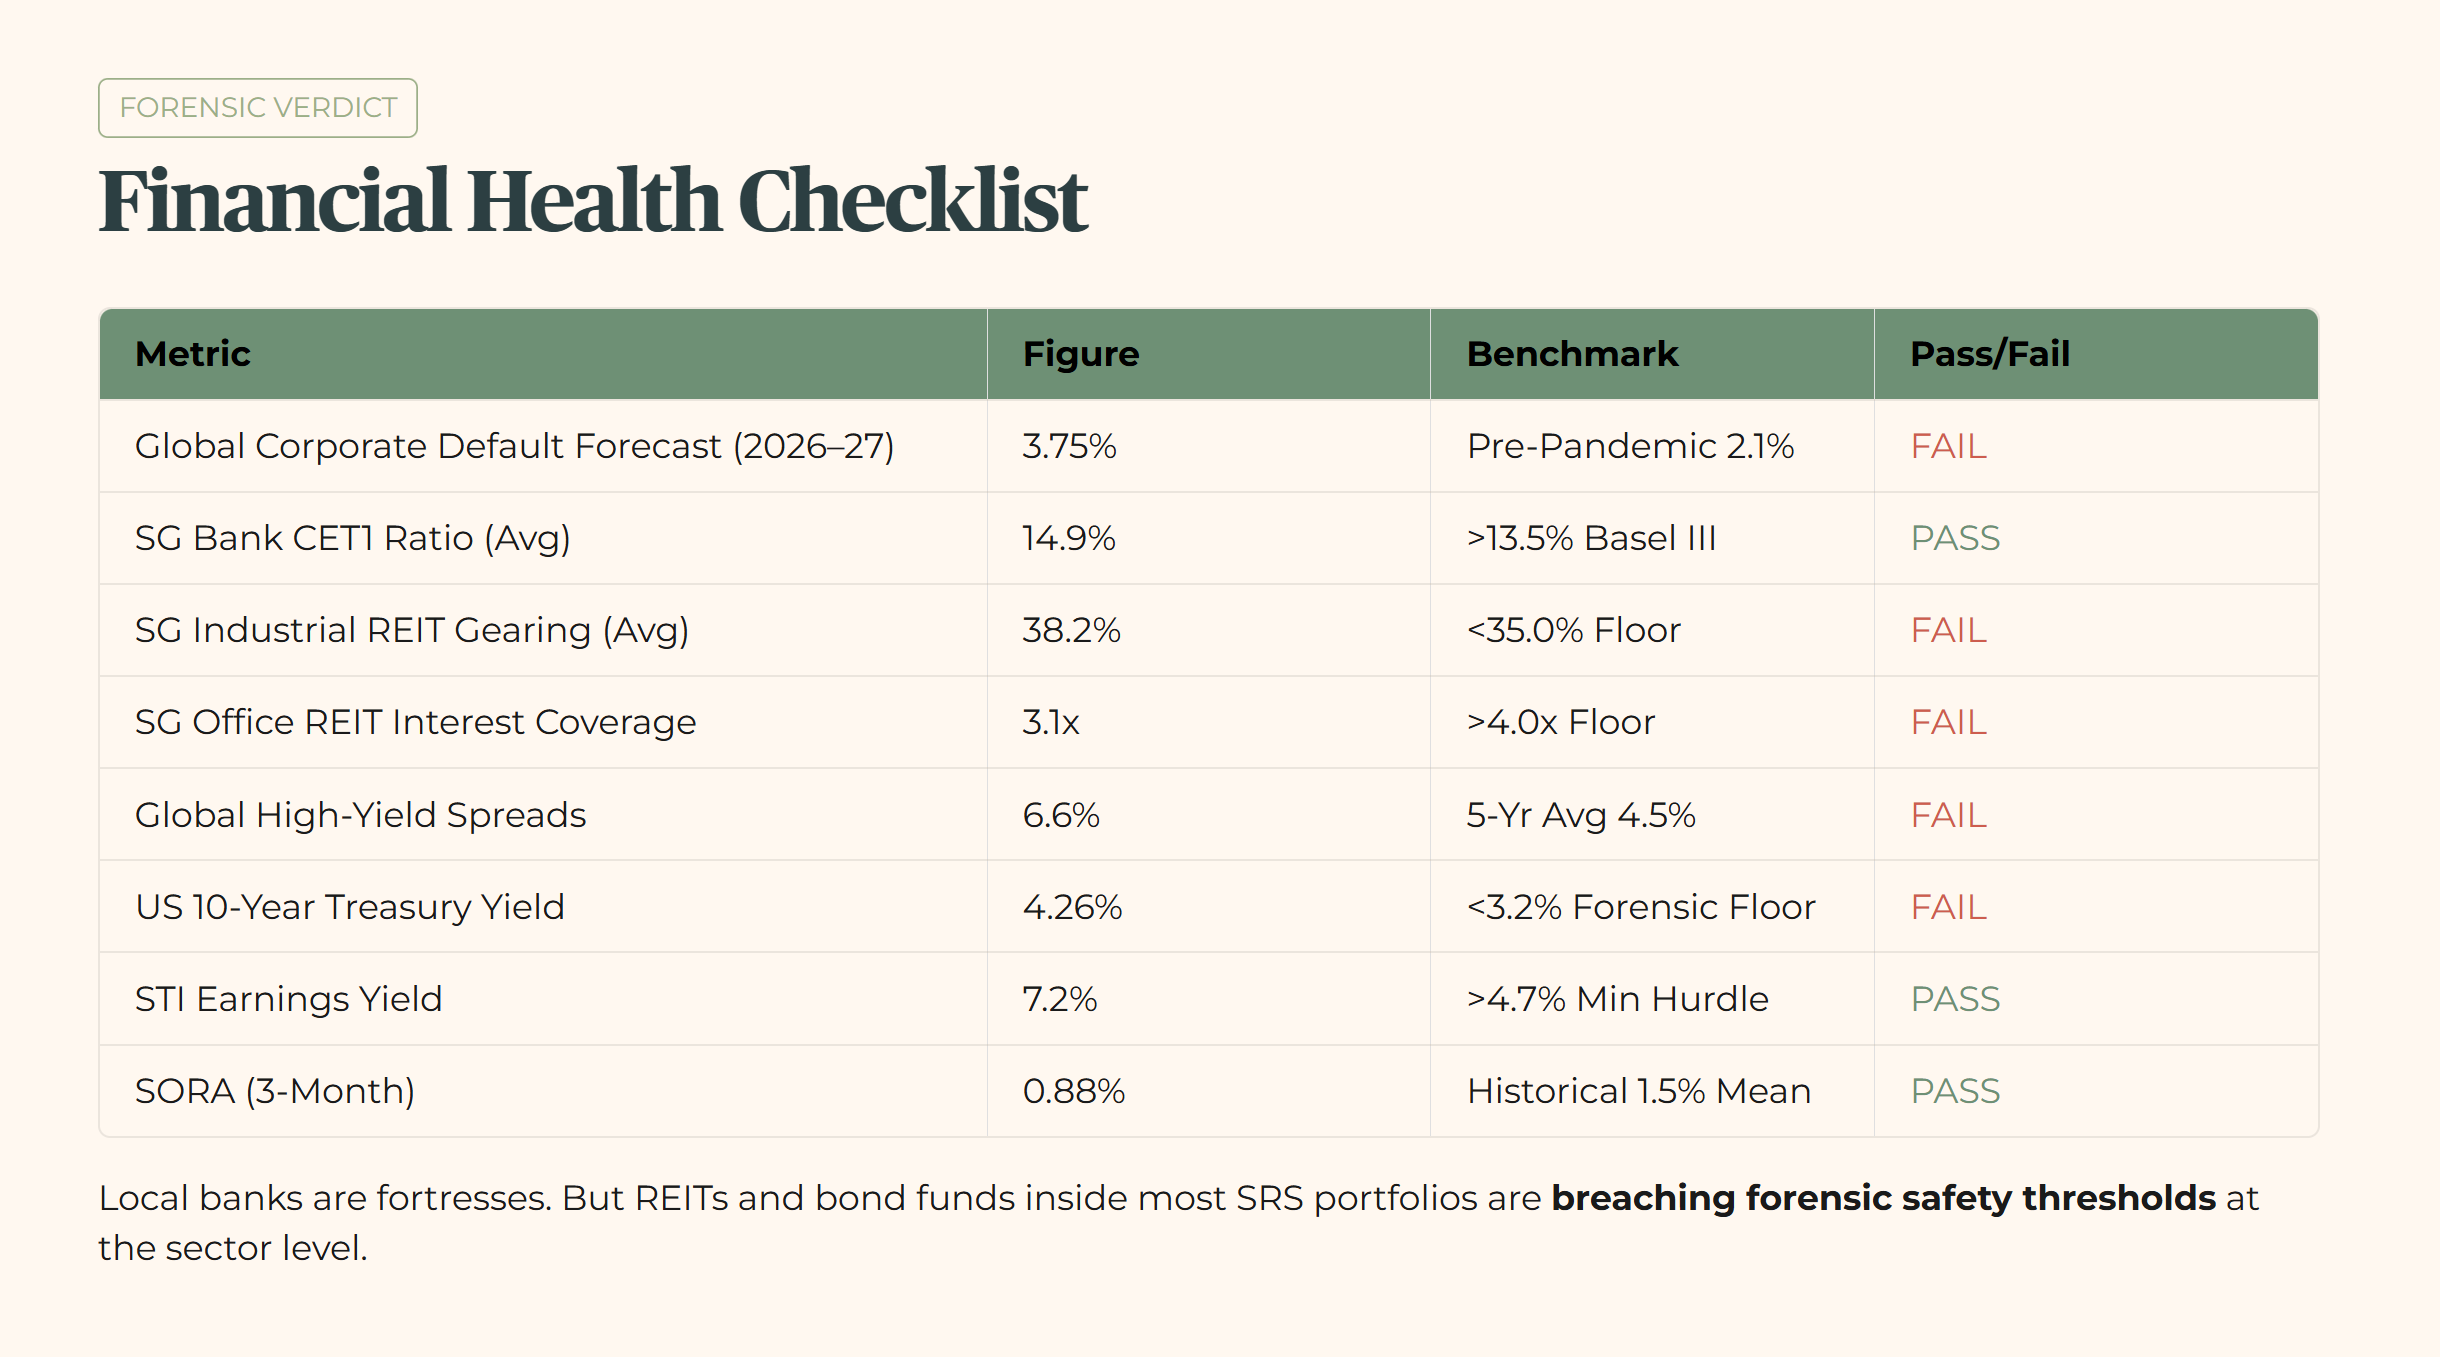
The data shows a clear divergence. Our local banks are fortresses, maintaining CET1 ratios near 15%. The STI’s earnings yield of 7.2% clears the minimum hurdle with room to spare. However, the yield-generating assets sitting inside most SRS portfolios, specifically REITs and bond funds, are breaching my forensic safety thresholds at the sector level.
The Five-Layer Audit: High-Leverage Industrial REITs
The sectoral gearing average for Industrial REITs currently sits at 38.2%. That is above my 35.0% ceiling. So I apply the full forensic treatment.
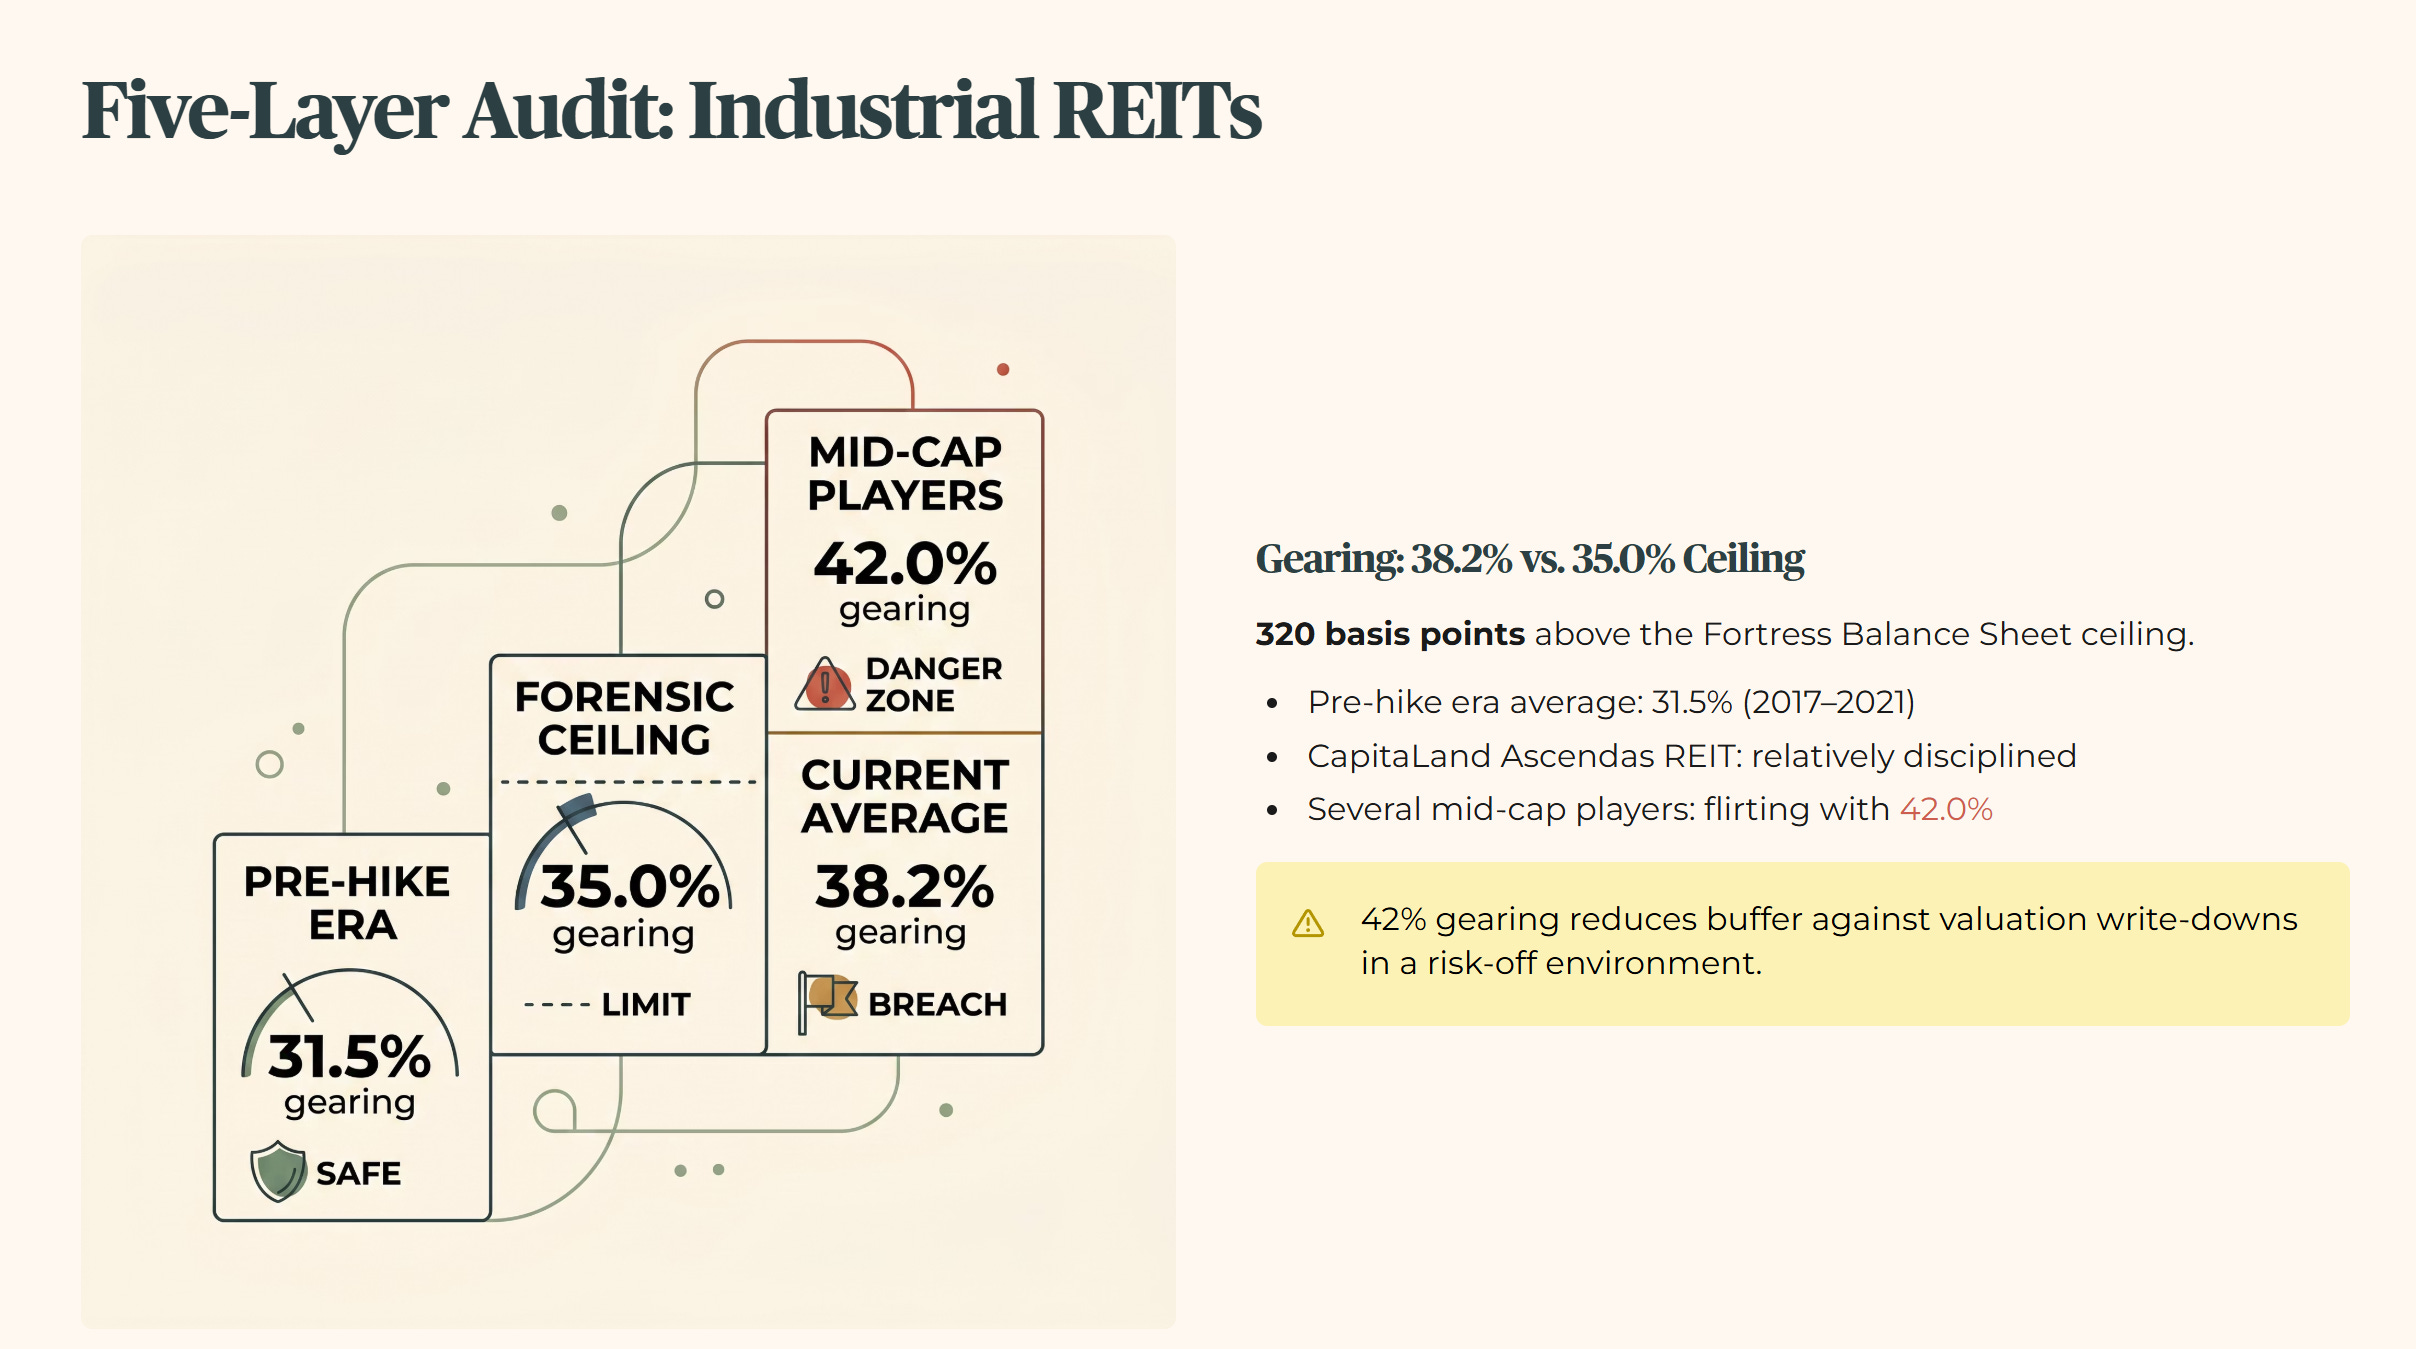
Raw Fact: The average gearing for Singapore Industrial REITs has climbed to 38.2% as of the latest quarterly filings, against a broad S-REIT sector average now running between 38.9% and 40.0%.
Benchmark: This figure is 320 basis points above my 35.0% Fortress Balance Sheet ceiling. It is also significantly higher than the 31.5% sector average seen during the pre-hike era from 2017 to 2021, when balance sheets were still conservatively managed.
Peer Context: While CapitaLand Ascendas REIT maintains a relatively disciplined profile, several mid-cap industrial players are now flirting with 42.0% gearing, which reduces their buffer against any valuation write-downs triggered by a risk-off environment.
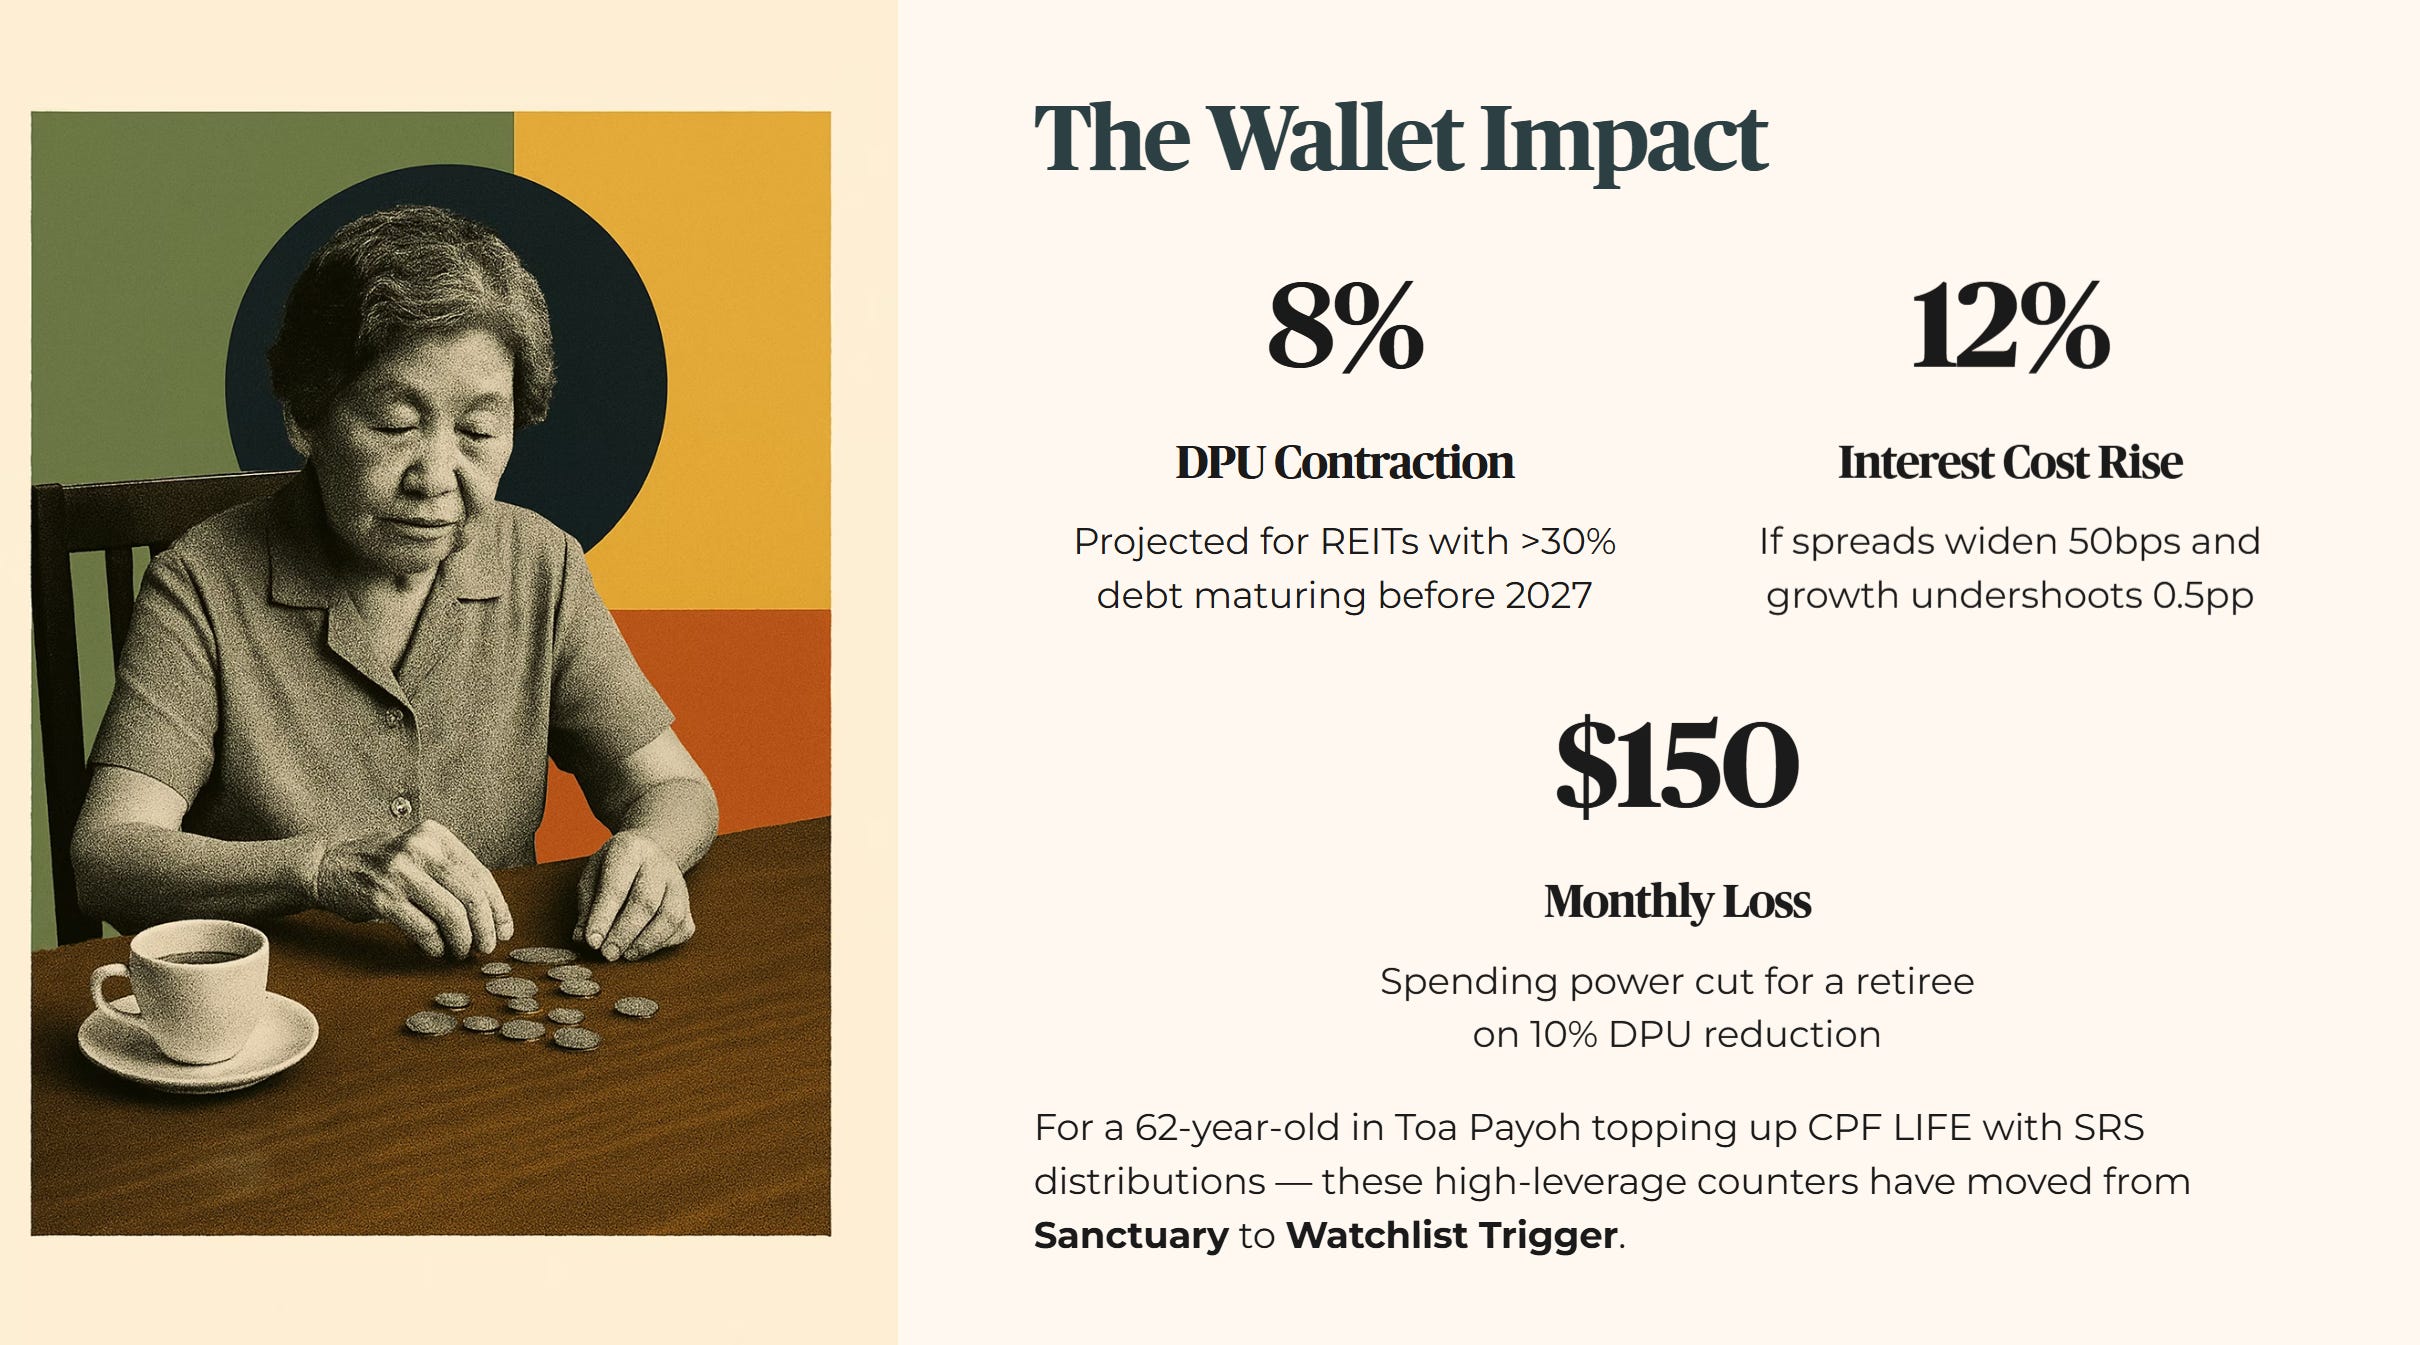
Forward Scenario: In a scenario where global growth undershoots by 0.5 percentage points and credit spreads widen by 50 basis points, interest costs for these REITs would rise by an estimated 12.0%. This would likely produce a 5.0% to 8.0% DPU contraction for any REIT with more than 30.0% of its debt maturing before 2027.
Wallet Impact: Consider a 62-year-old retiree in Toa Payoh who relies on SRS distributions to top up her CPF LIFE payouts. A 10.0% cut in DPU from her industrial REIT holdings translates to roughly $150 less in monthly spending power. For this investor, these high-leverage counters have moved from Sanctuary status to a Watchlist Trigger.
STEP 2 — THE WEALTH CHECK (Yield and Cash Flow)
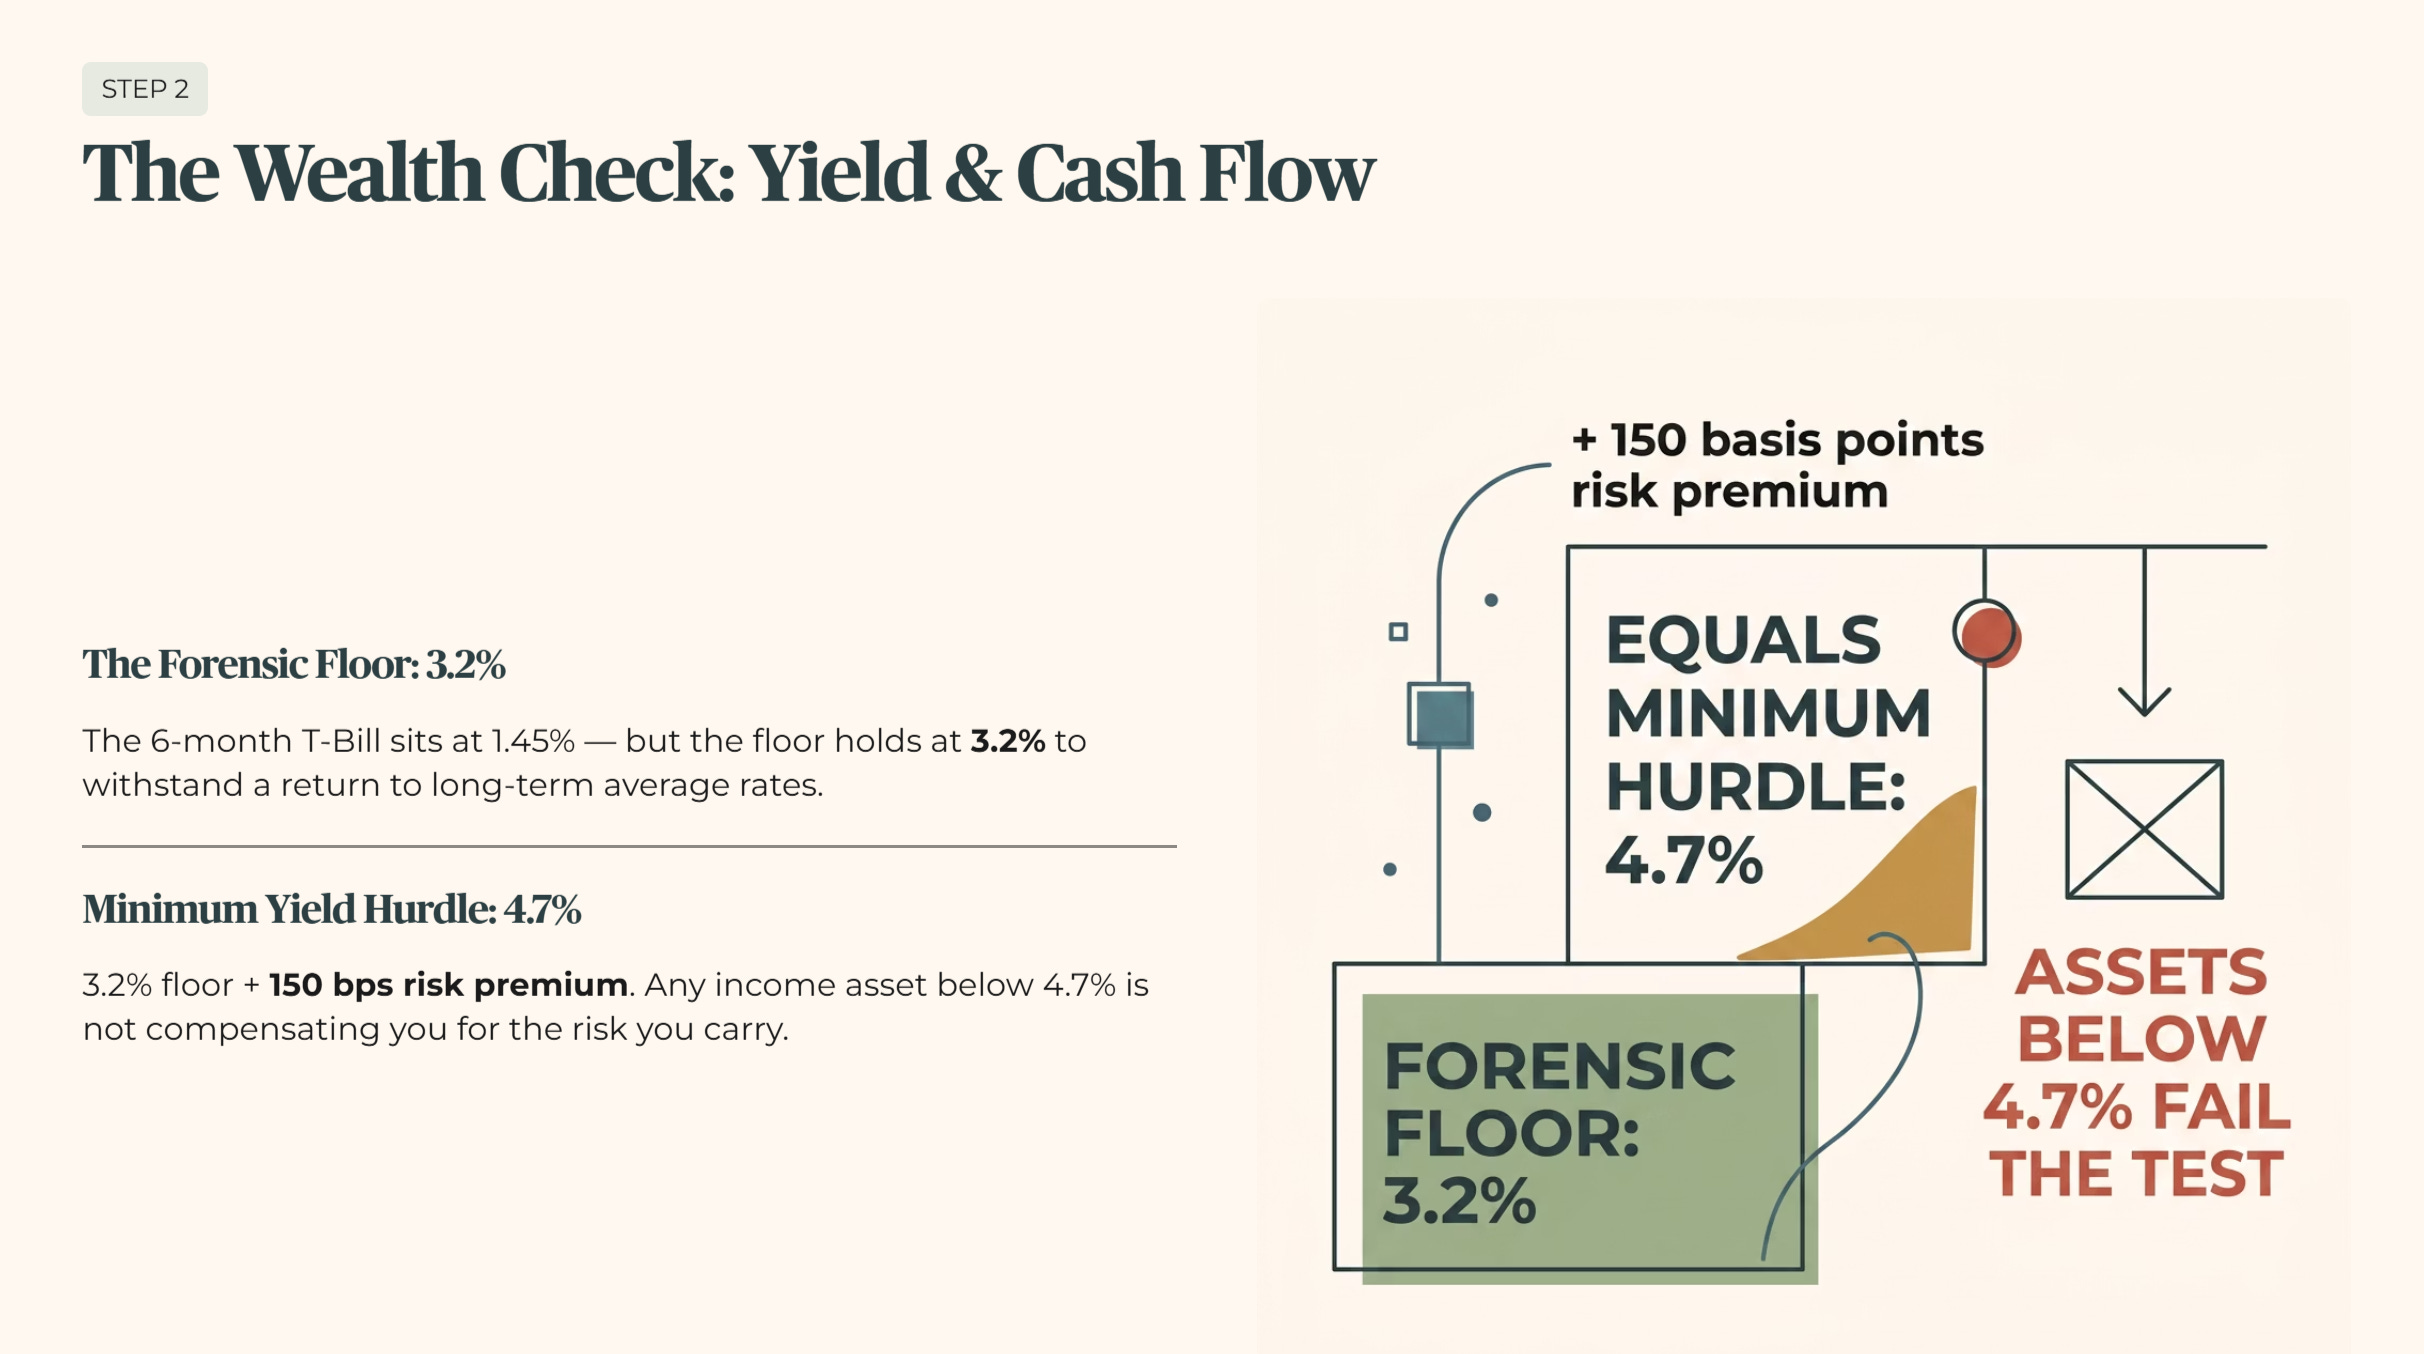
Before mapping sector risks, one number anchors everything: my Forensic Floor of 3.2%. While the 6-month T-Bill currently sits at 1.45%, I do not lower my standards to match a temporary market dip. The floor holds at 3.2% to ensure your sanctuary assets can withstand a return to long-term average interest rates. Add the mandatory 150 basis points of risk premium and the minimum yield hurdle is 4.7%. Any income asset below that number is not compensating you for the risk you are carrying.
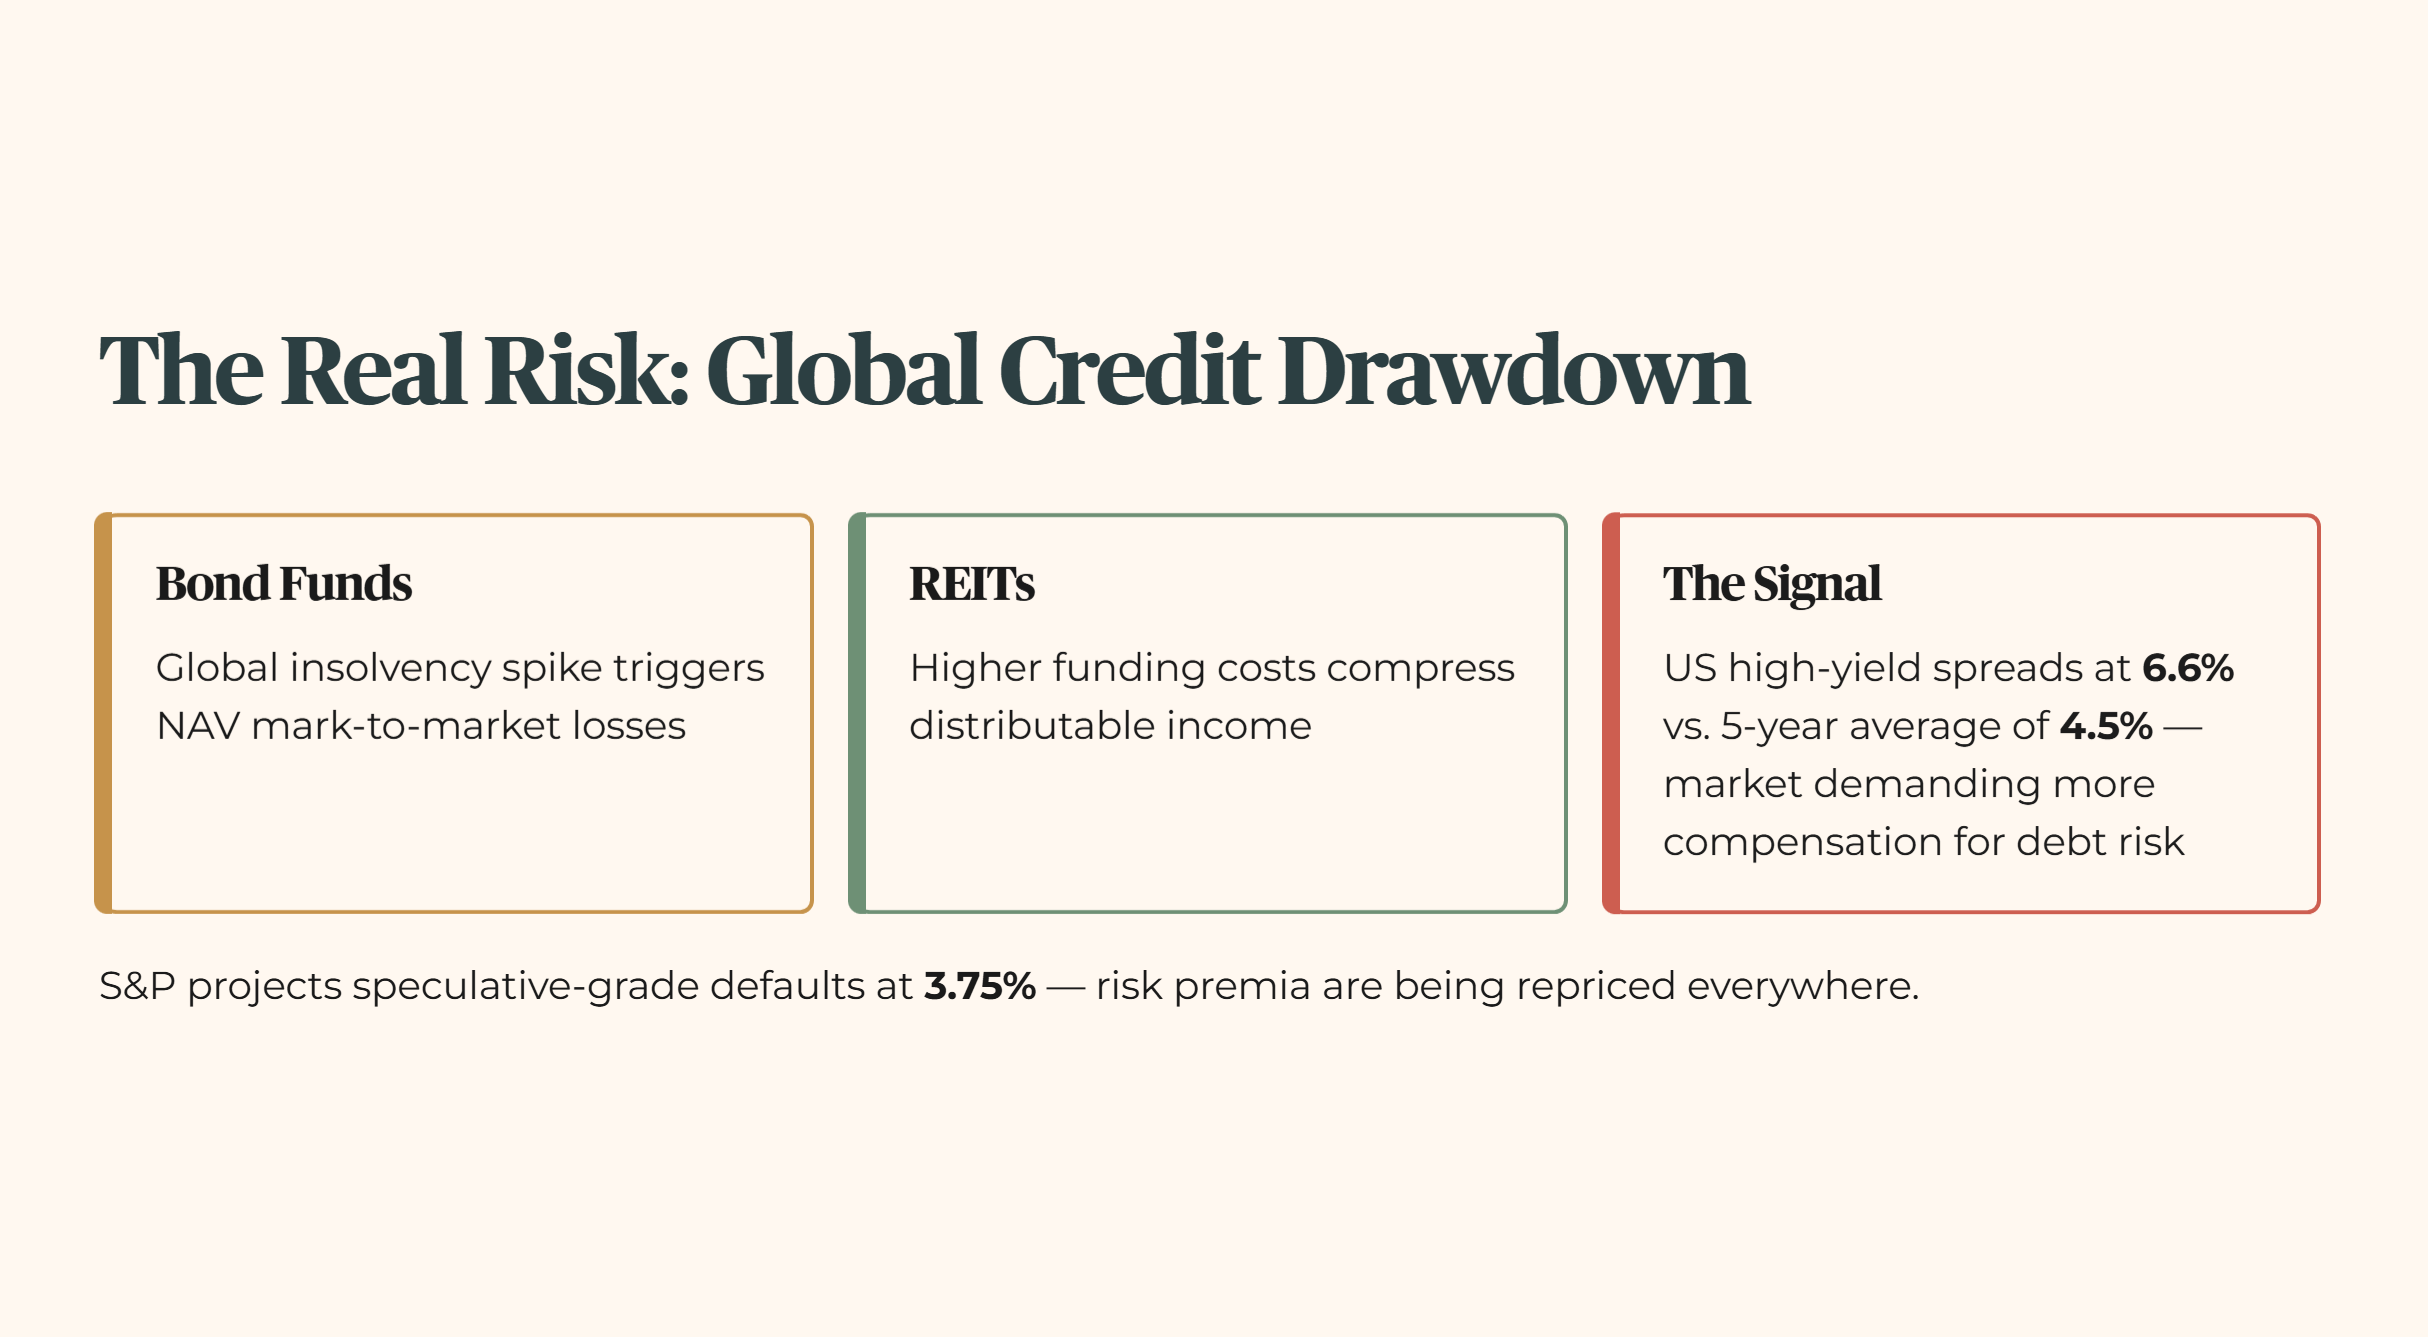
The risk for a Singapore retail investor is not necessarily a local default. The risk is a global credit drawdown. When global insolvencies spike, as S&P is now projecting at 3.75% for the speculative-grade universe, risk premia are repriced everywhere. This hits your bond funds through NAV mark-to-market losses and hits your REITs through higher funding costs. US high-yield spreads are already running at 6.6%, signaling that the market is beginning to demand significantly more compensation for debt risk than the five-year average of 4.5%.
🦎 Iggy’s Insight
Many investors think they are safe because they hold “diversified” bond funds in their SRS. But diversification into poor-quality debt during a default cycle is just a slower way to lose money. If the fund manager is chasing 7.0% yields in an environment where the risk-free rate is elevated, they are likely holding paper that will be the first to burn when the 2027 debt wall arrives. Real safety comes from capital structure, not from owning a thousand different names. Prioritise balance sheet quality over the headline distribution number. In a debt supercycle, capital preservation is not a conservative choice. It is the only rational one.
Because once you layer that sector‑level stress map onto your own SRS positions, the first pass of the Five‑Layer Audit shows exactly how a 10–20% DPU haircut would collide with your CPF LIFE payout — and for some portfolios, the numbers don’t clear the Sanctuary line.
