

Is the STI ETF Overvalued at $5.02? A Deep Dive into the Data
STI ETF at All-Time Highs: Stability or a Financial Trap?

3 Reasons to Watch ES3 & 3 Red Flags to Fear (Analysis)
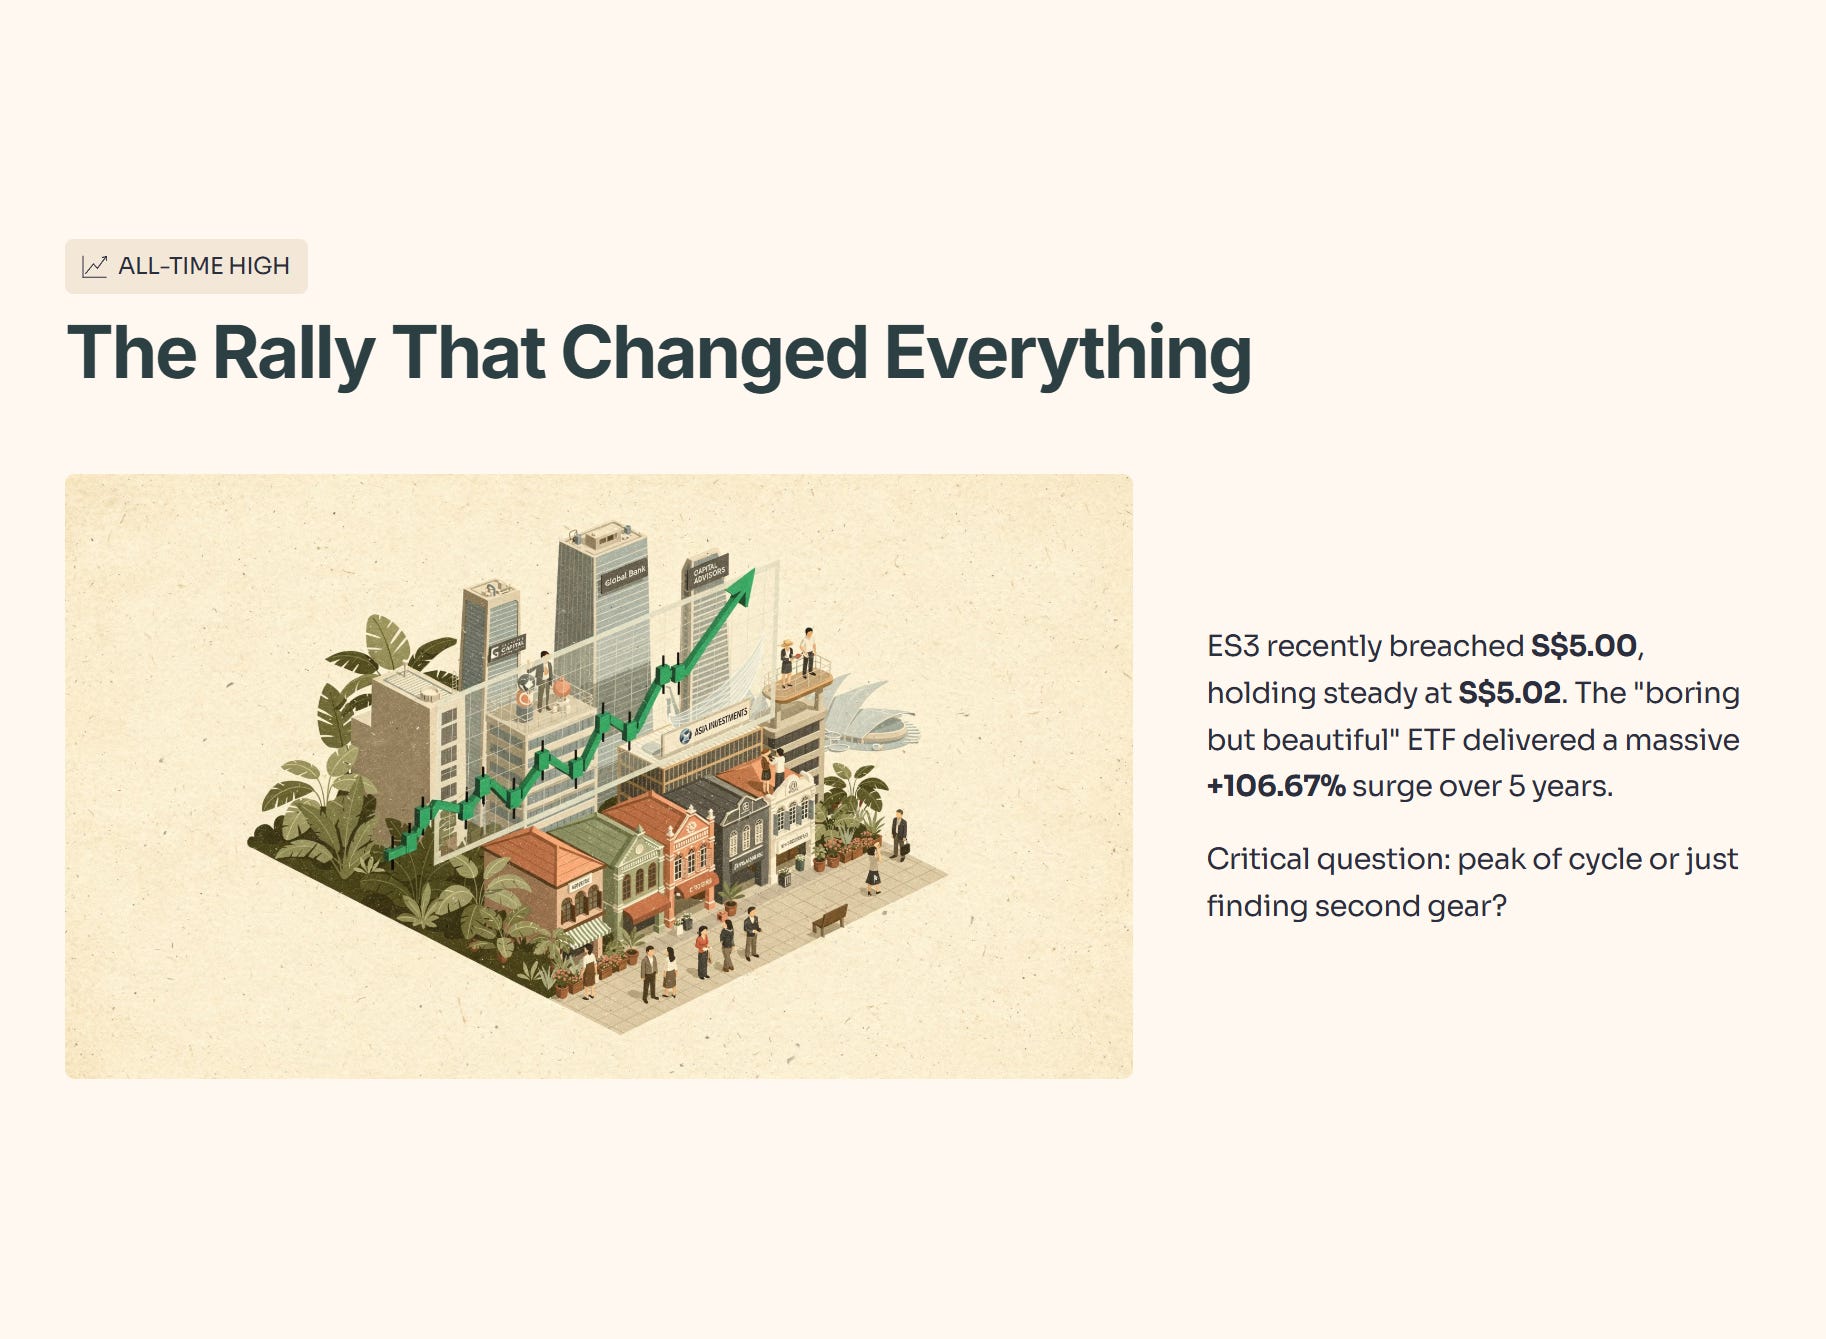
The SPDR Straits Times Index ETF (ES3) has been the “boring but beautiful” darling of the Singapore market lately, recently breaching the S$5.00 mark and holding steady around S$5.02. For years, the prevailing narrative centered on the STI’s “sideways” movement, but a massive rally in bank stocks and a 5-year price surge of +106.67% have pushed this ETF to record levels. As of February 2026, the market is weighing a critical question: is this the peak of a cycle, or is the Singapore “yield engine” just finding its second gear?
In This Article:
The Financial Snapshot (The Baseline)
The “3 Good” (The Bull Case)
The Dividend Growth Engine
The Bank “Fortress” Capital
Broad-Based Earnings Recovery
The “3 Red Flags” (The Bear Case)
The NIM “Squeeze” Risk
Extreme Sector Concentration
High Valuation Resistance
The Singaporean Context (The “Iggy” Angle)
The Weighing Scale: Iggy’s Bottom Line
InvestingPro Reality Check
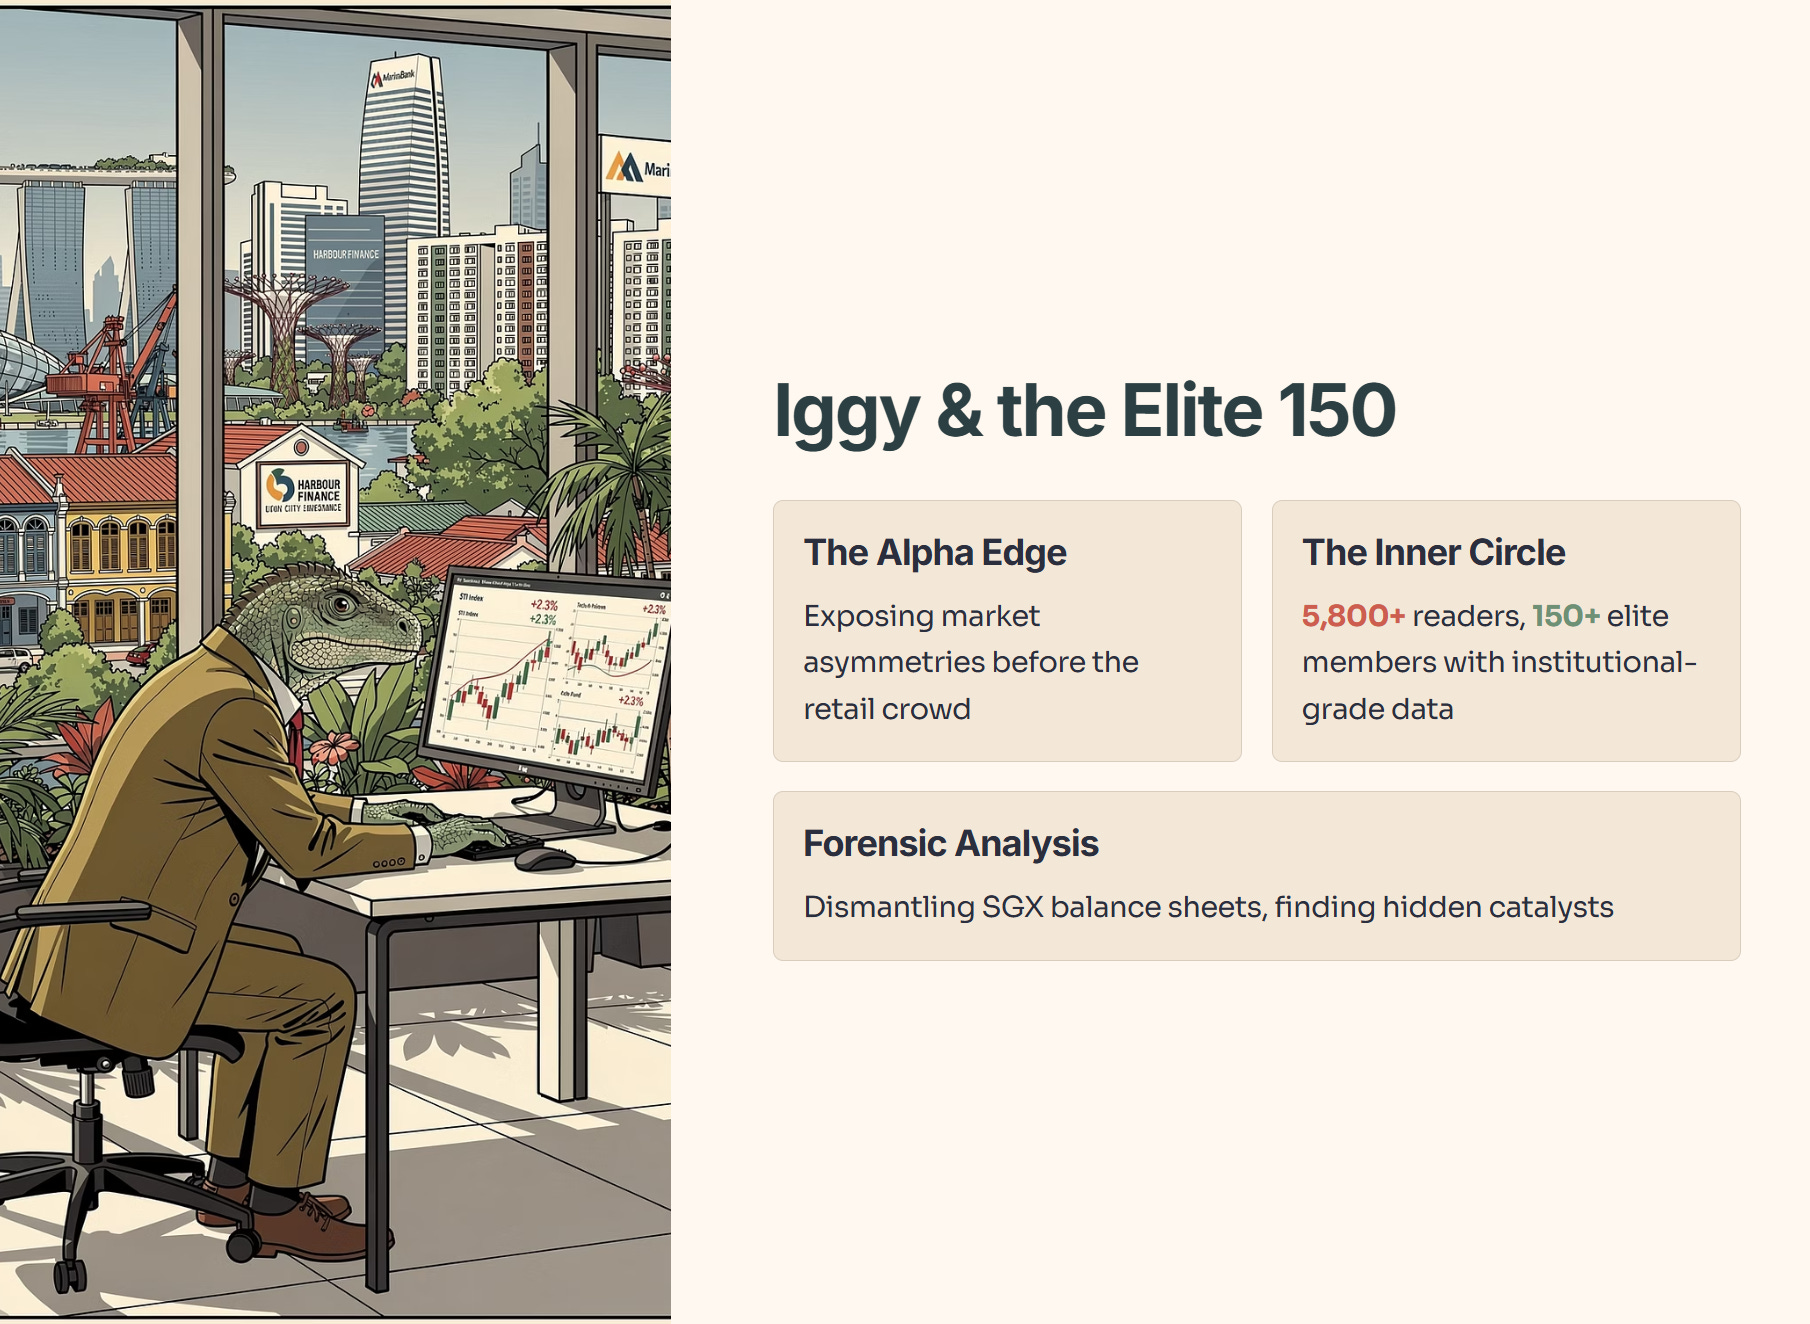
Iggy’s VerdictAbout Iggy & the Elite 150
🦎 Join the Inner Circle: Secure Your Zero-Day Advantage
In the Singapore market, the gap between a winning entry and “holding the bag” is often just 48 hours. While 5,800+ readers wait two weeks for the “Old News” version, my Inner Circle gets the data while the opportunity is still live.
🚨 Stop Trading on a Delay
Free subscribers wait 14 days to see my analysis. In this jungle, if you aren’t first, you’re lunch. Get the data while it’s fresh.
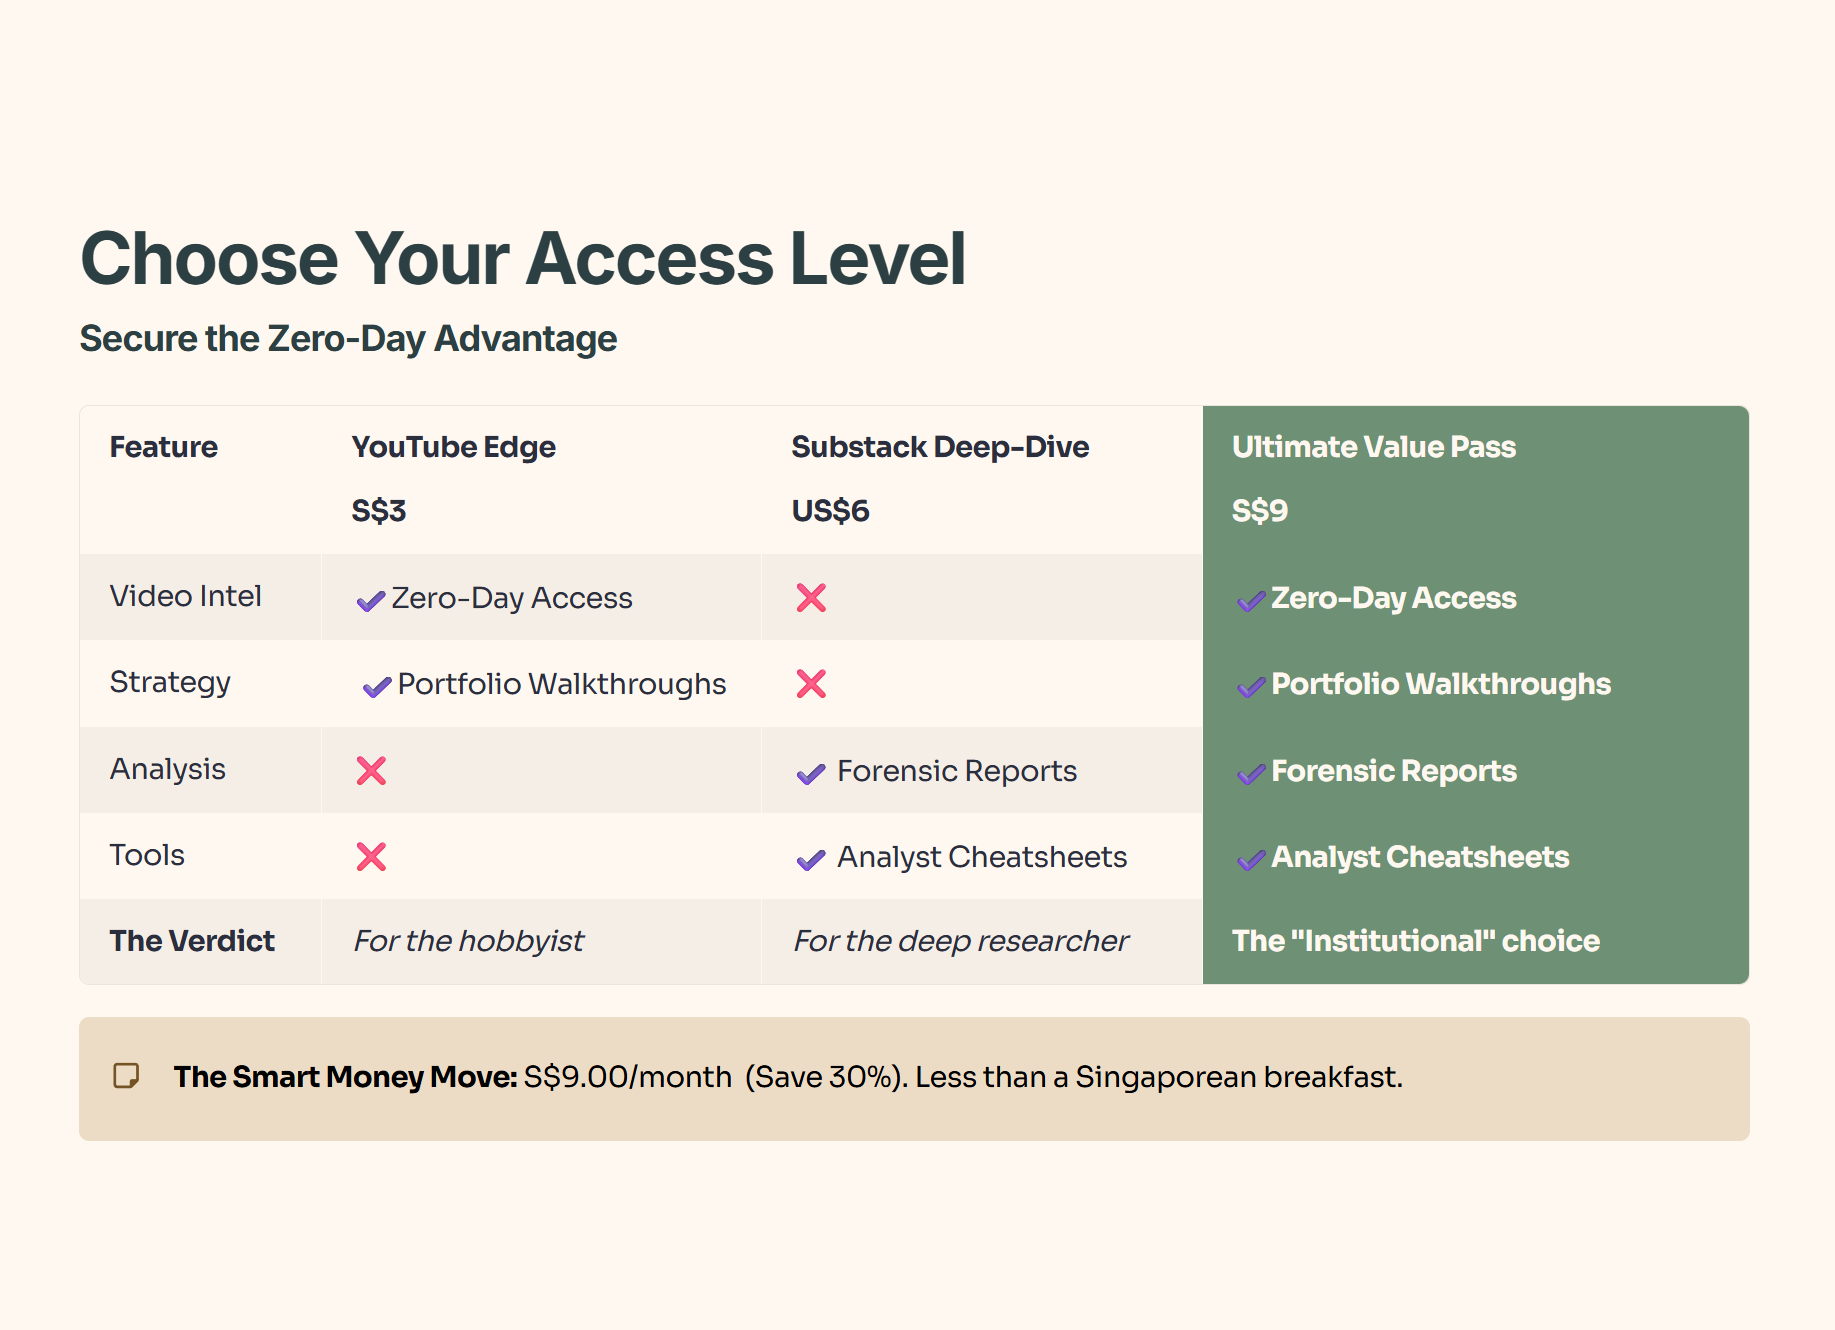
Choose Your Edge:
⚡ Zero-Day Access: Watch every deep-dive video the second it’s rendered. No delays, no missed entries.
📂 The Forensic Vault: Get the full forensic reports and portfolio walkthroughs where I strip away the corporate hype to reveal the hard math behind every Singapore blue chip.
💎 The “Smart Money” Bundle: Get the full S$9/mo Pass (YouTube + Substack). It’s less than the cost of two coffees at Toast Box to trade with the same data as the pros.
[👉Join 150+ Investors in the Inner Circle Here]
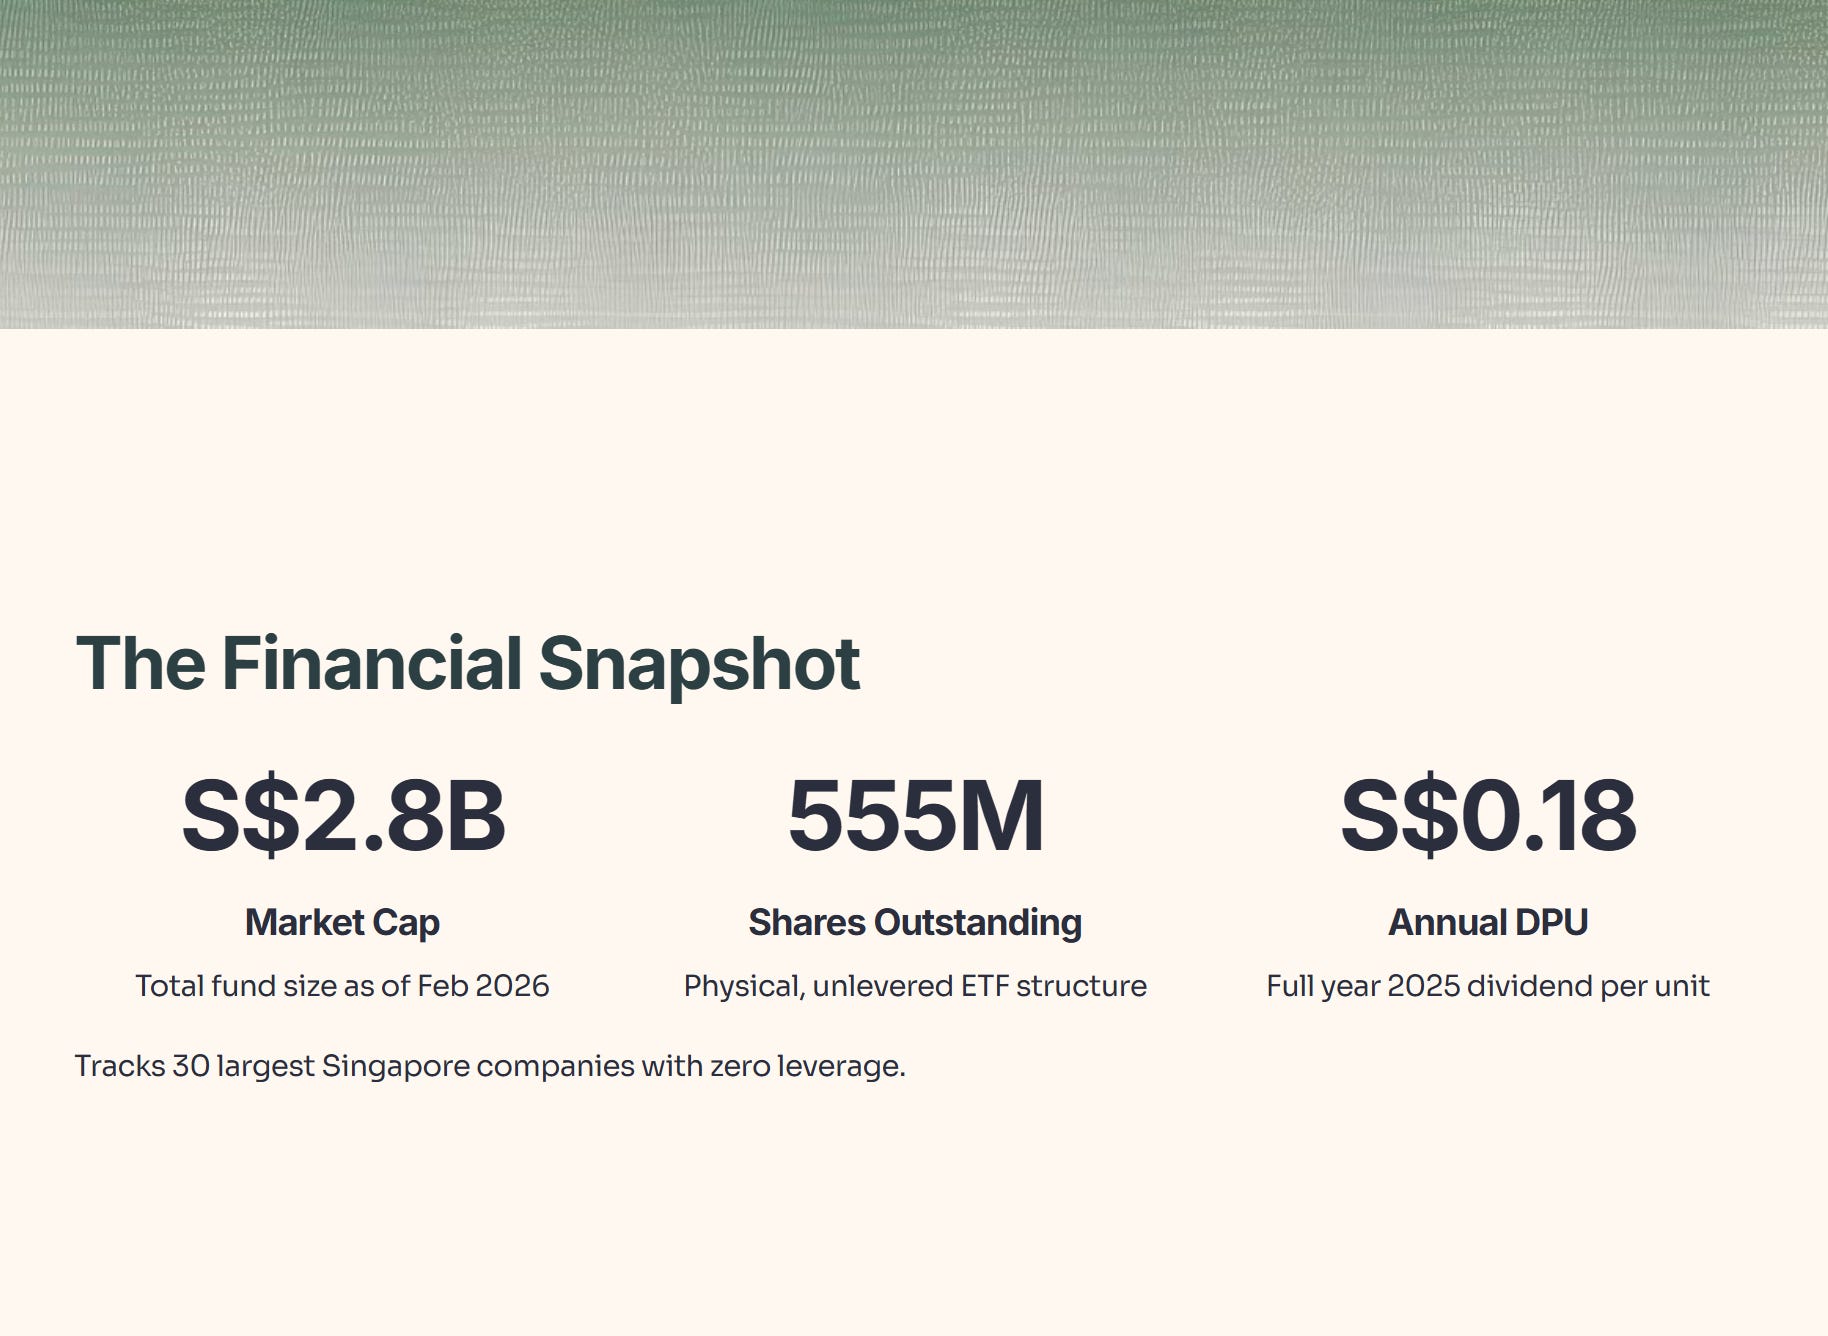
The Financial Snapshot (The Baseline)
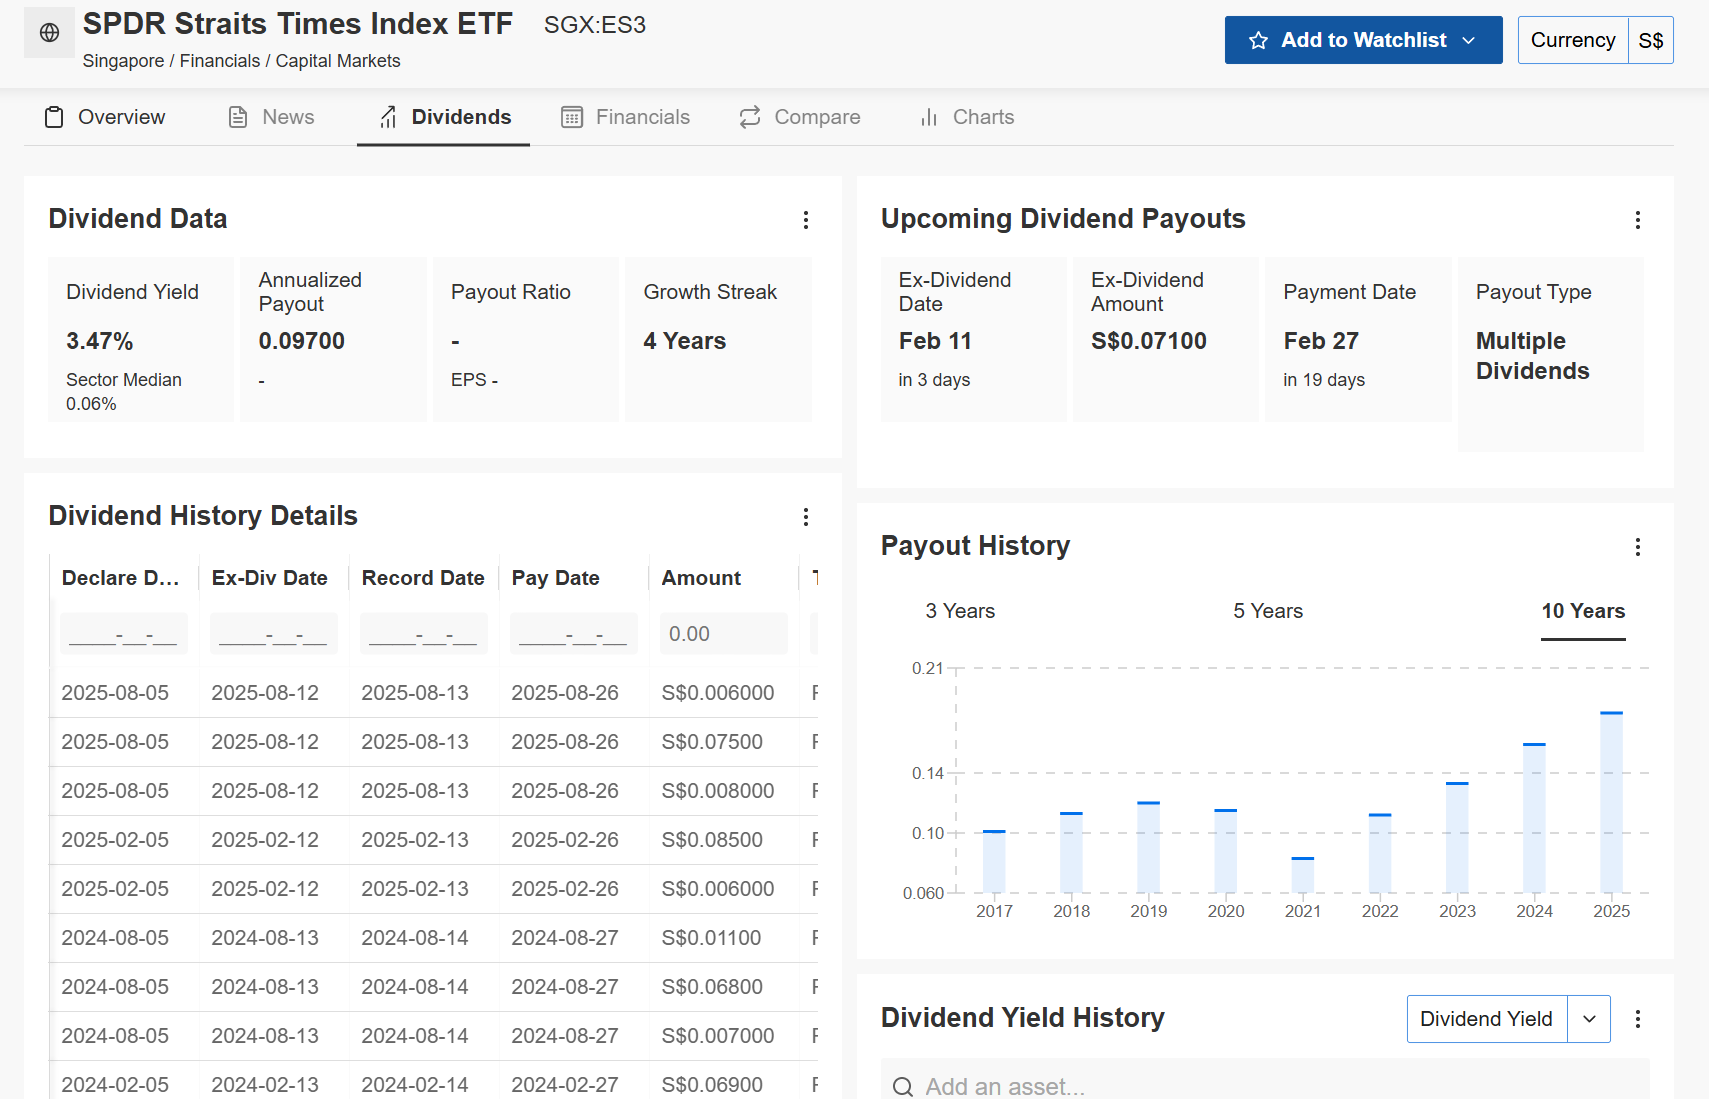
The ES3 ETF is a physical, unlevered vehicle tracking the 30 largest companies in Singapore. The latest data confirms the dividend per unit (DPU) hit S$0.18 for the full year 2025. As of February 2026, the fund’s Market Cap stands at S$2.786 Billion, with shares outstanding at 555 Million.
Financial Health Checklist
Iggy’s Insight: The balance sheet is structurally robust because the ETF operates without leverage. However, with the price oscillating at the high end of its S$3.39 – S$5.11 52-week range, the market is currently pricing in a premium for “safety” that was absent two years ago.
The “3 Good” (The Bull Case)
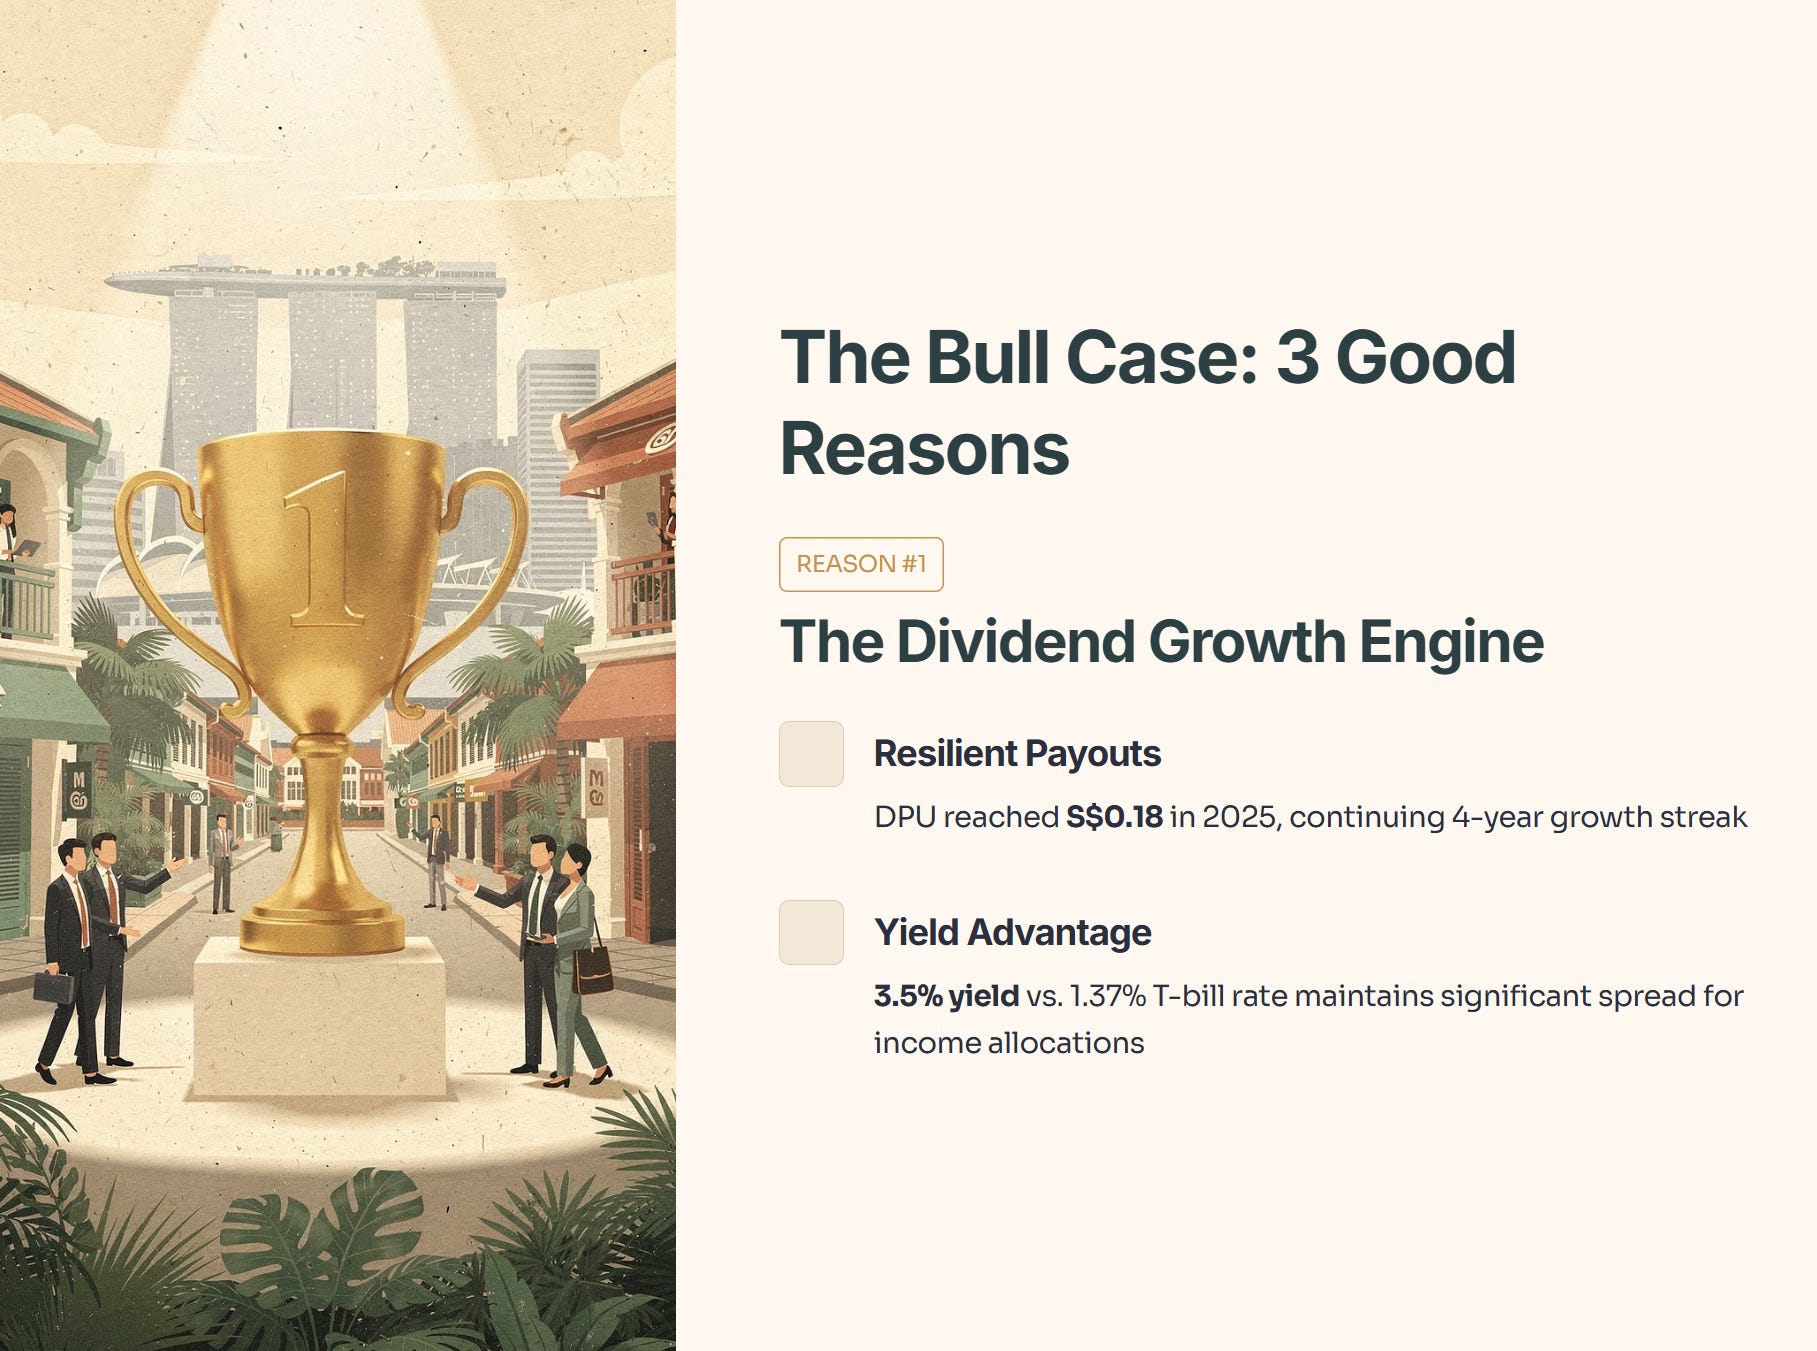
1. The Dividend Growth Engine
The primary mathematical draw for ES3 is the resilience of its payouts. The dividend per unit reached S$0.18 in 2025, continuing a 4-year growth streak. In a macro environment where the latest 6-month T-bill yield has compressed to 1.37%, the ES3’s yield of 3.5% maintains a significant spread for income-focused allocations.
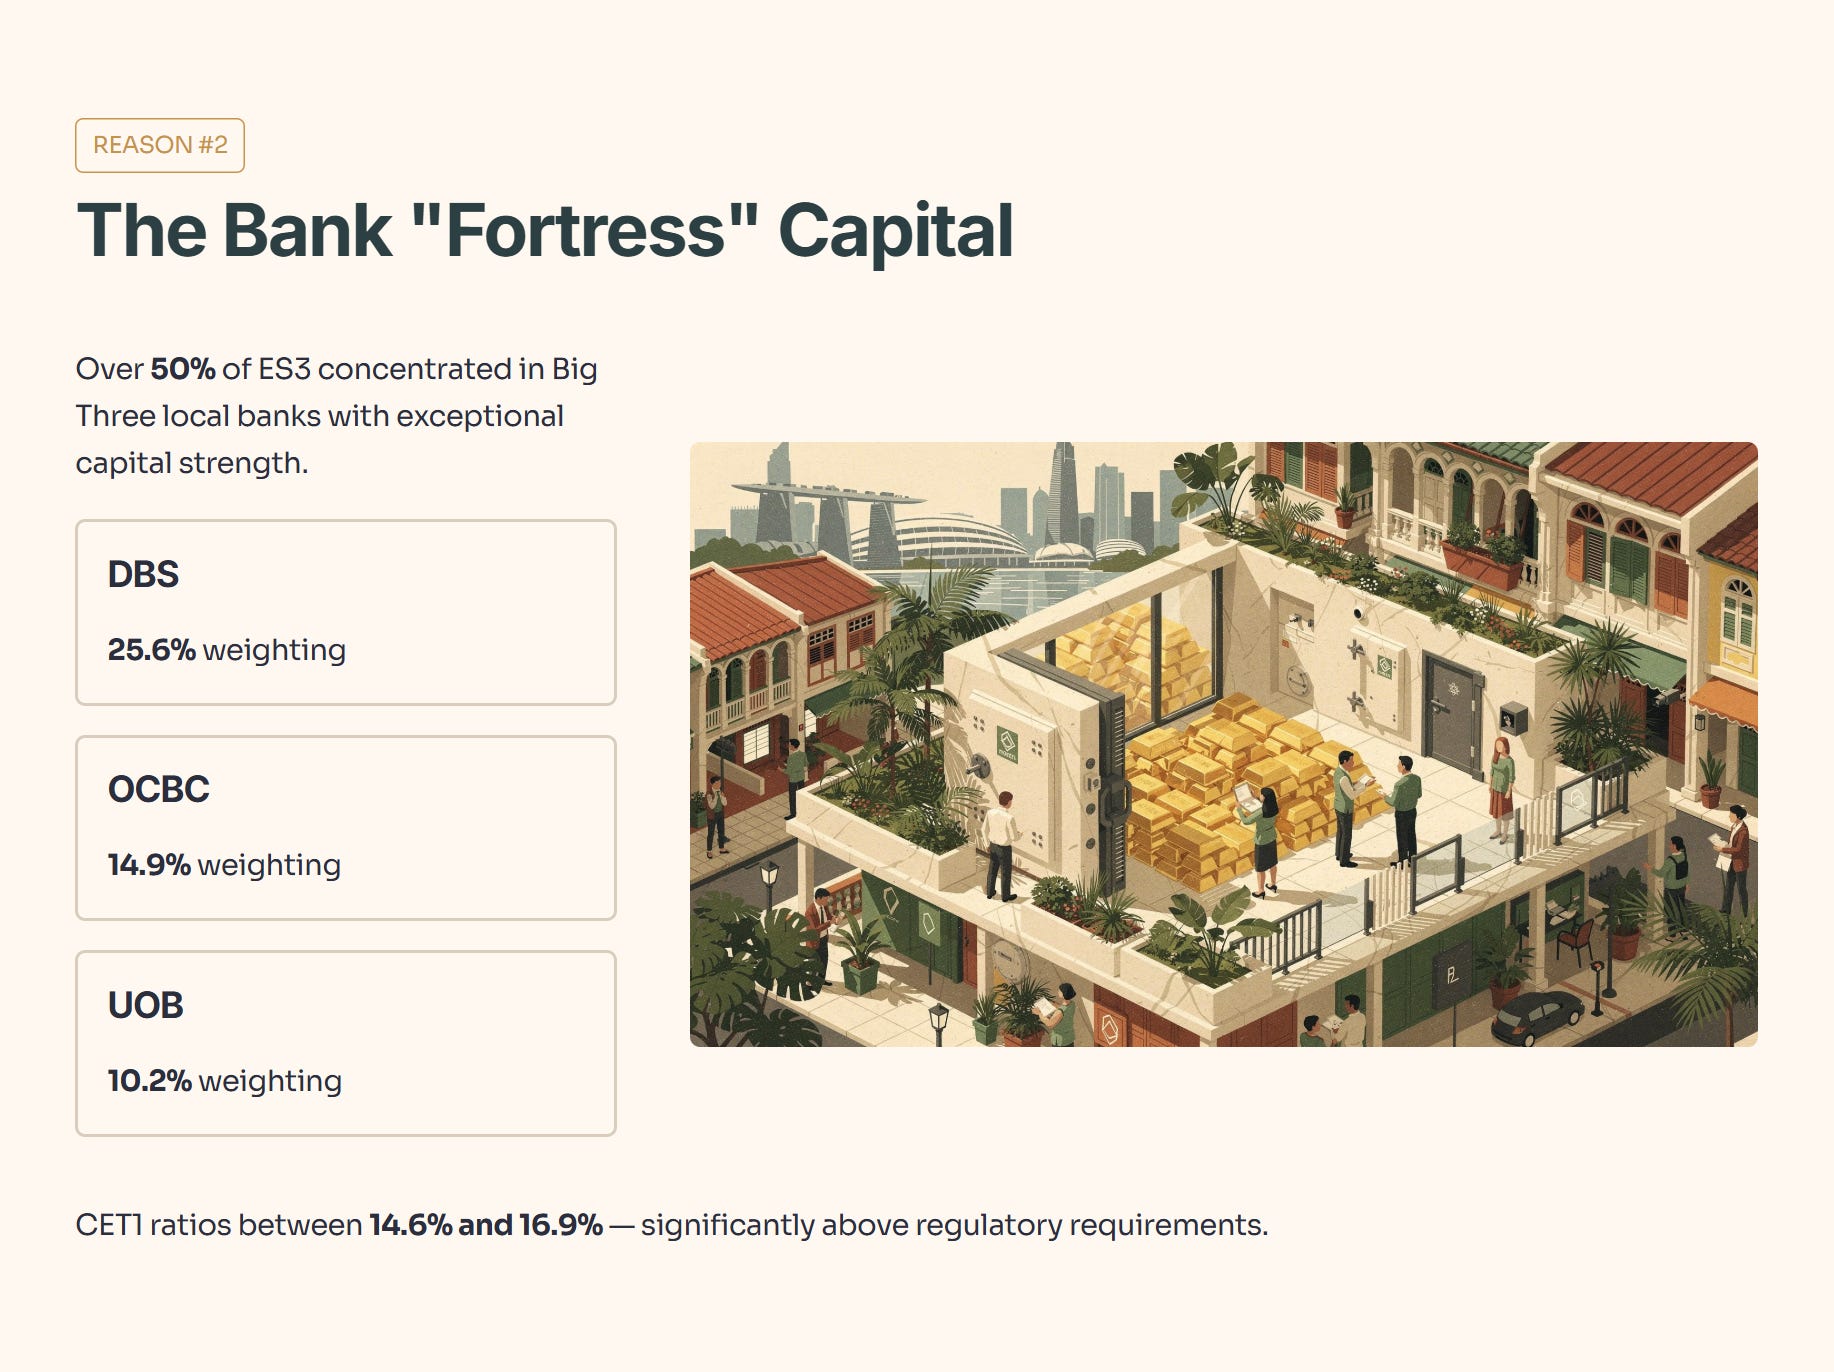
2. The Bank “Fortress” Capital
More than 50% of ES3 remains concentrated in the “Big Three” local banks: DBS (25.6%), OCBC (14.9%), and UOB (10.2%). These institutions reported CET1 ratios between 14.6% and 16.9% in late 2025. These capital buffers sit significantly above regulatory requirements, effectively tethering the ETF’s distributions to some of the strongest balance sheets in the region.
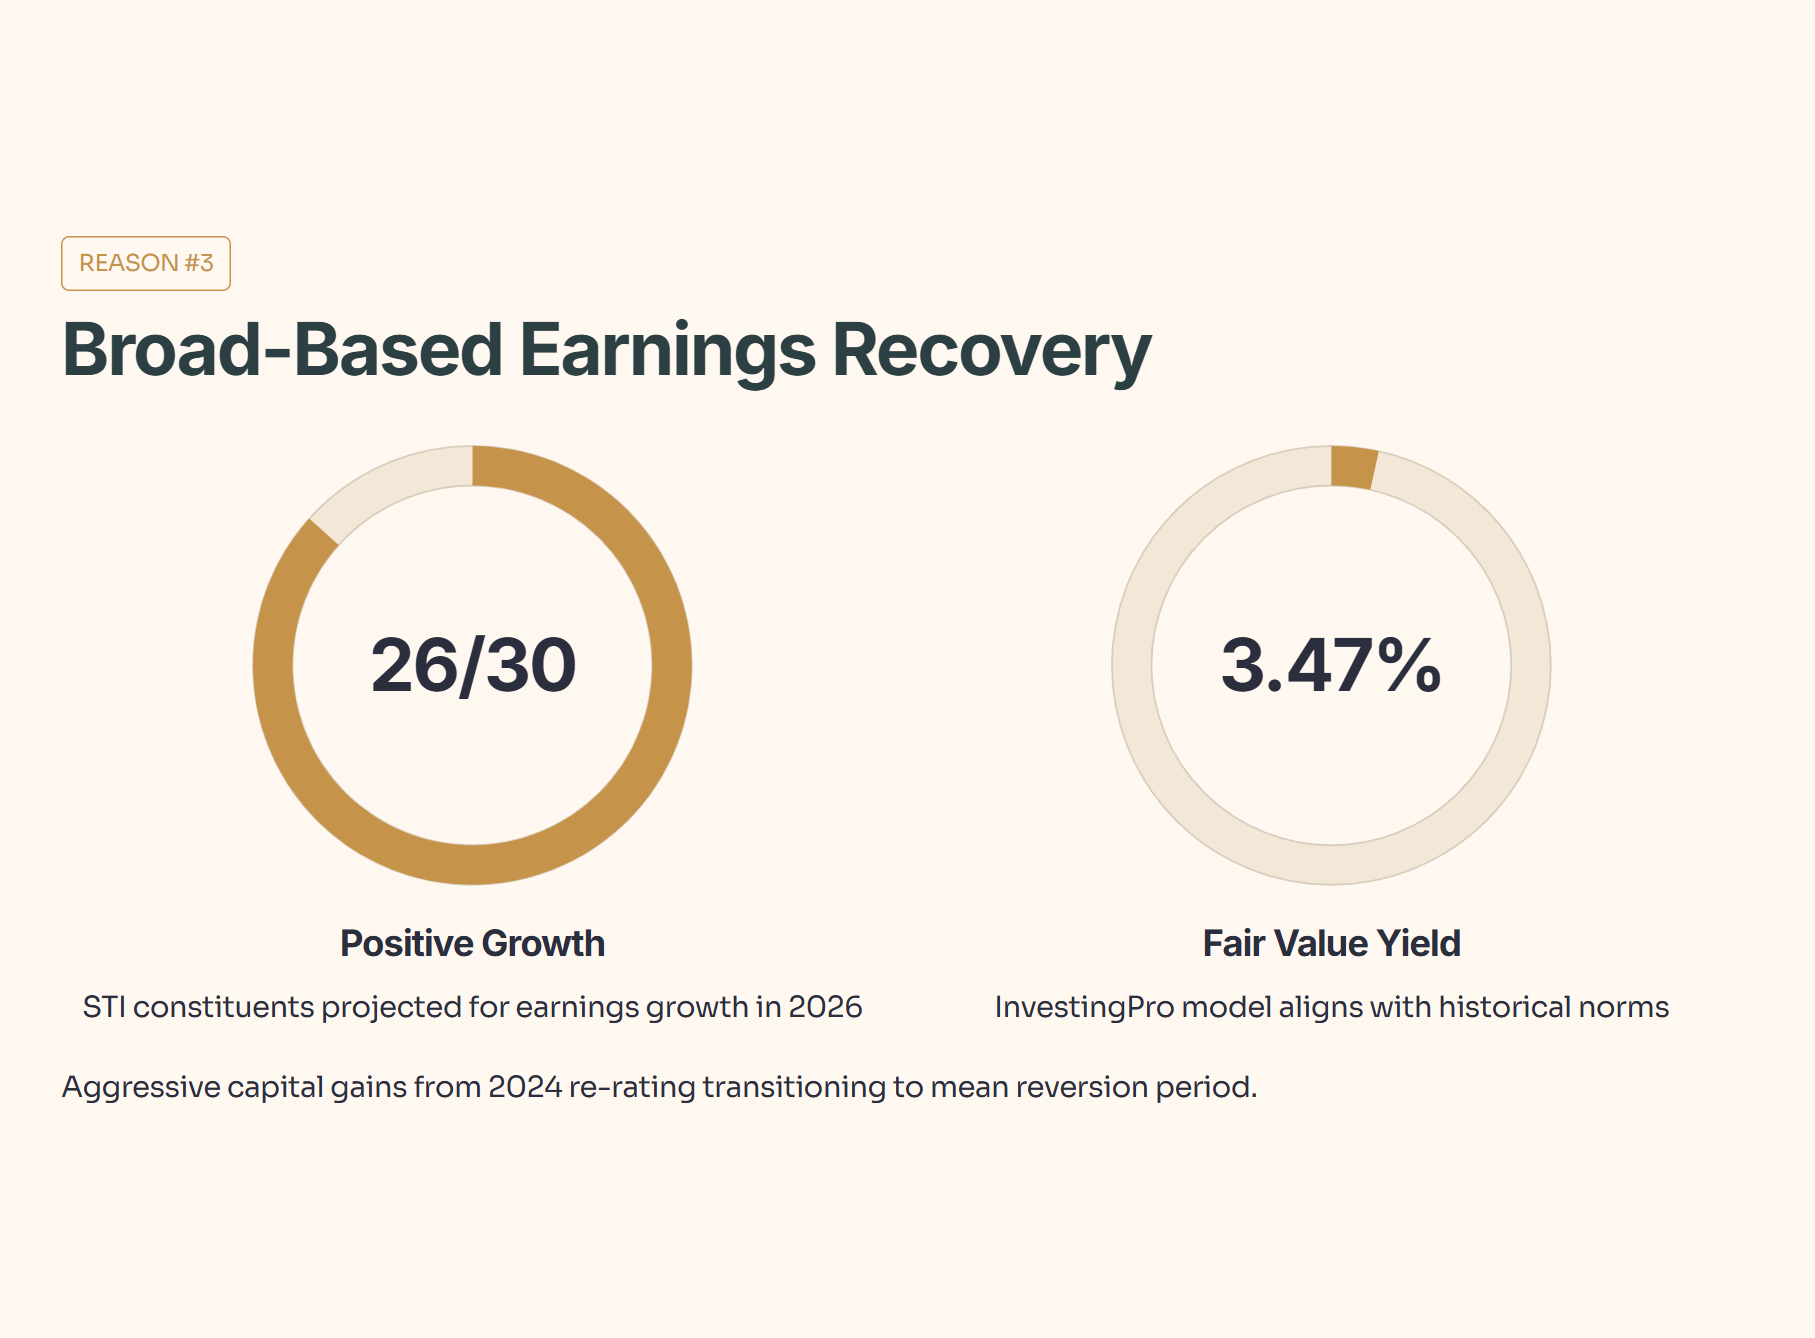
3. Broad-Based Earnings Recovery
The growth narrative appears supported by fundamental data. Beyond the banking sector, 26 of 30 STI constituents are projected to deliver positive earnings growth in 2026. The InvestingPro Fair Value model currently suggests a Dividend Yield of 3.47%. While this aligns with historical norms, it also signals that the aggressive capital gains from the 2024 re-rating may be transitioning into a period of mean reversion.
Source: InvestingPro data. Unlock these institutional tools for yourself: Use code INVESTINGIGUANA for an exclusive 50 Discount.
The “3 Red Flags” (The Bear Case)
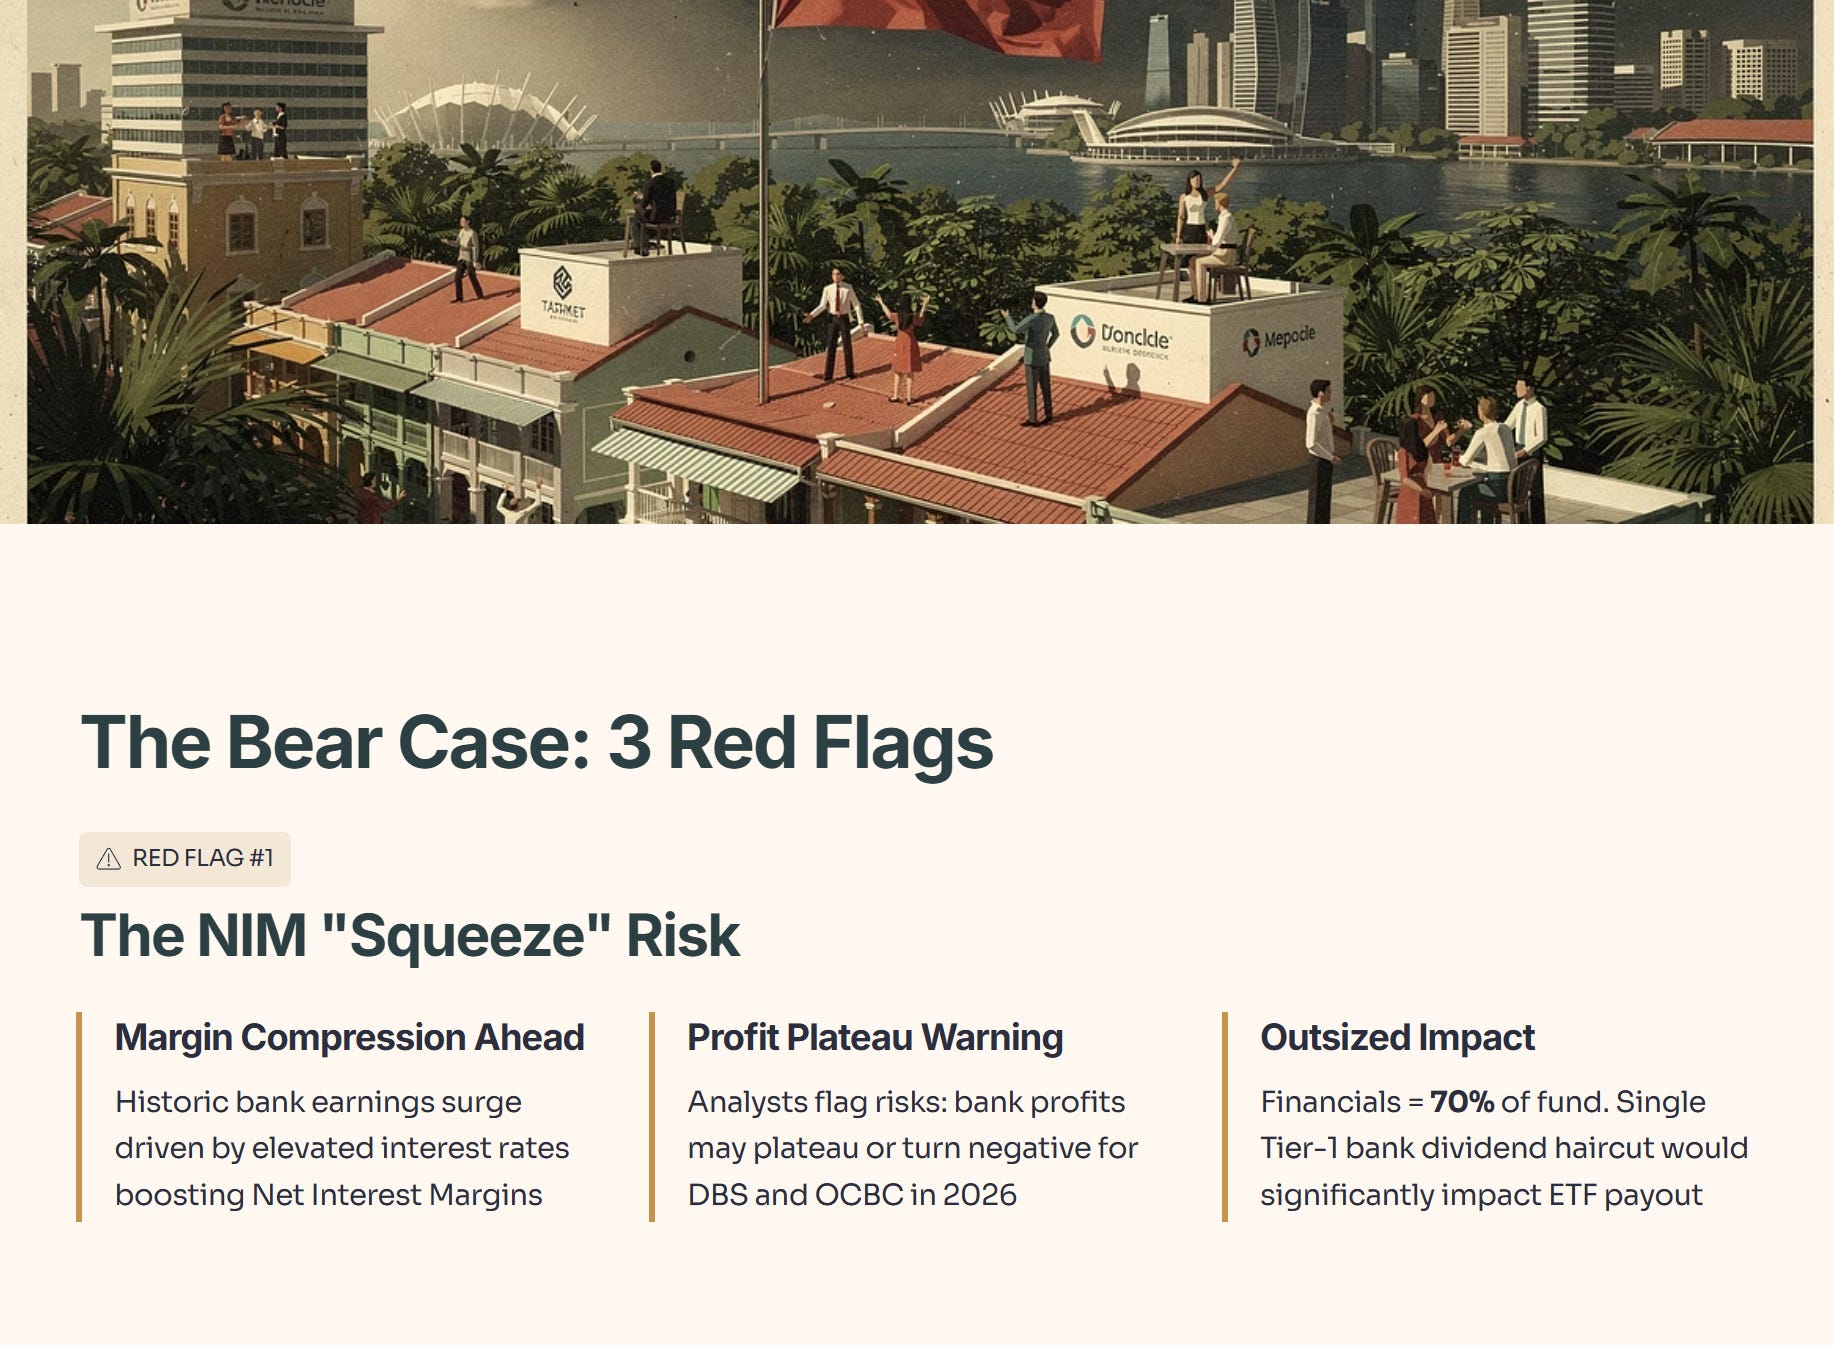
1. The NIM “Squeeze” Risk
The historic surge in bank earnings was largely a byproduct of elevated interest rates boosting Net Interest Margins (NIM). Analysts are now flagging risks that bank profits in 2026 may plateau or turn negative for giants like DBS and OCBC as margins compress. Given that financials represent nearly 70% of the fund’s sector exposure, a dividend haircut from a single Tier-1 bank would have a mathematically outsized impact on the ETF’s total payout.
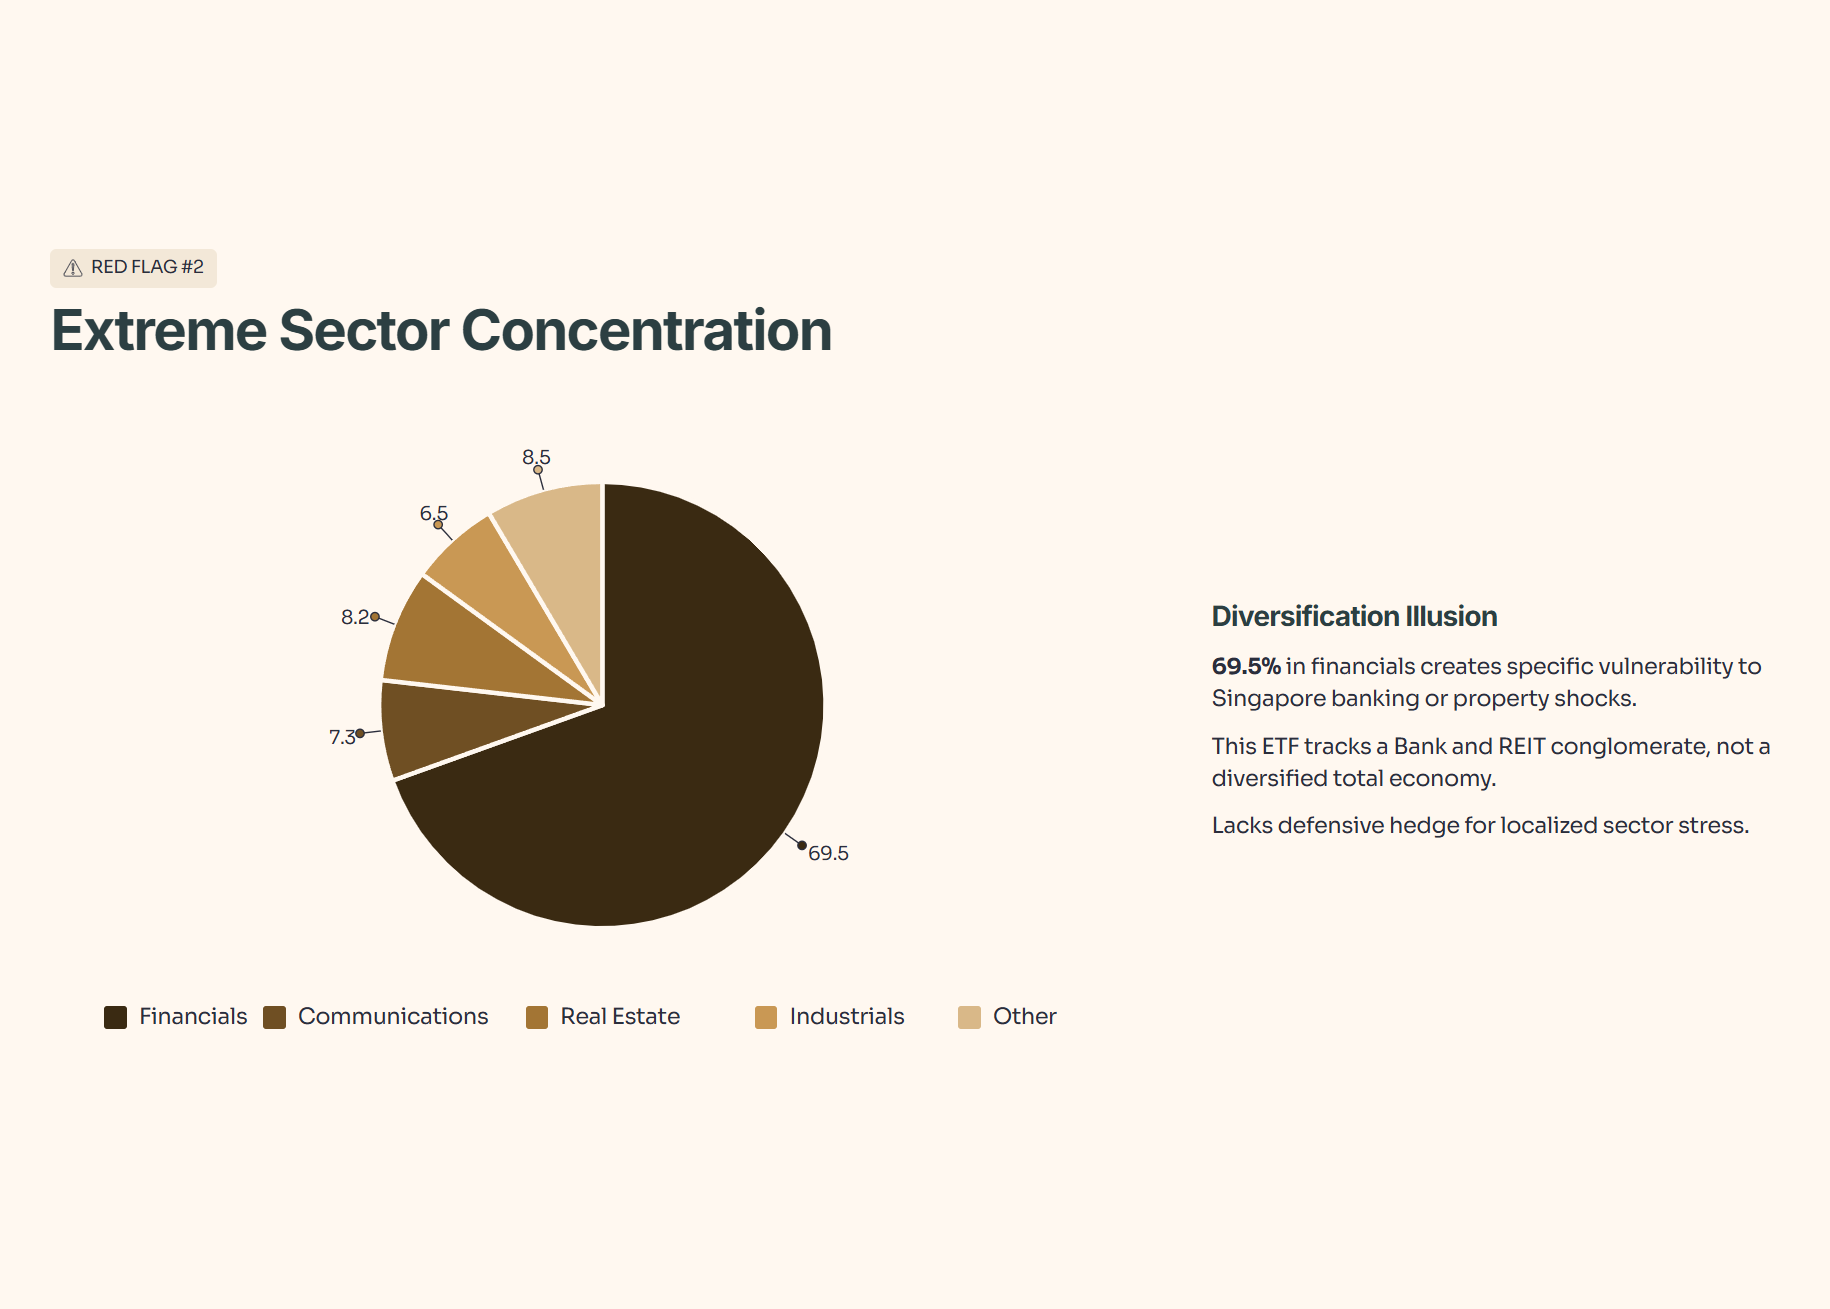
2. Extreme Sector Concentration
Diversification within the STI is arguably an illusion. Financials comprise 69.5% of the portfolio, followed by Communications at 7.3%. This creates a specific vulnerability: in the event of a localized shock to the Singapore banking or property sectors, the ETF lacks a defensive hedge. This vehicle tracks a Bank and REIT conglomerate rather than a diversified “total economy.”
Now here’s the part most investors miss: even if banks stay ‘fine,’ ES3 can still hit a wall at these prices—so the key question is what level (and yield) would make this risk mathematically worth it.
