



31 SGX Stocks Are Near Their 52-Week Low. Nine Yield 8% or More 🦖
A 52-week low says where a price has been. It does not say why the price is there, or whether the payout behind a high yield has changed. Here is what Beansprout’s screen of 5 November shows, and what it leaves out.
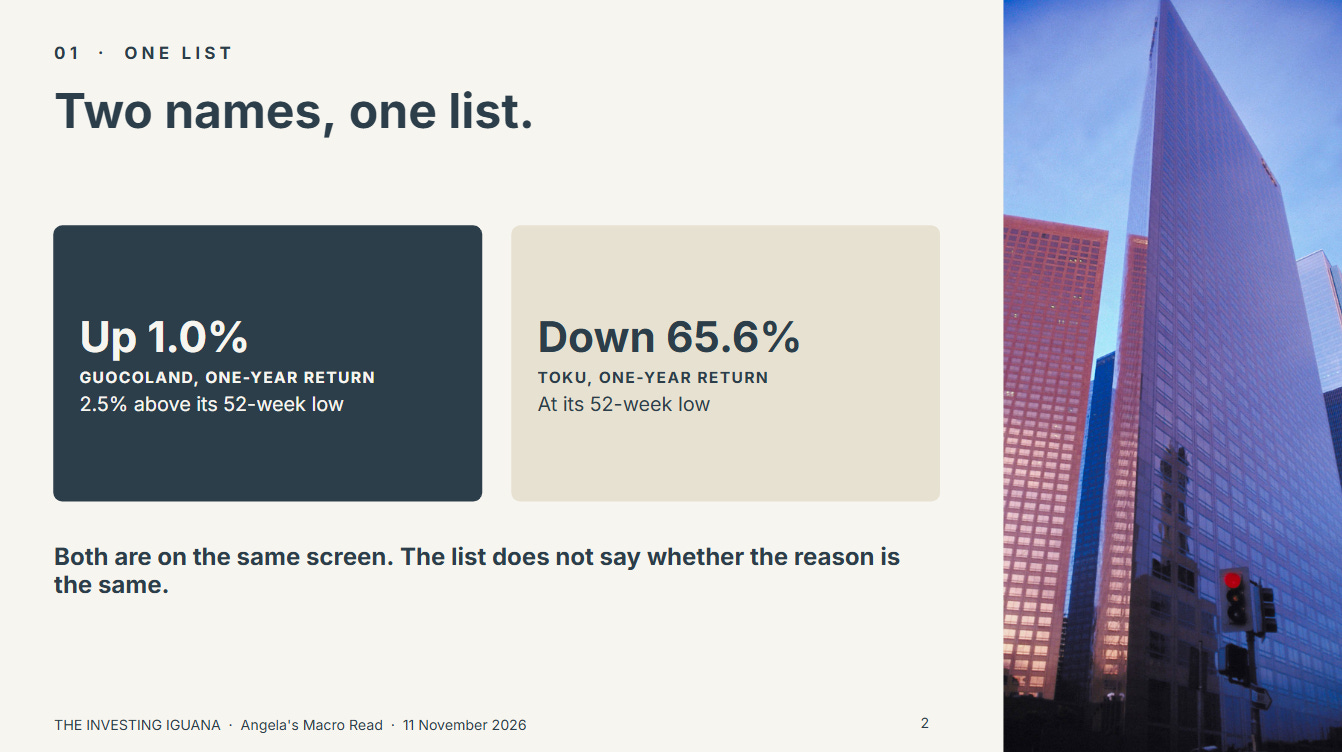
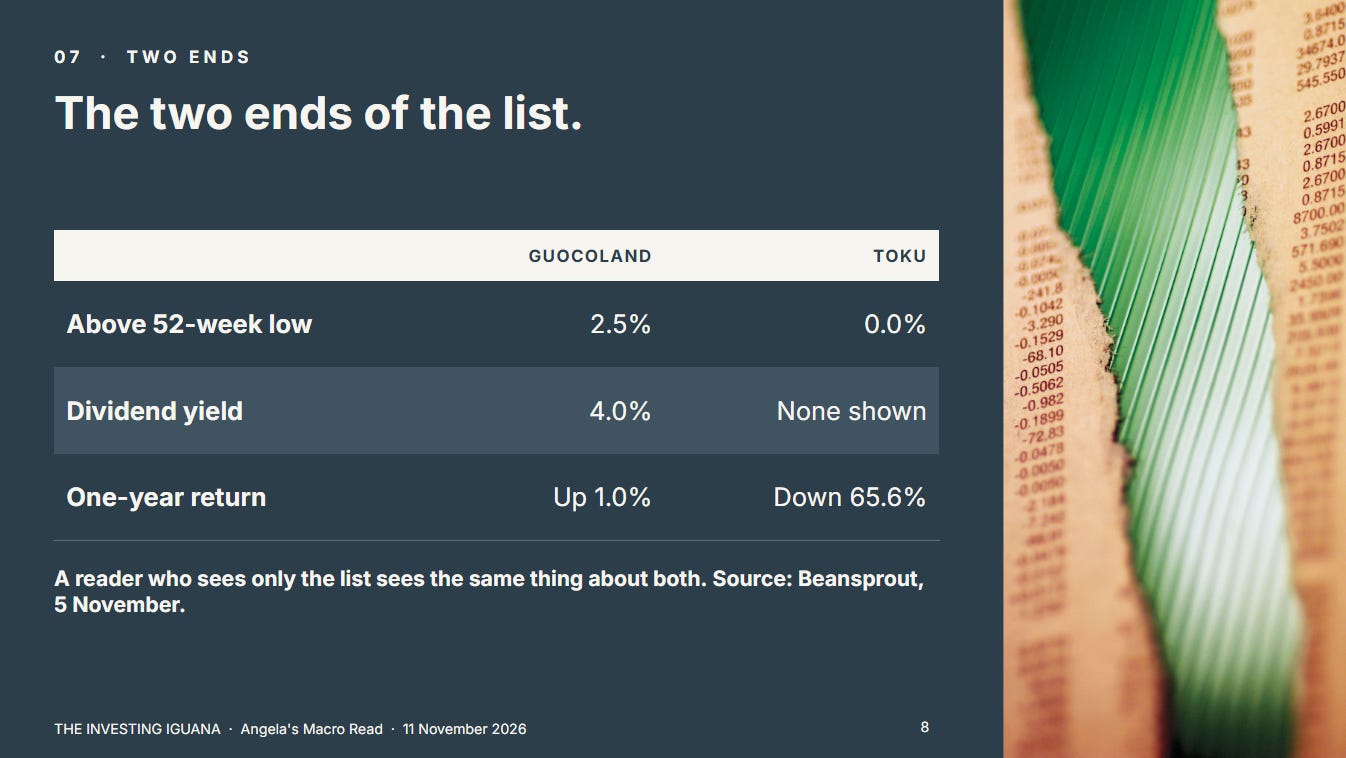
Beansprout’s screen of Singapore-listed stocks and REITs trading within 5% of their lowest price in the past year listed 31 names on 5 November 2026. One of them, GuocoLand, had a one-year return of +1.0%. Another, Toku, was down 65.6%. Both are on the list because their prices are close to the lowest of the year, and the list does not say whether the reason is the same.
When I see a list like this one, my first thought is the one many households have: a stock near its yearly low must be on sale. I want to slow that thought down, for the reader who already owns one of these names and for the reader who is only looking. I read one page for this piece, and the rest of it is about what that page can and cannot tell you.
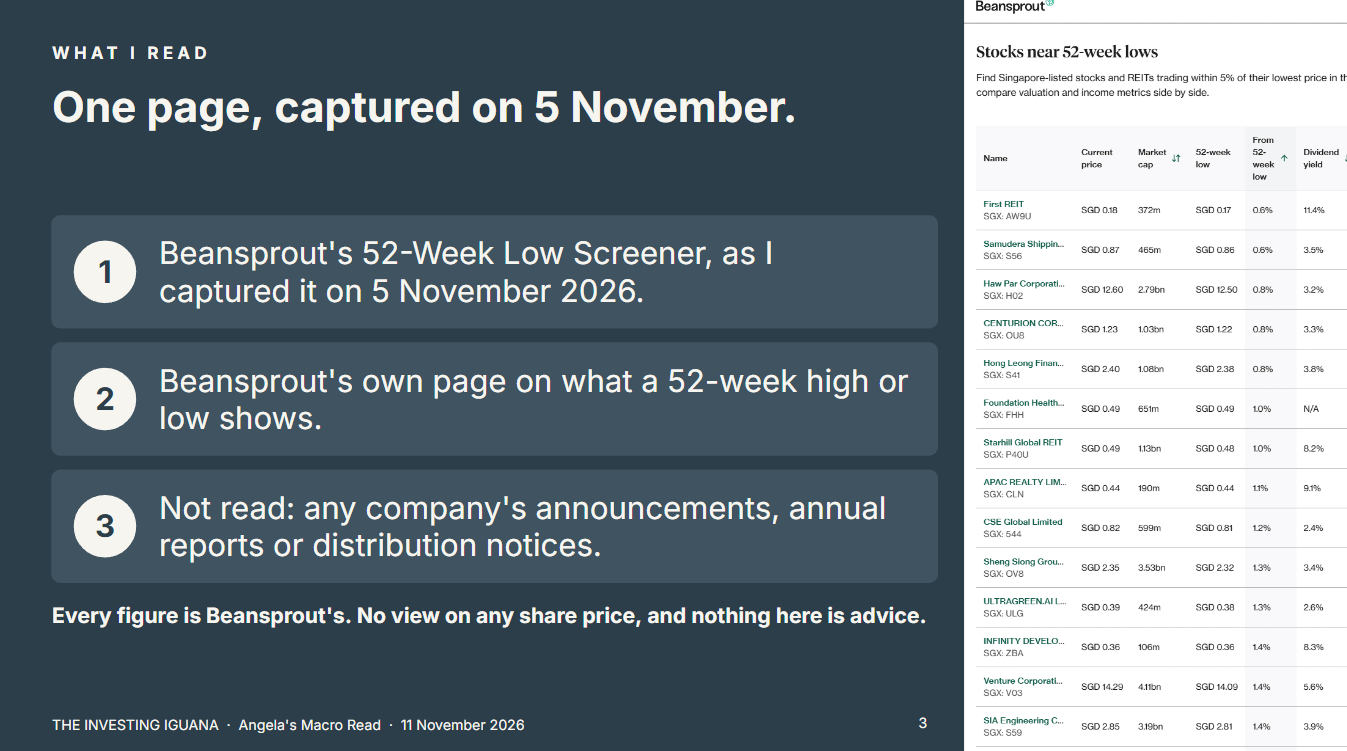
The page is the 52-Week Low Screener on Beansprout, a Singapore investing website, as I captured it on 5 November 2026, the date the page gives as its last update. The page shows one update date, and its figures can change during that day, so a later view of the page may show a different list and different figures from the ones here. I have not read any company’s announcements, annual reports or distribution notices, so nothing here says why any price moved. Every figure is Beansprout’s, as shown on the page. The page does not say how it calculates its dividend yield, price-to-book ratio or one-year return, so I report them as shown. Prices will have moved by the time you read this, and I take no view on any share price.
What This Piece Does
It sets out what the screen lists and how far each name has fallen over the year.
It shows with round numbers why a falling price raises a yield, and lists the nine names the screen shows at 8% or more.
It says what a 52-week low cannot tell you, and where Iggy’s company reports pick up.
The count, the spread of one-year returns, the yield arithmetic, the nine names, Angela’s first Observation and the currency and price-to-book notes are free to read. All 31 names grouped by yield, three pairs of names with similar yields and very different price histories, three questions to ask of any name, what the screen does not say and my second Observation are for paid members. Nothing here is advice on your own investments.

What This Piece Does
What the Screen Lists
A Low Is a Distance, Not a Reason
How far has each one fallen?
Why a Falling Price Raises the Yield
The nine names at 8% or more
Angela’s Observation
Currency and Price to Book
What the Paid Half Adds
All 31 Names, Grouped by Yield
Three pairs with similar yields
Three questions before a name on this list means anything
What the Screen Does Not Say
Angela’s Observation
Iggy’s Forensic Read
What the Screen Lists
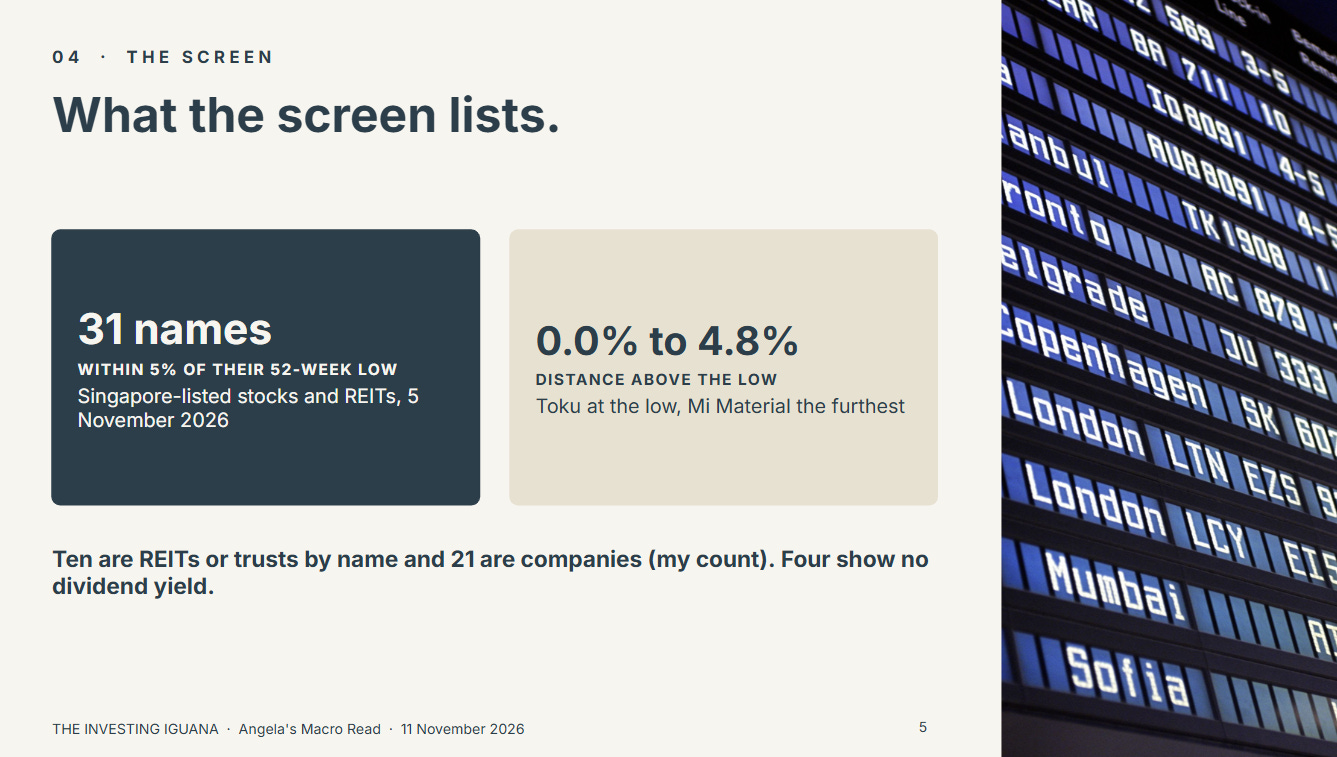
Beansprout’s screen lists Singapore-listed stocks and REITs whose current price is within 5% of their lowest price in the past year. For each name it shows the current price, the market capitalisation, the 52-week low, how far the price sits above that low, a dividend yield, a price-to-book ratio and a one-year return. On 5 November it listed 31 names. The distance above the low runs from 0.0% for Toku to 4.8% for Mi Material, so every name is close to its low, and some are at it.
Going by their names, ten of the 31 are REITs or trusts (my own count): First REIT, NetLink NBN Trust, Elite UK REIT, Stoneweg Europe Stapled Trust, Asian Pay Television Trust, Starhill Global REIT, Parkway Life REIT, Mapletree Industrial Trust, IREIT Global and UI Boustead REIT. The other 21 are companies. Four show no dividend yield at all. The count is the easy part. The harder part is what a place on the list means.
A Low Is a Distance, Not a Reason
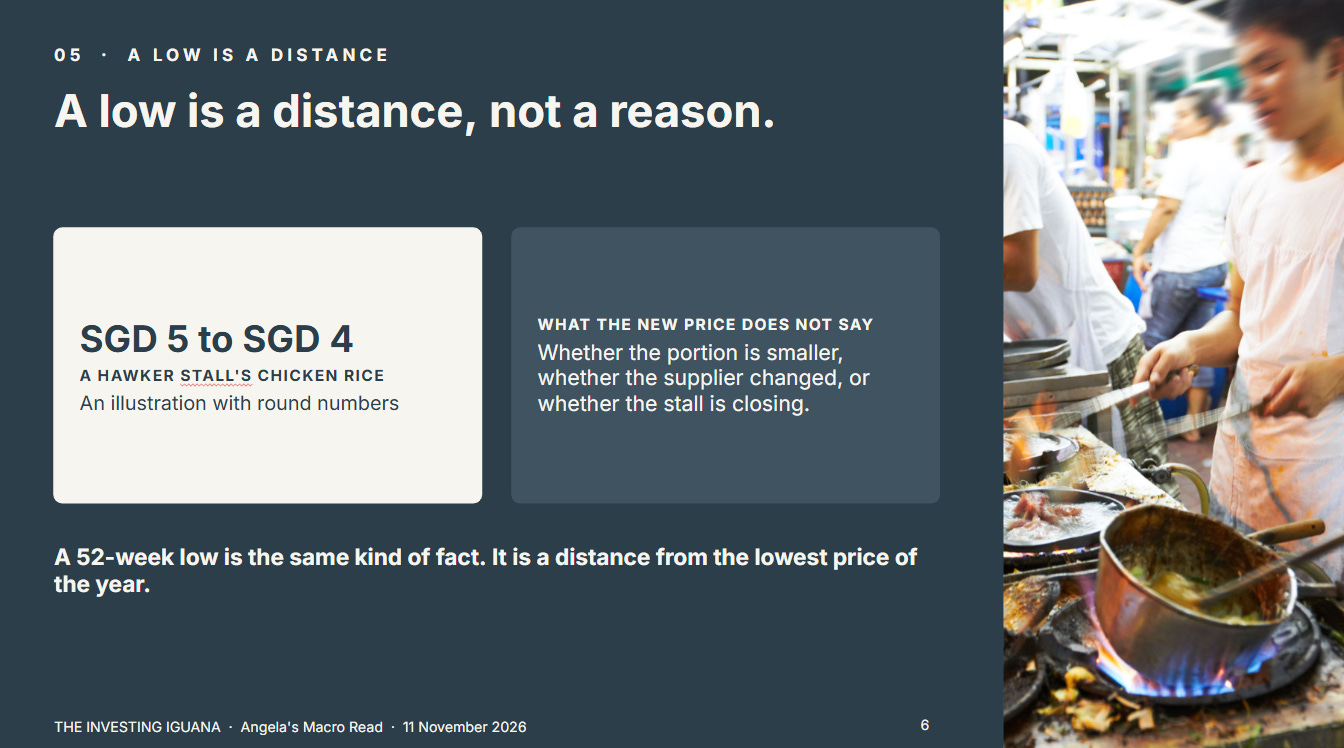
A hawker stall that has marked its chicken rice down from SGD 5 to SGD 4 has told you the new price. It has not told you whether the portion is smaller, whether the supplier has changed or whether the stall is closing. A 52-week low is the same kind of fact. It is a distance from the lowest price of the year, and the screen does not say how the price got there.
How far has each one fallen?
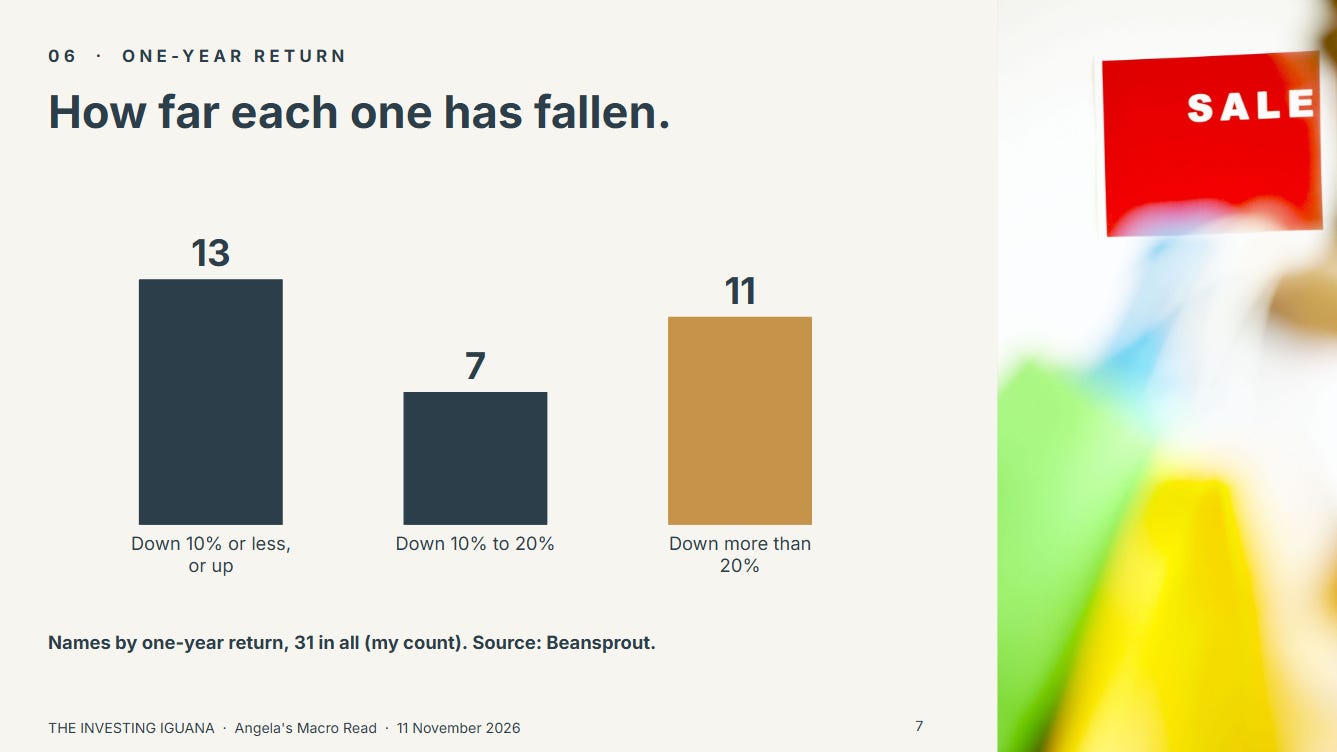
The one-year return column shows how different the 31 are. Thirteen show a one-year return of -10% or better, which includes GuocoLand at +1.0% and Parkway Life REIT at 0.0%. Seven are down between 10% and 20%. Eleven are down more than 20%, from China Sunsine at 20.4% to Toku at 65.6% (my own count from the column). The page does not say whether the one-year return includes dividends, so I treat it as the change over the year as Beansprout shows it.
GuocoLand’s price is 2.5% above its 52-week low and its one-year return is +1.0%, so over the year its price has hardly moved. Toku’s price is at its low and its one-year return is -65.6%. They sit on the same list, and the other columns differ as well: GuocoLand shows a yield of 4.0% and Toku shows none. A reader who sees only the list sees the same thing about both of them.
Nothing so far involves the payout. That is where the list gets more interesting.
Why a Falling Price Raises the Yield
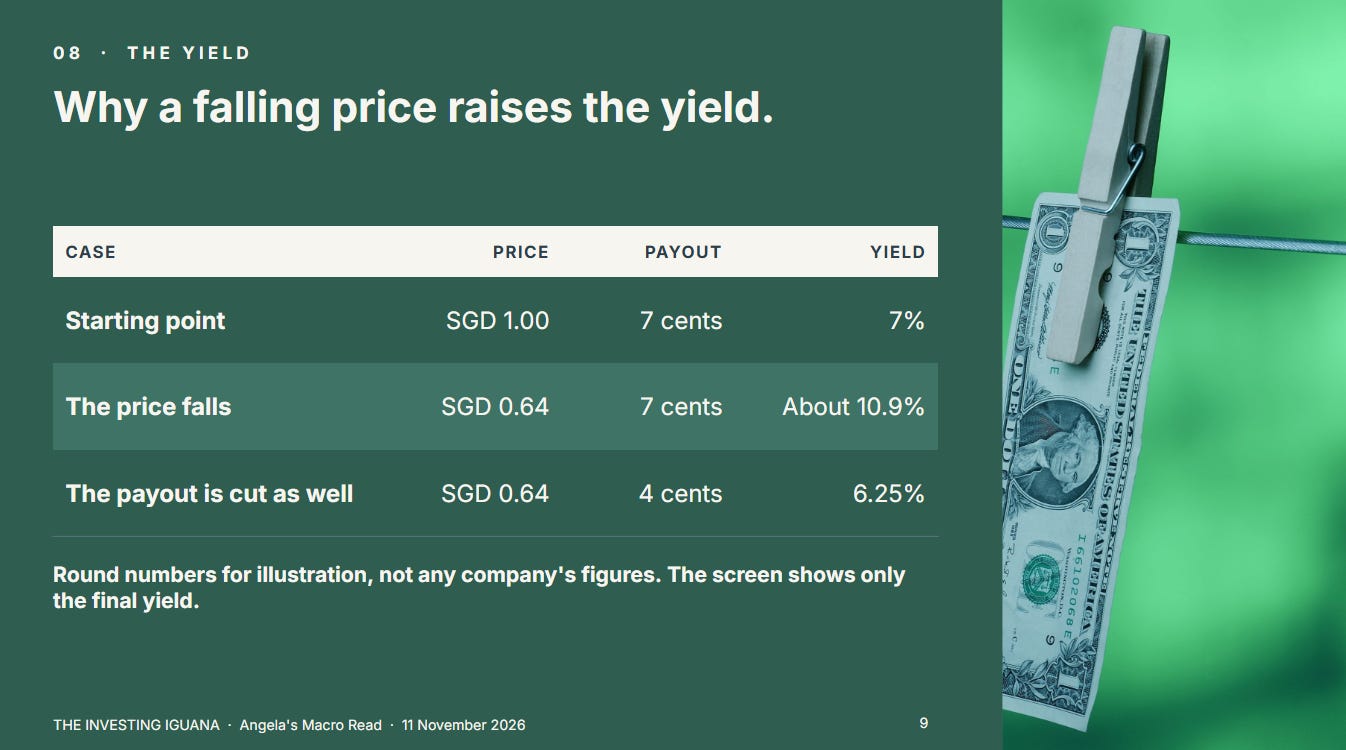
A dividend yield is the yearly payout divided by the price. Take round numbers. A share pays 7 cents a year and costs SGD 1.00, so the yield is 7%. If the price falls to SGD 0.64 and the payout stays at 7 cents, the yield rises to about 10.9%. If the payout is cut to 4 cents as well, the yield is 6.25%. These are illustrations, not any company’s figures. The screen shows only the final yield, so it cannot show which of these cases applies to any name.
The nine names at 8% or more
Nine of the 31 show a dividend yield of 8% or more. The yield, the one-year return and the price-to-book ratio below are as Beansprout shows them on 5 November.
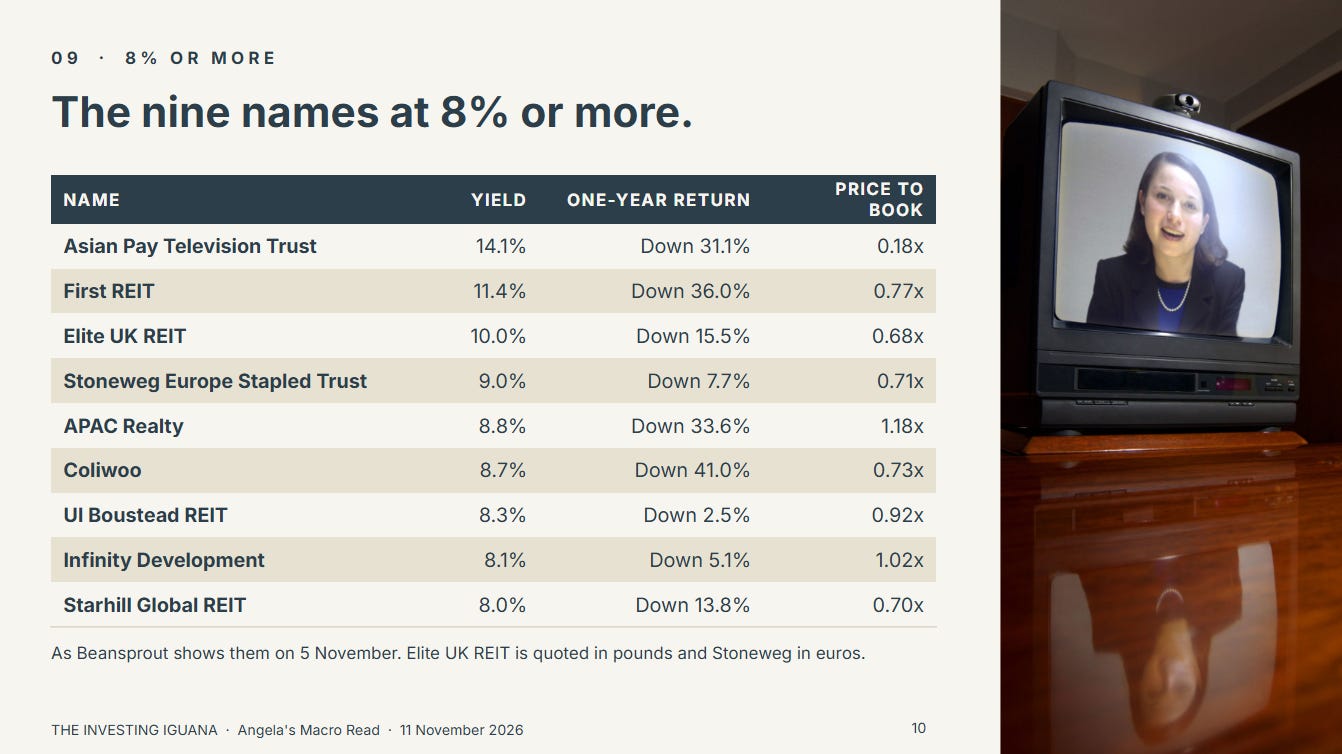
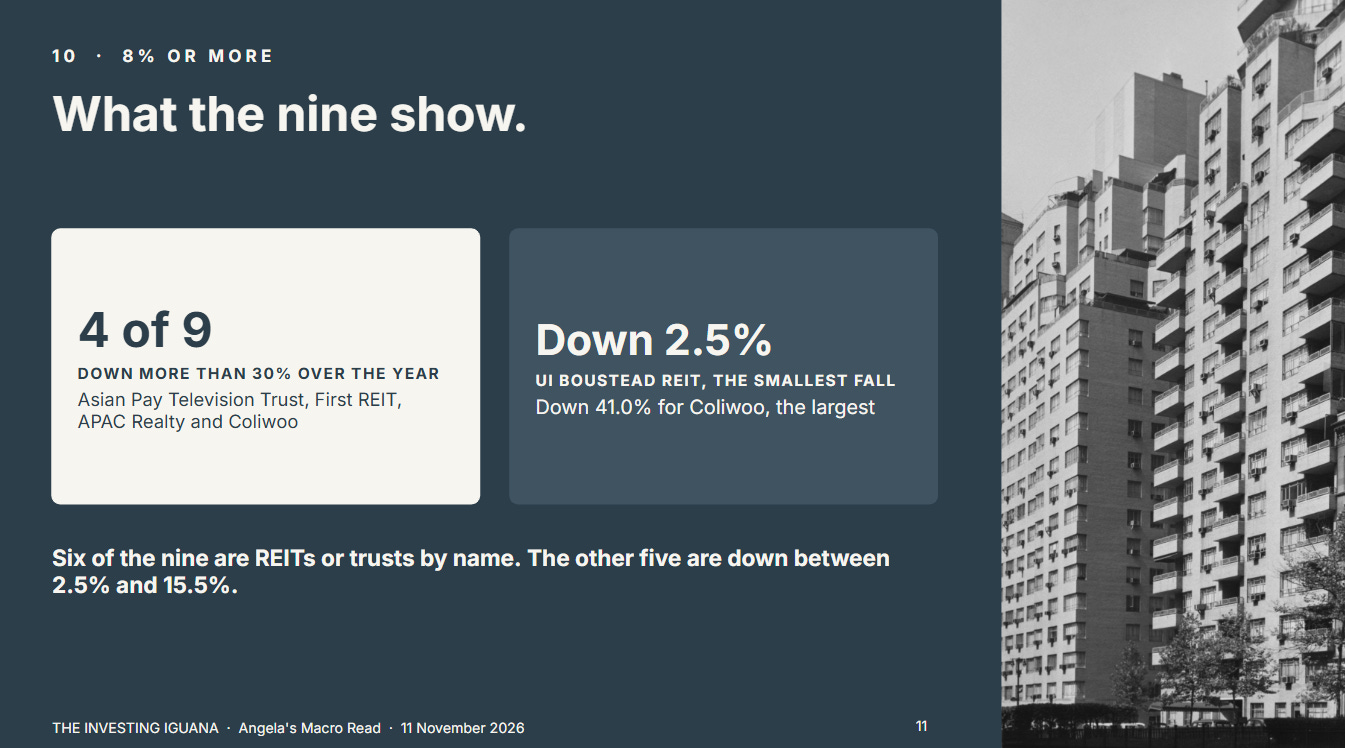
Six of the nine are REITs or trusts by name. Seven show a price-to-book ratio below 1.0x (my own count), the exceptions being APAC Realty at 1.18x and Infinity Development at 1.02x. The one-year returns run from -2.5% for UI Boustead REIT to -41.0% for Coliwoo. Four of the nine are down more than 30%: Asian Pay Television Trust, First REIT, APAC Realty and Coliwoo. The other five are down between 2.5% and 15.5%.
🟠 Angela’s Observation
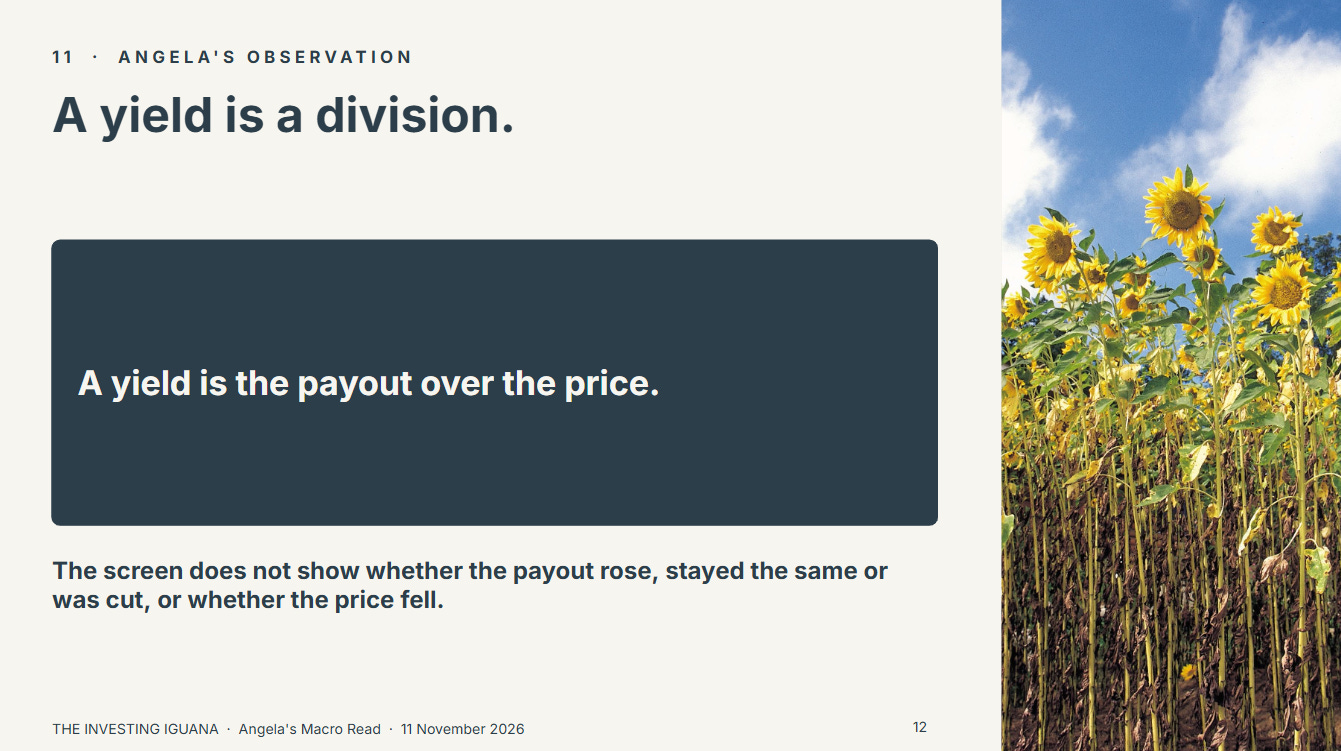
A yield is a division: the payout over the price. For a long time I read it as a number the company chooses, and I looked at the largest one first. The screen shows 14.1% next to one name and 8.0% next to another, and it does not show whether the payout rose, stayed the same or was cut, or whether the price fell. Two of the nine are down 2.5% and 5.1% over the year, and four are down more than 30%, so the same yield band holds very different price histories. When I see a high yield, do I ask what happened to the price before I ask what it pays?
Currency and Price to Book
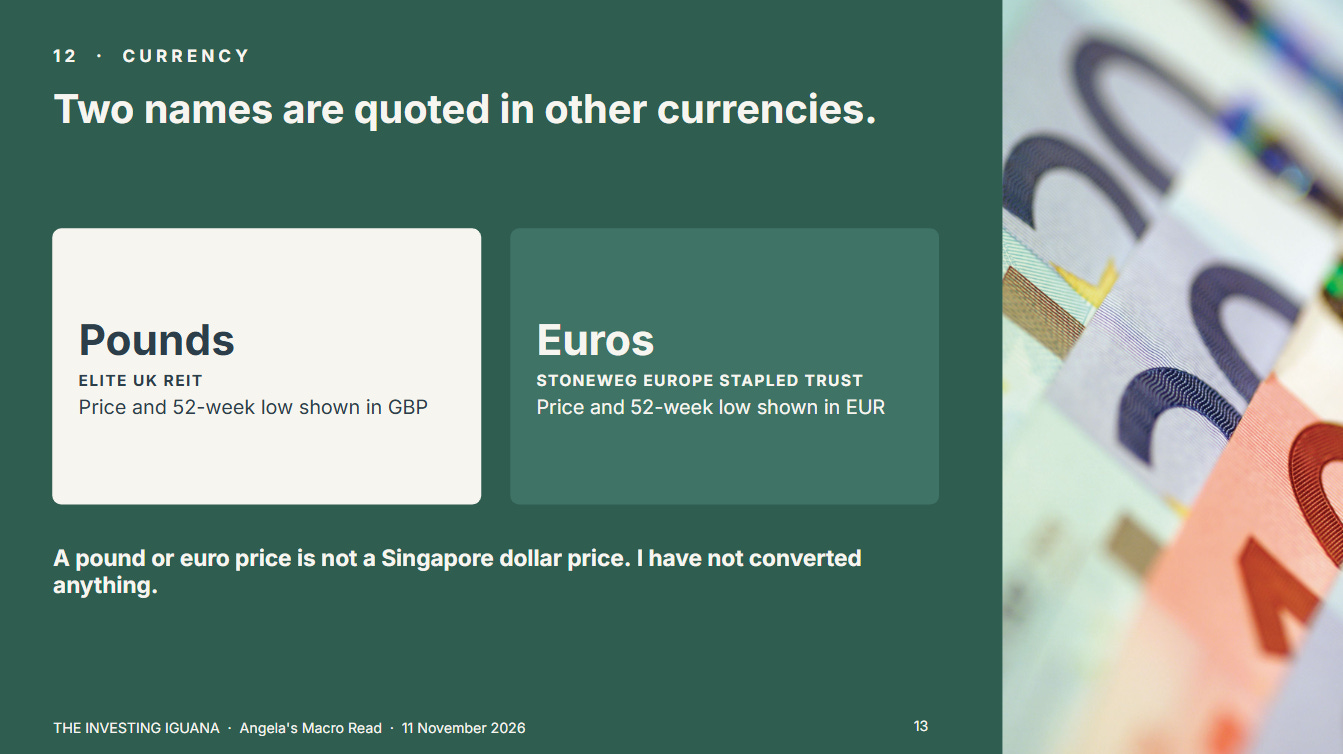
Two names are quoted in other currencies on the screen: Elite UK REIT in pounds and Stoneweg Europe Stapled Trust in euros. Their prices and 52-week lows appear in those currencies. For a reader who buys through a Singapore account, a pound or euro price is not a Singapore dollar price, and I have not converted anything.
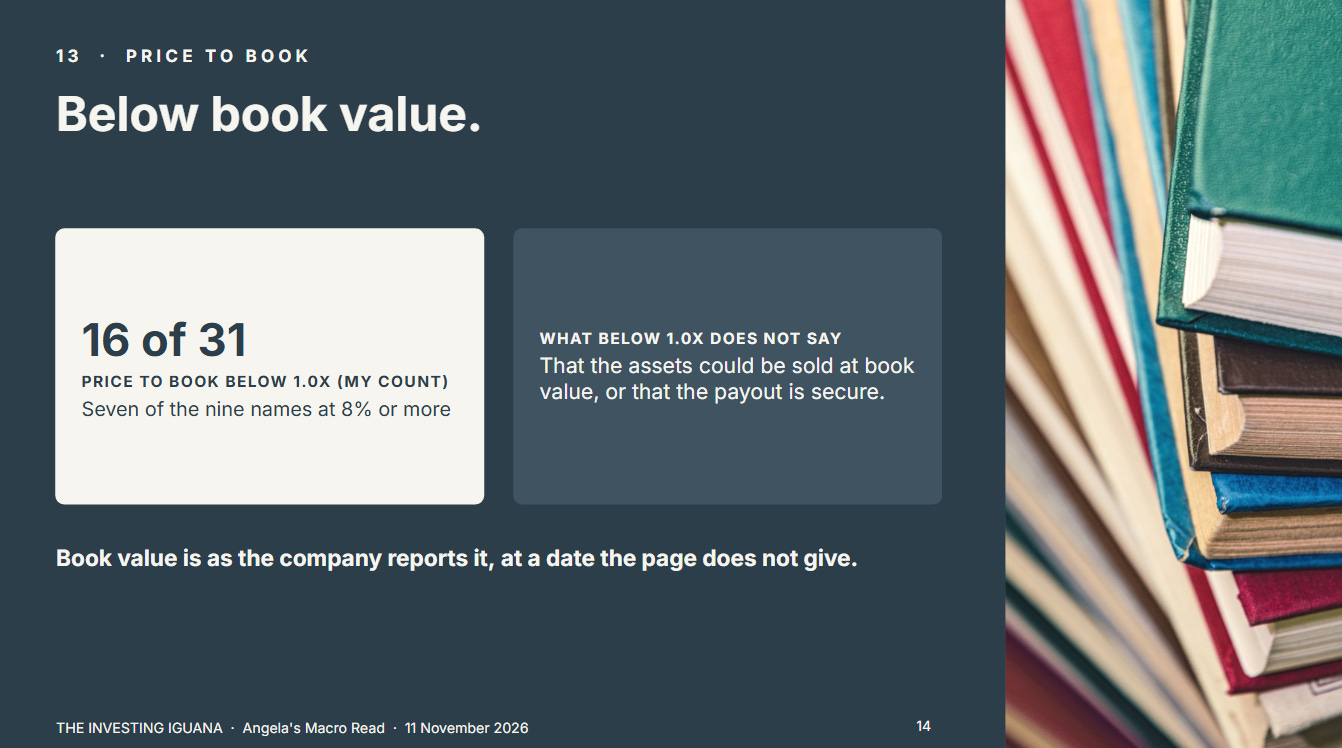
Sixteen of the 31 show a price-to-book ratio below 1.0x (my own count), and seven of the nine at 8% or more are among them. A ratio below 1.0x says the price is below the book value as the company reports it, at a reporting date the page does not give. It does not say the assets could be sold at book value, and it does not say the payout is secure. Beansprout’s separate page on 52-week highs and lows makes a similar point about price levels: a low price does not by itself show that a stock is undervalued.
What the Paid Half Adds
The free half sets out what the screen shows. The paid half takes up what it leaves open: all 31 names grouped by yield with the median one-year return in each group, three pairs of names that show similar yields and very different price histories, the three questions I would ask of any name on the list, the list of what the screen does not say, and my second Observation. Paid members get the full written analysis for its depth, not for any earlier access.
Substack Only is USD 8 a month for the full written analysis, portfolio walkthroughs and analyst cheatsheets.
YouTube Only is SGD 5 a month for the full-length Members Edition video.
The YouTube/Substack Combo is SGD 12 a month and includes all of it.
🔒 What’s Next
Four of the nine names yielding 8% or more are down more than 30% over the year, and the next section sets them beside names in the same yield bands whose prices have barely moved.
