



All 21 Economists in This Survey Call AI Singapore’s Best Case for 2026. Most Also Call It a Top Risk.
GDP beat forecasts. Inflation undershot them. The tightening bet grew anyway. Here’s what that mix means for the rates behind every CPF and REIT yield calculation.
Every single respondent in MAS’s own September survey names the same thing as Singapore’s best hope for growth this year. Nearly two in three of those same forecasters also name it as a top threat to that same outlook. When a room full of professional economists agrees completely on direction and splits sharply on outcome, that split usually tells you more than the agreement does.
I want to walk through what the actual survey says before anyone tells you what it means, because the headline framing already got ahead of the numbers once this quarter. If you’re holding SGX dividend names or REITs and assume “the economy beat forecasts” is automatically good news for your portfolio and “more economists expect tightening” is automatically bad, neither assumption survives contact with what these 21 forecasters actually said.

The Survey Nobody Expected to Be This Interesting
The Growth Number That Broke the Model
Inflation Went the Other Way
What The Same 21 Economists Think MAS Does About It
The Contradiction Sitting in Table 3
What This Actually Means For The Rates Under Your Portfolio
For REITs, It’s a Small Headwind, Not a New One
For Banks, the Loan Growth Number Matters More Than the Rate Number
Which Names Actually Sit Where
Iggy’s Elite Read
Iggy’s Forensic Disclaimer
The Survey Nobody Expected to Be This Interesting
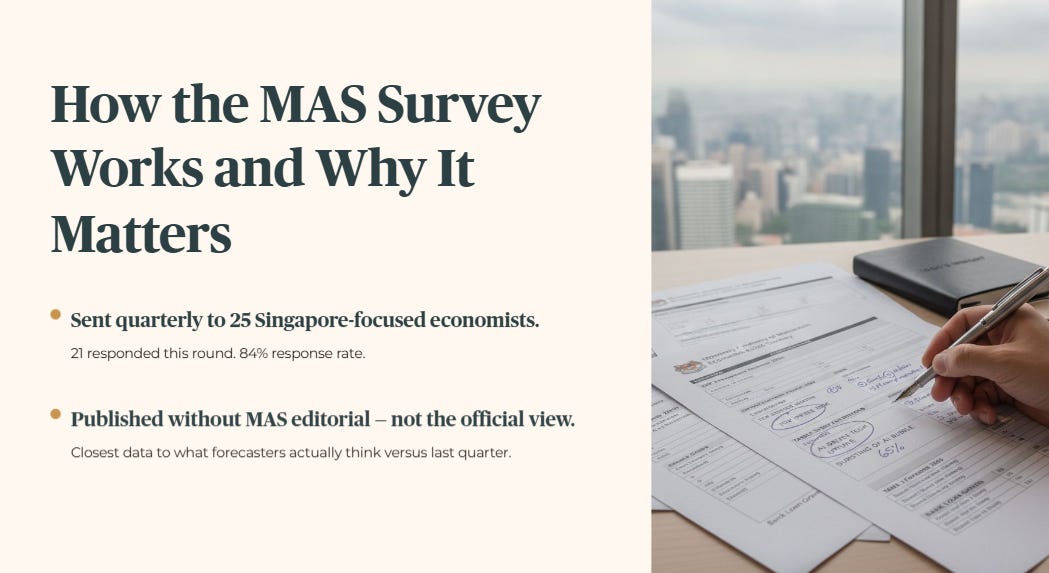
MAS runs this survey every quarter, sending it to economists and analysts who track the Singapore economy closely for a living, then publishing the results without editorial comment. It doesn’t represent MAS’s own view, and it isn’t meant to. It’s a snapshot of what the people paid to forecast this economy actually think, compared against what they thought three months ago.
Twenty-One Out of Twenty-Five Answered
This round went to 25 forecasters on 11 August, and 21 responded, an 84 percent response rate. That’s a genuinely broad panel for an economy this size, not a handful of opinions dressed up as consensus.
The Growth Number That Broke the Model
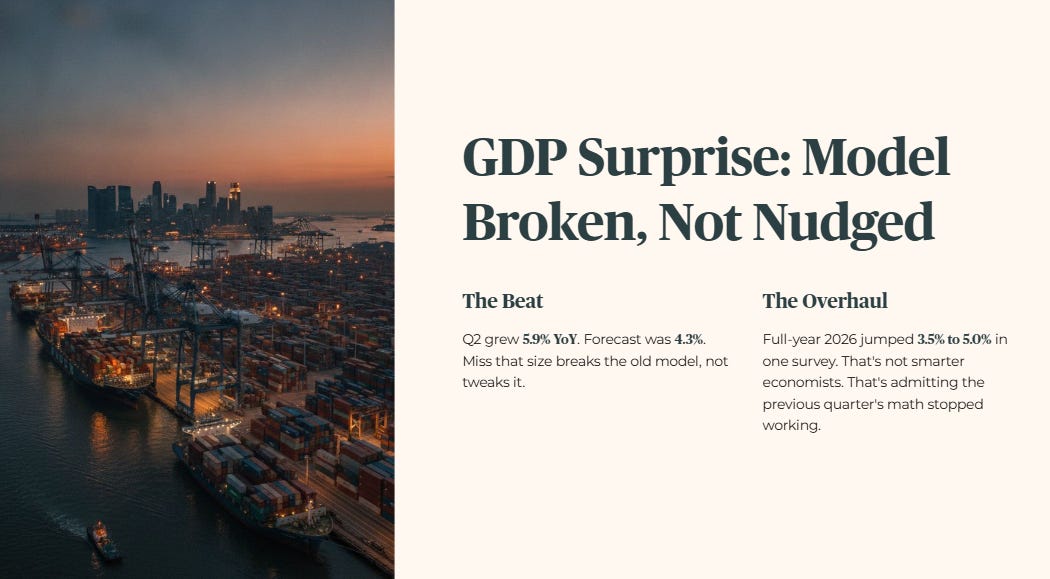
Here’s where the quarter actually starts. Singapore’s economy grew 5.9 percent year on year in the second quarter. The same panel had forecast 4.3 percent three months earlier. A miss that size, in the direction of too much growth, isn’t a rounding error, it’s a sign the previous model of this economy stopped fitting the data partway through the quarter.
The response was a real upgrade, not a token nudge. Full-year 2026 GDP growth forecasts jumped from 3.5 percent to 5.0 percent in a single survey round. Manufacturing went from 5.0 to 8.4 percent. Non-oil domestic exports nearly tripled their forecast, from 6.1 to 17.0 percent. Wholesale and retail trade moved from 4.9 to 7.4 percent.

🟢 Iggy’s Insight
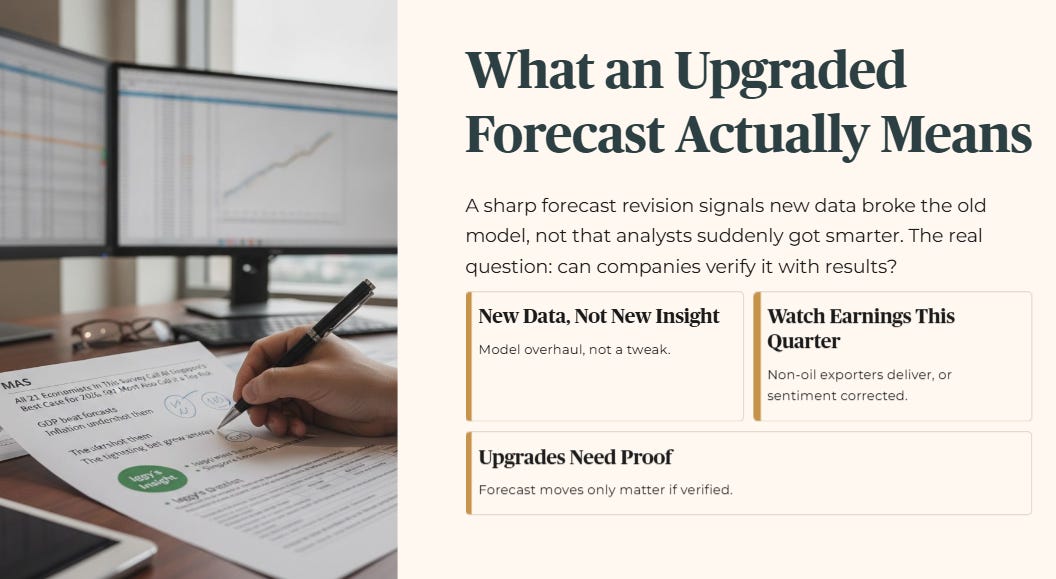
A one-quarter GDP forecast jumping from 3.5 to 5.0 percent isn’t economists getting smarter, it’s economists admitting the previous quarter’s model was wrong and refitting it to new information. That’s not a criticism. A forecast that never needs revising isn’t measuring anything, it’s just restating last quarter’s number with more confidence.
What matters for you isn’t whether the forecast moved, it’s whether the underlying driver, non-oil exports nearly tripling their expected growth rate, is the kind of thing that shows up in company earnings you can actually verify, or the kind of thing that gets revised right back down next quarter. Watch the next earnings season for whether export-exposed names actually deliver numbers in that range. If they don’t, this upgrade was sentiment catching up to a single strong print, not a new trend.
That’s the growth side of the ledger. Here’s where it stops being a clean good-news story.
Inflation Went the Other Way
Inflation actually came in below what the same panel expected three months ago. CPI-All Items hit 1.8 percent in the second quarter against a forecast of 2.1 percent. MAS Core Inflation came in at 1.5 percent, a tenth of a point below expectations. The panel now expects full-year CPI-All Items at 2.1 percent, down from 2.3 percent, and Core Inflation at 1.9 percent, down from 2.0 percent.
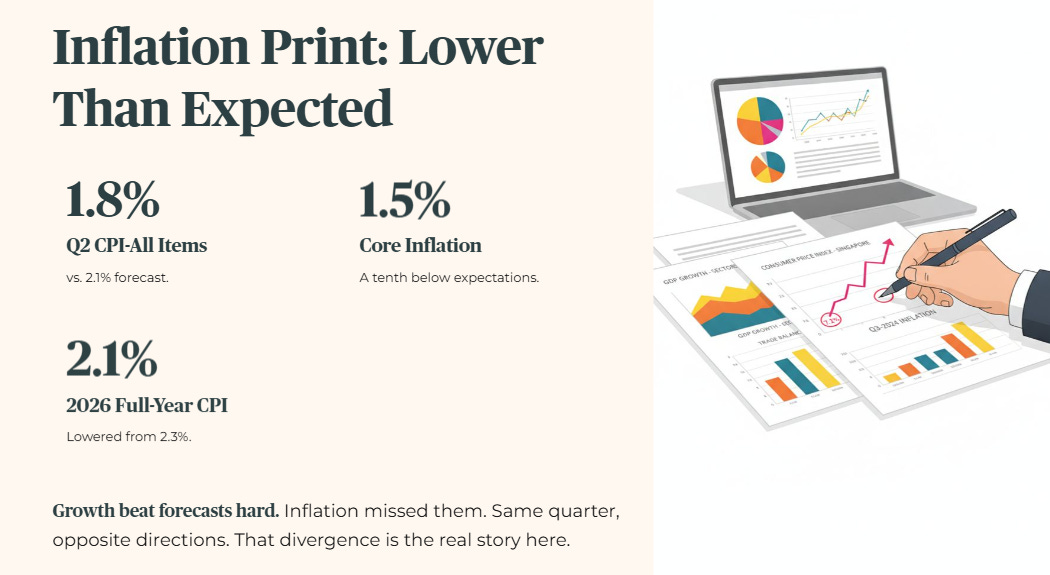
Growth beating forecasts and inflation missing them in the same quarter is not the normal pairing. Usually a growth surprise this size drags inflation forecasts up with it, more demand, more pressure on prices. This quarter did the opposite. I’ll admit that’s the part of this survey that actually surprised me, not the growth number itself.
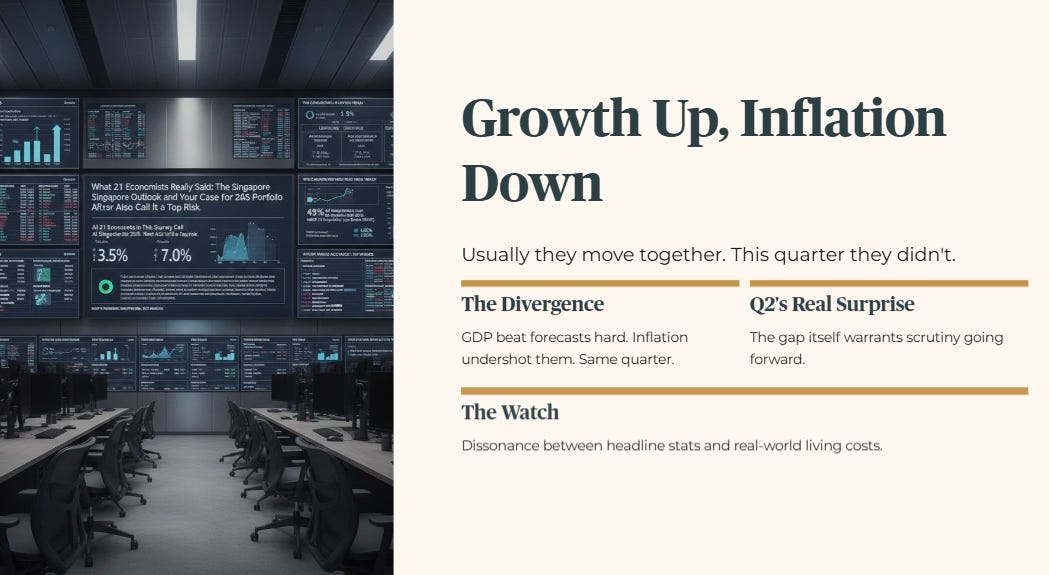
Iggy has strong opinions about kopi-o pricing as a more honest inflation gauge than any government index, and he’d tell you this is exactly the kind of quarter where the two diverge, a headline print can look calm while the actual cost of a cup at your local kopitiam keeps climbing regardless of what the survey says.
What The Same 21 Economists Think MAS Does About It
You might reasonably be asking why a currency policy band that most people have never had to think about should matter to a dividend portfolio. Here’s the answer: the S$NEER slope is the mechanism MAS uses to manage inflation, and the rate path it implies feeds directly into the borrowing costs behind every REIT’s debt book and the deposit rates behind every bank’s margin. It isn’t abstract, it’s just one step removed from the number you actually watch.

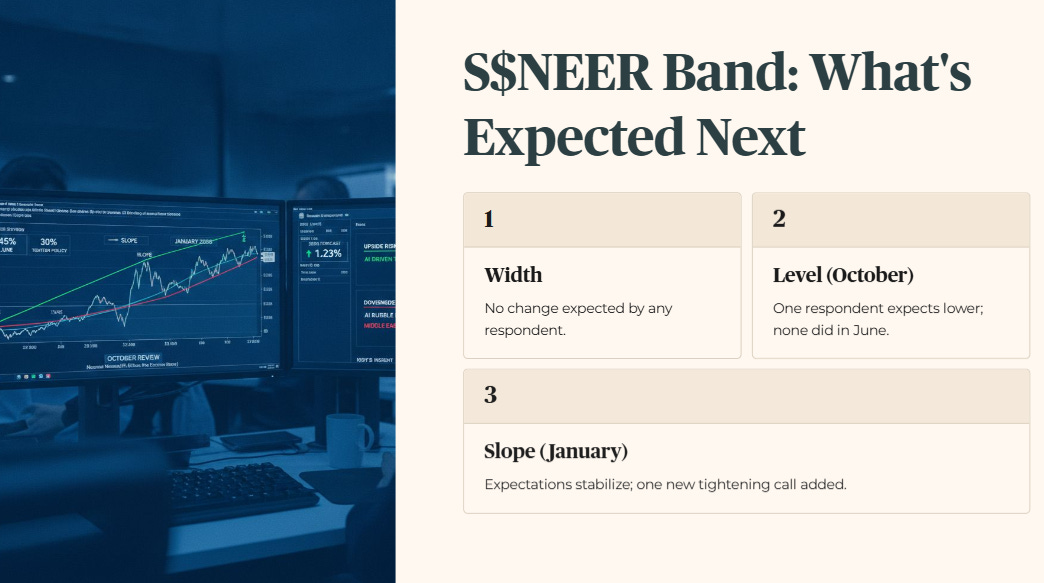
Forty-five percent of respondents now expect MAS to tighten policy at the October review by increasing the slope of the S$NEER band, up sharply from 30 percent in June. That’s a real shift in a single survey round, growth beat forecasts hard enough that nearly half the panel now thinks a tightening response is coming, even with inflation running soft.
Nobody expects a change to the width of the band. A small minority, one respondent, now expects the level at which the band is centred to move lower in October, versus none in June. By January, expectations mostly settle back to unchanged, though one respondent has newly pencilled in a slope increase there too, versus zero in the prior survey.
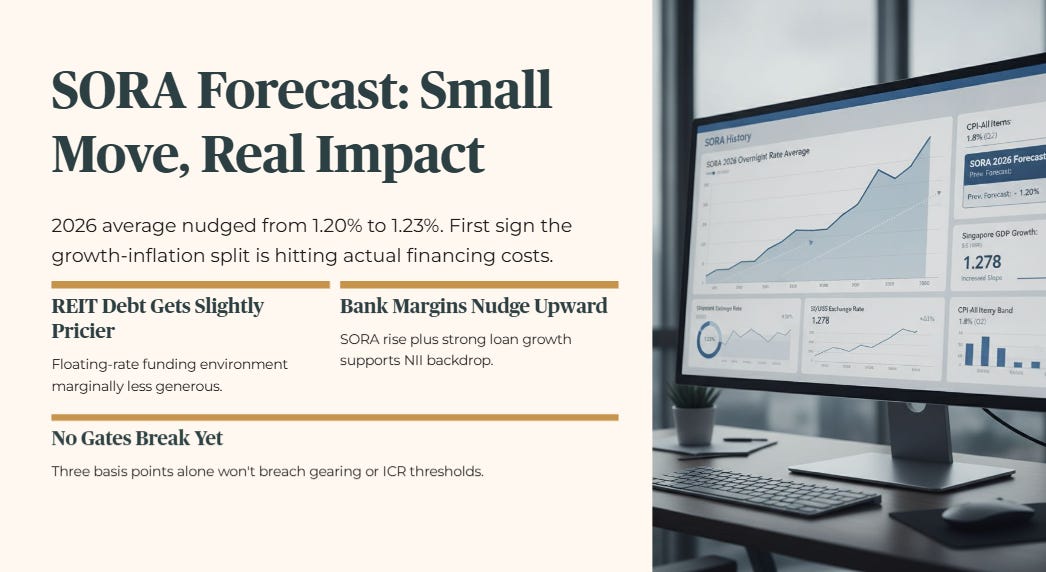
The SORA forecast moved with it, if only slightly. The panel’s average forecast for 2026 SORA ticked up from 1.20 to 1.23 percent. Three basis points doesn’t sound like much. It’s still worth sitting with, because it’s the first piece of this survey where the growth-inflation divergence actually shows up as a number that touches your cost of borrowing directly, and it’s not the last one.
🔒 What’s Next
The SORA forecast above moved just three basis points. The next section shows why that tiny shift matters more for REIT financing costs than the headline GDP number does.
