



All Three Banks Miss My 4.7% Yield Hurdle, and OCBC Is Only 1bp Above My 3.2% Floor 🦖
The banks show 15.9%, 14.6% and 15.5% on the transitional basis and 14.0% fully phased-in. I set out what moved each ratio, what each dividend is set against, and how each tests at the 6 November close.
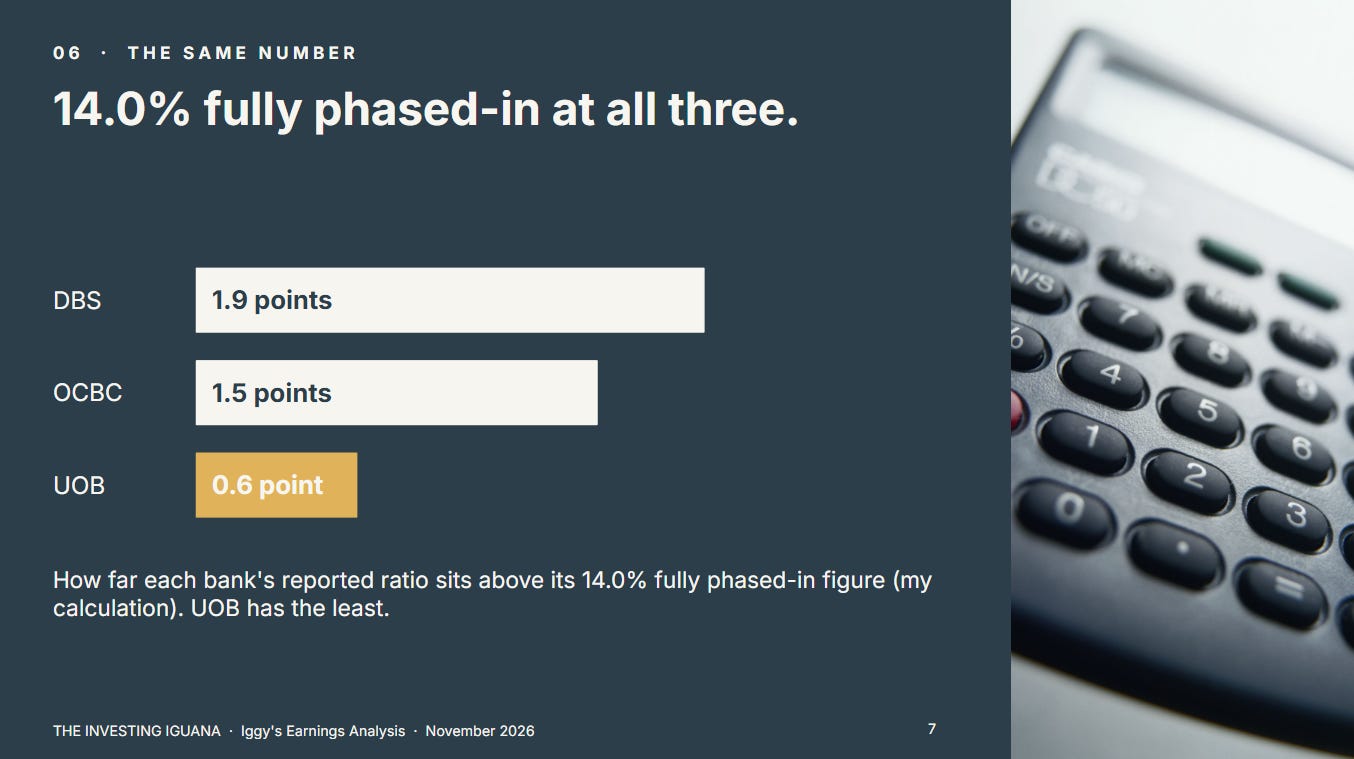
DBS, UOB and OCBC have now each reported the September quarter, and the most alike number across the three is one that none of them leads with. On the fully phased-in basis, DBS reports a Common Equity Tier 1 ratio of 14.0%, UOB 14.0% and OCBC 14.0%. On the transitional basis each bank leads with, the three read 15.9%, 14.6% and 15.5%, and every one of them is lower than it was at the end of June.
If you own one of the three, directly or through a fund or an ETF, the question is how each bank’s capital and dividend sit against my rules at the 6 November close. If you are looking at them for the first time, the three tell you different things about the same weeks, and they need to be read one at a time. I am not telling either of you what to do.
What This Piece Does
It sets out each bank’s quarter in its own figures, and the stated reason for the profit move at each.
It shows what moved each capital ratio between June and September, what the banks say about it and what they do not, and why the gap between the transitional and fully phased-in figures differs across the three.
It shows how each dividend is built, how each bank tests against my yield floor and hurdle at the 6 November close, and where I placed each one.
The first part is free, down to the yields at the 6 November close. The capital test and the room above each line, the dividend by dividend work, the test-by-test table that sets each label and my closing read are in the paid half.
No view on share price direction. Nothing here is a recommendation.

What This Piece Does
The Quarter in One Table
Three Reasons the Profit Moved
Iggy’s Insights
Capital: Three Ratios Down, One Number the Same
Iggy’s Insights
Credit and Margin
Where Each Bank Sits on My Framework
What the Yields Look Like at the 6 November Close
What the Paid Half Adds
The Capital Test
How Each Dividend Is Built
DBS: a quarterly dividend with a capital return inside it
UOB: no dividend this quarter
OCBC: a dividend I carried, not one I read
Where the Tests Land
What I Would Watch Next
Iggy’s Forensic Read
Sources
The Quarter in One Table
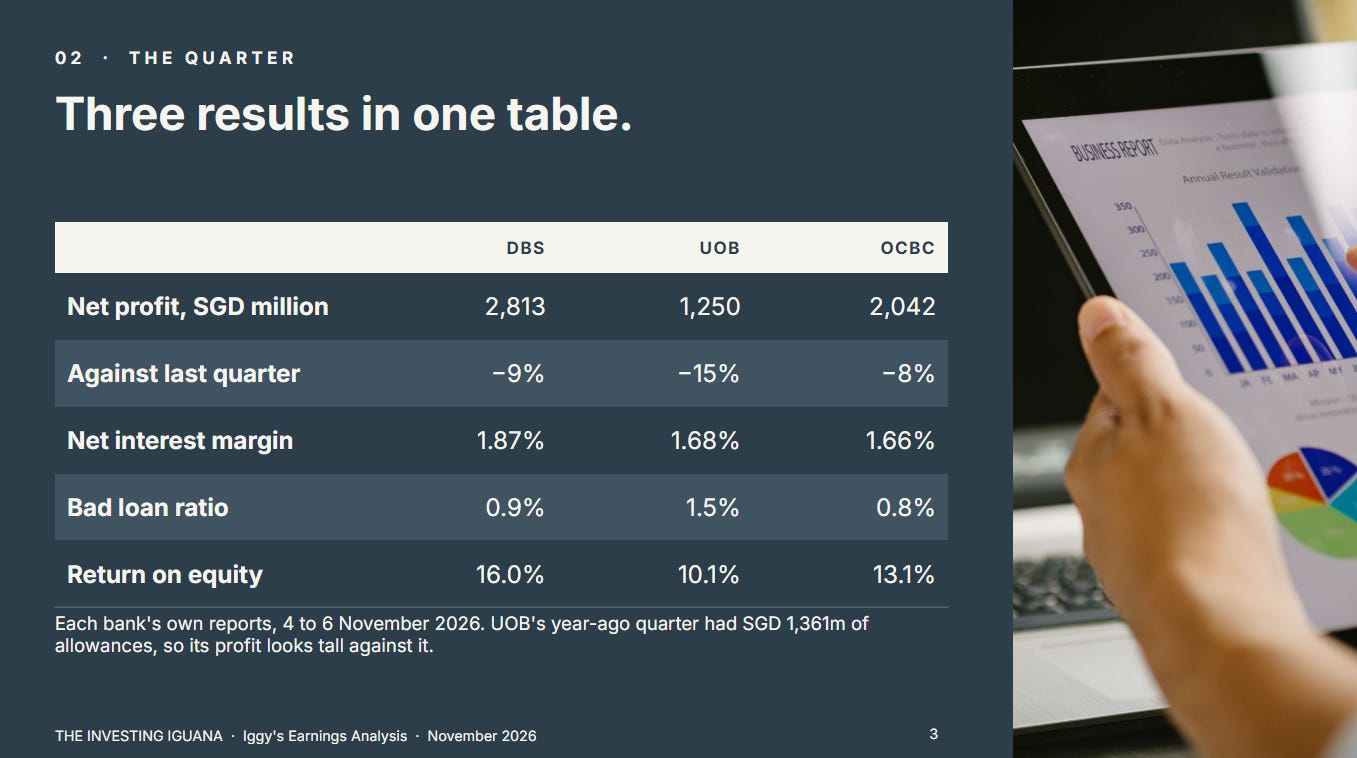
Sources: DBS Trading Update and CFO presentation, 5 November 2026; UOB 3Q26 Performance Highlights and Group Financial Updates, 4 November 2026; OCBC Third Quarter 2026 Results Highlights, 6 November 2026. Return on equity is as each bank reports it for the quarter.
Two cautions on the table. UOB’s third quarter of 2025 included SGD 1,361 million of allowances, so its profit against a year ago looks tall because the base was low. And the three profit figures are not on a like-for-like basis: each bank has its own mix of insurance, trading and one-off lines, which is the next section.
Three Reasons the Profit Moved
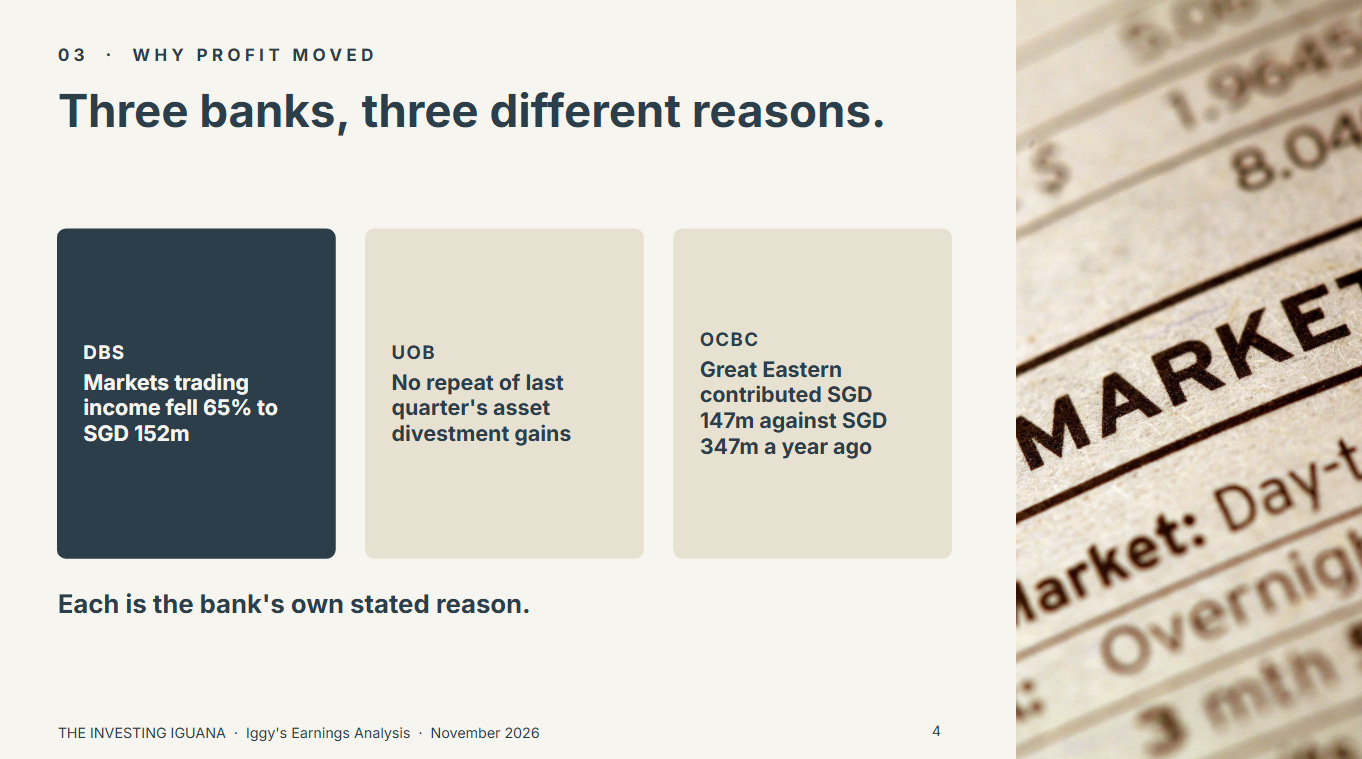
DBS. Net profit of SGD 2,813 million was 5% lower than a year ago, with markets trading income of SGD 152 million, down 65%, the line DBS names. The commercial book earned a record SGD 5,693 million, up 4%. Angela set out those lines in detail on Thursday, and I do not repeat the split here.
UOB. Net profit of SGD 1,250 million was 15% lower than the previous quarter. UOB attributes the fall mainly to the absence of the asset divestment gains booked in the second quarter, and to lower trading and investment income of SGD 322 million. Net fee income was a record SGD 733 million. The comparison with a year ago is the low-base effect noted above.
OCBC. Net profit of SGD 2,042 million was 3% higher than a year ago and 8% lower than the previous quarter. The deck’s own framing is that Banking Operations profit rose to a record SGD 1,895 million, up 16% on a year ago and 8% on the previous quarter (my arithmetic from the deck’s figures), and that the group figure was moderated by weaker investment income at Great Eastern Holdings. Great Eastern’s profit contribution was SGD 147 million against SGD 347 million a year ago, which the deck attributes to mark-to-market losses on its bond portfolio. The headline and the underlying are a long way apart, and OCBC states both.
🦖 Iggy’s Insights
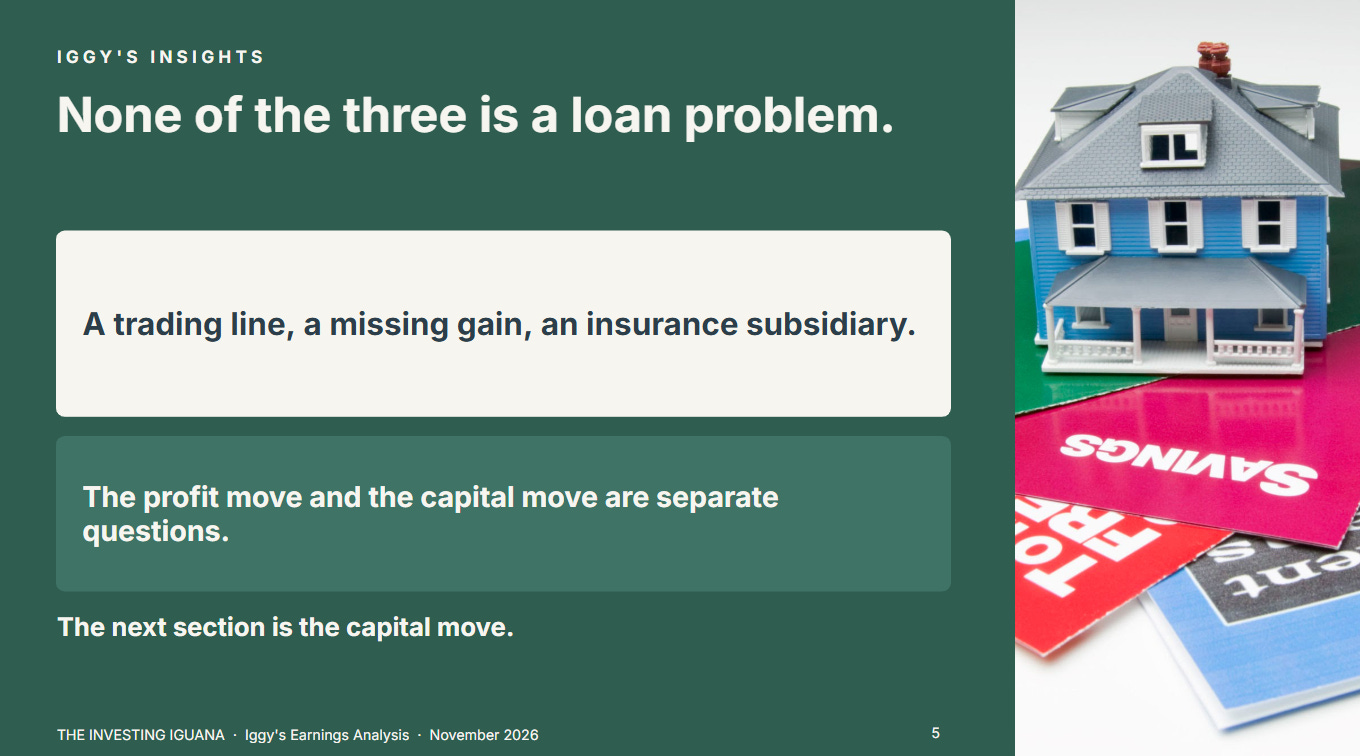
Three banks reported lower profit than the previous quarter, and three different things lowered it: a trading line at DBS, a missing divestment gain at UOB, and an insurance subsidiary’s bond marks at OCBC. None of those is a loan problem, which is the usual way a bank’s dividend comes under pressure. That does not make the dividends safe. It means the profit move and the capital move are separate questions, and the second one is what the next section is about.
Capital: Three Ratios Down, One Number the Same
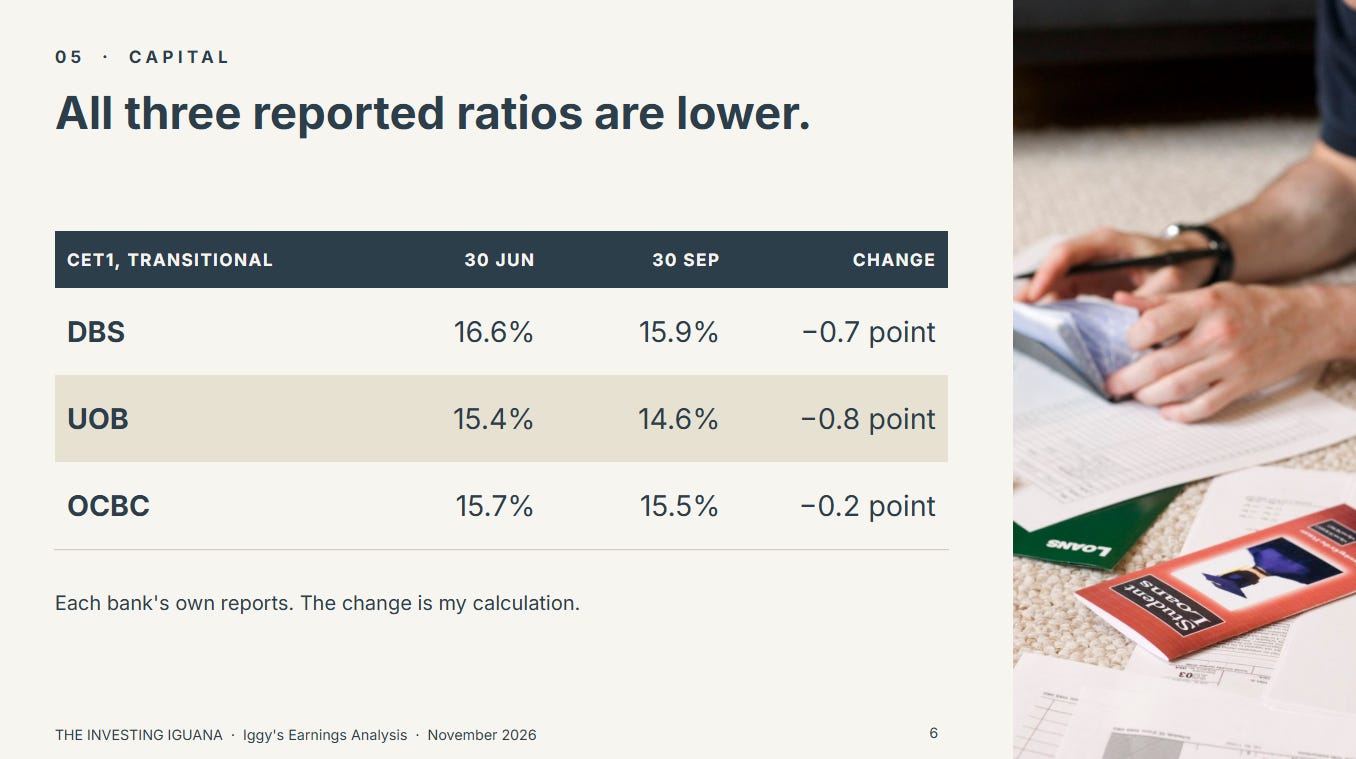
Sources as for the table above. The change column is my arithmetic. OCBC’s fully phased-in ratio a year ago is 1.0 point above the 14.0% in the deck, which I take from the deck’s statement that it is down 1.0 point on the year. UOB’s deck calls its measure “fully loaded”.
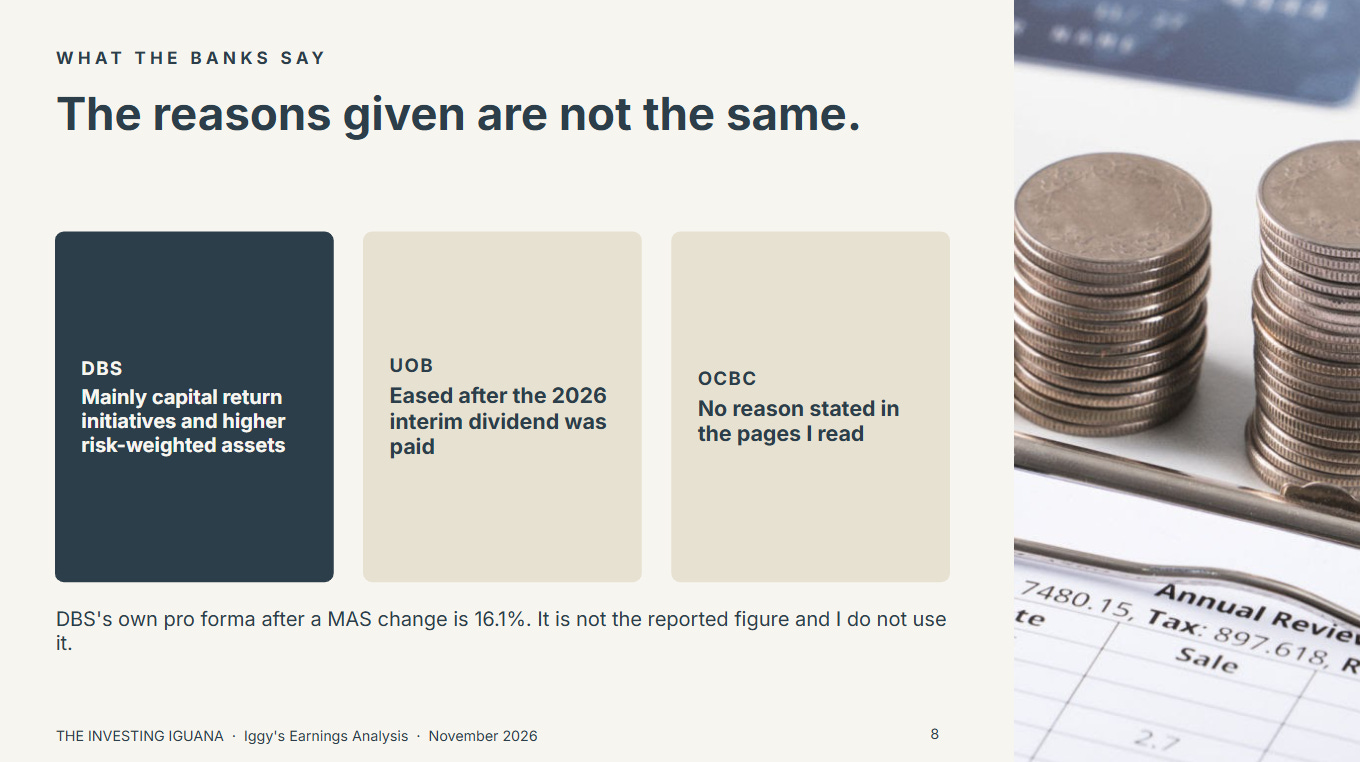
The reasons given are not the same. In its media briefing transcript, DBS attributes the 0.7 point fall mainly to capital return initiatives and a higher level of risk-weighted assets, and says the effect of higher interest rates on the ratio was limited, at 0.1 point. It gives no bridge between the three. Risk-weighted assets rose from SGD 382 billion to SGD 398 billion, which is 4.2% (my arithmetic).
Separately, its documents report an event after the quarter-end: on 4 November the Monetary Authority of Singapore reduced the operational risk multiplier it had imposed after past digital disruptions, from 1.8 times to 1.5 times. DBS says that, adjusting for this, its September ratios would have been 16.1% transitional and 14.1% fully phased-in. Those are DBS’s own pro forma figures, not the reported ones, and I do not use them. UOB says its ratio eased after the 2026 interim dividend was paid, which is a cause that does not involve the quarter’s profit at all. OCBC’s deck shows the 0.2 point move, and I did not find a stated reason for it in the pages I read.
Three things stand out when the table is read across.
First, the fully phased-in figure is 14.0% at all three, and the transitional figure is where they differ. DBS’s reported ratio is 1.9 points above its fully phased-in figure, OCBC’s is 1.5 points above, and UOB’s is 0.6 point above (my arithmetic). The transitional figure is the one my framework treats as authoritative, so I score them on it. The fully phased-in figure is what the ratio becomes once the transitional allowances are gone, and I have not read the schedule for that, so I make no claim about when.
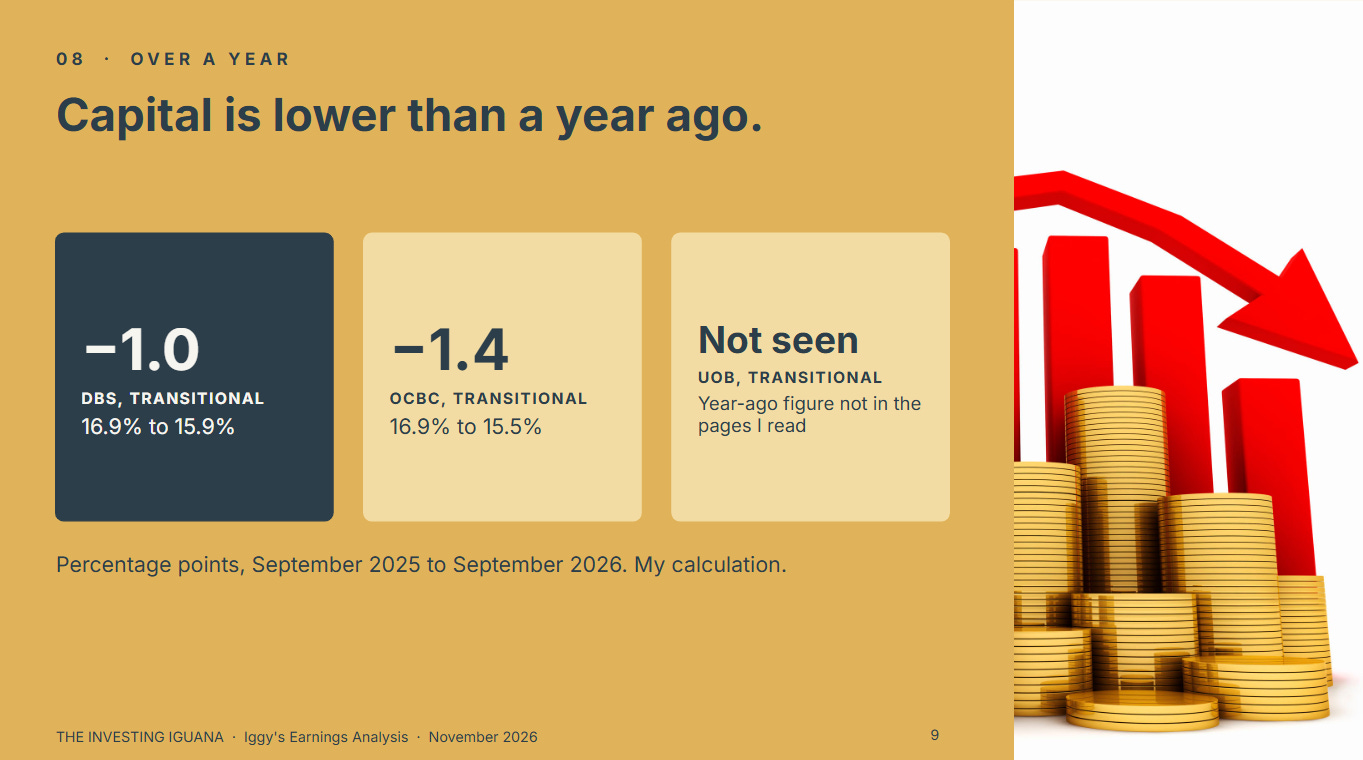
Second, over a year, DBS’s transitional ratio fell by 1.0 point and OCBC’s by 1.4 points, from 16.9% at each. OCBC’s fully phased-in ratio fell by 1.0 point over the same year. I do not have a year-ago figure for UOB in the pages I read.
Third, the bank whose ratio is closest to a line is UOB. At 14.6% it is 0.6 point above 14%, the level below which my framework moves a bank’s capital into its fourth band, and it moved the most on the quarter. The cause UOB gives is the interim dividend payment, which is a known cost of a dividend and not an unexpected loss. It is still the ratio with the least room.
🦖 Iggy’s Insights
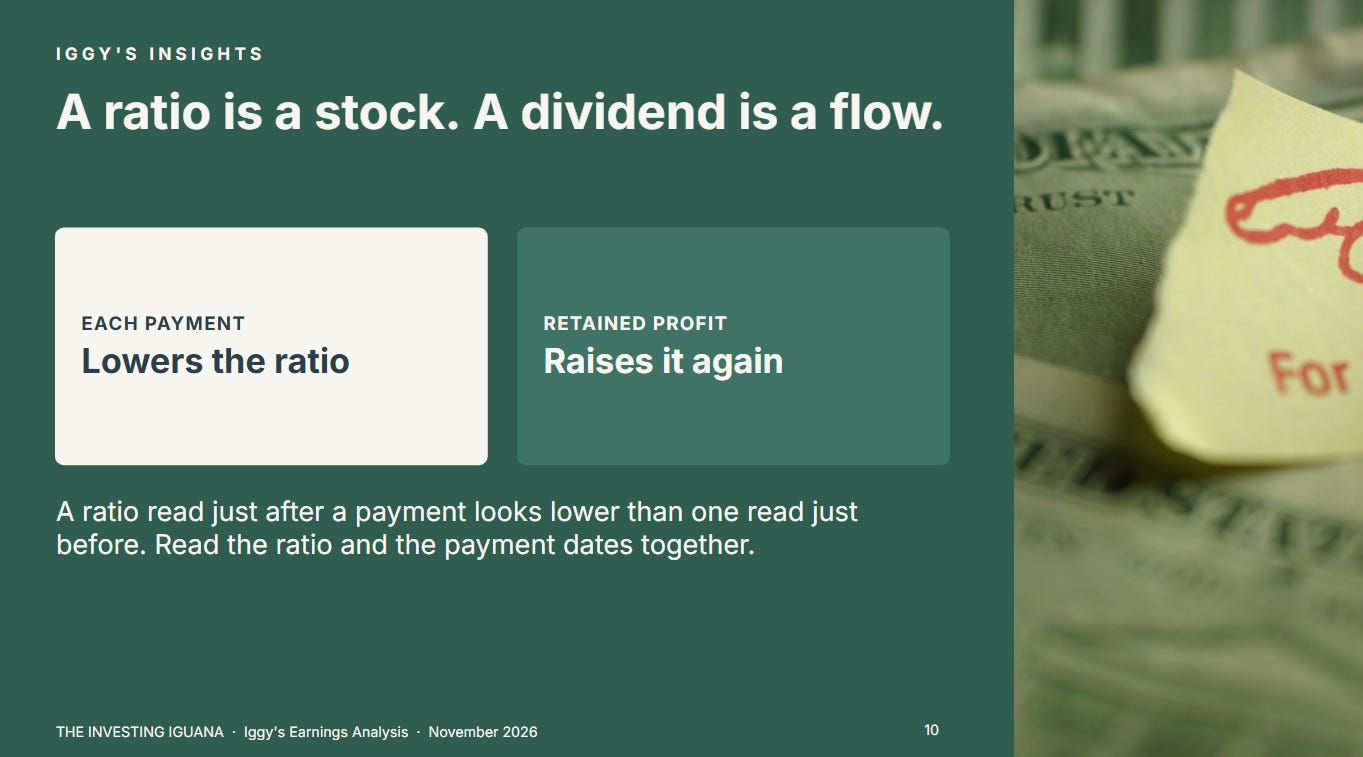
A capital ratio is a stock, and a dividend is a flow out of it. Each payment lowers the ratio, and retained profit raises it. UOB and DBS both name payouts among their reasons: the interim payment for UOB’s 0.8 point fall, and capital return initiatives alongside higher risk-weighted assets for DBS’s 0.7 point. That is not a fault. It means a ratio read just after a payment looks lower than one read just before it, so the ratio and the payment dates are worth reading together.
Credit and Margin
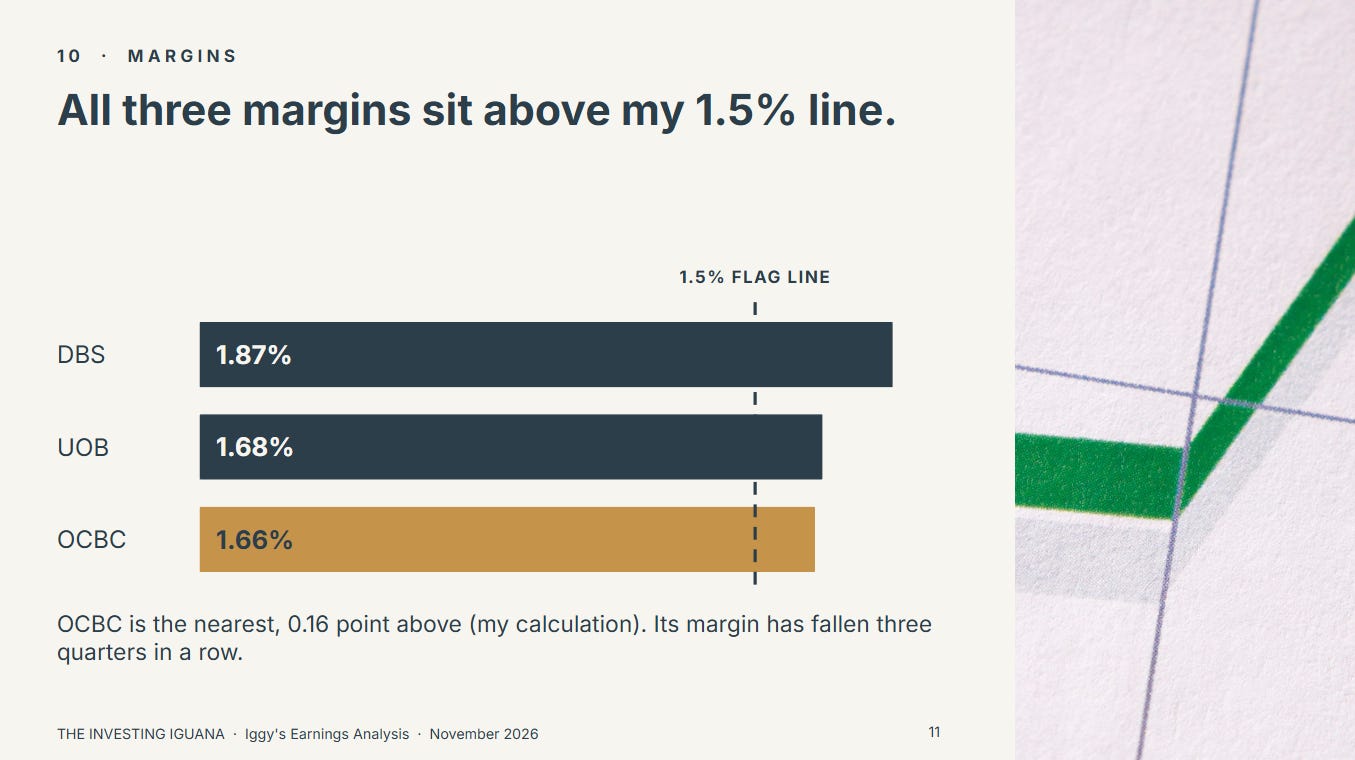
All three net interest margins fell again. DBS held at 1.87%, unchanged on the second quarter and 9 basis points below a year ago. UOB fell to 1.68% from 1.74% and OCBC to 1.66% from 1.70%, which for OCBC is the third quarterly decline in a row (1.86% in 4Q25, 1.76%, 1.70%, then 1.66%). My margin soft flag is a margin below 1.5%. The margins are 0.37, 0.18 and 0.16 point above it (my arithmetic), so the nearest to the line is OCBC, and no flag applies to any of the three. UOB’s bridge shows funding cost taking 7 basis points off its margin and OCBC’s shows funding costs taking 11 basis points off, so for both the pressure shows on the liability side. I do not draw a conclusion about next quarter, and OCBC’s deck says it expects benefits as assets reprice.
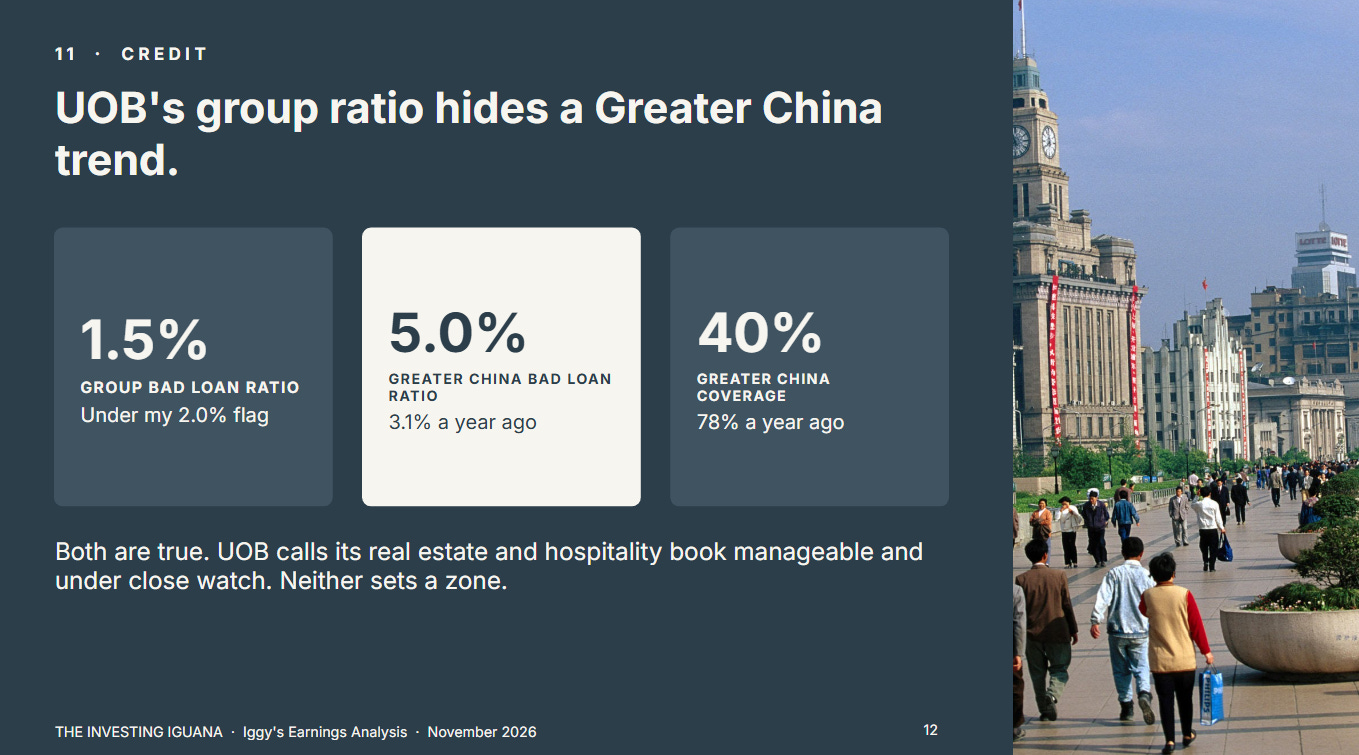
On non-performing loans the three look alike on the group ratio: 0.9% at DBS, 1.5% at UOB and 0.8% at OCBC, all under my 2.0% flag. The group ratio is not the whole of UOB’s credit picture. UOB’s Greater China non-performing loan ratio was 5.0% at 30 September, against 3.1% a year earlier and 4.8% at 30 June, and its Greater China coverage was 40%, against 78% a year earlier. Group coverage was 86%, down from 100% at September 2025. UOB’s own slide describes its Greater China real estate and hospitality book as manageable and under close watch, and says that book is SGD 20 billion of SGD 49 billion of Greater China loans, with non-performing loans of 0.5% of group loans. Both the stable group ratio and the worse Greater China trend are true, and neither sets a zone under my rules. I mention the trend because a reader who sees only 1.5% has not seen it.
DBS’s allowances for credit and other losses rose 41% on a year ago to SGD 175 million, and 29 of the SGD 51 million rise came from a smaller write-back of general allowances (the Angela piece has the split). OCBC’s allowances were SGD 52 million, down 63% on a year ago, with credit costs of 6 basis points and coverage of 168%. These are one quarter each, and I treat them as that.
Where Each Bank Sits on My Framework
Iggy’s Forensic Zone, as at the 6 November 2026 close:
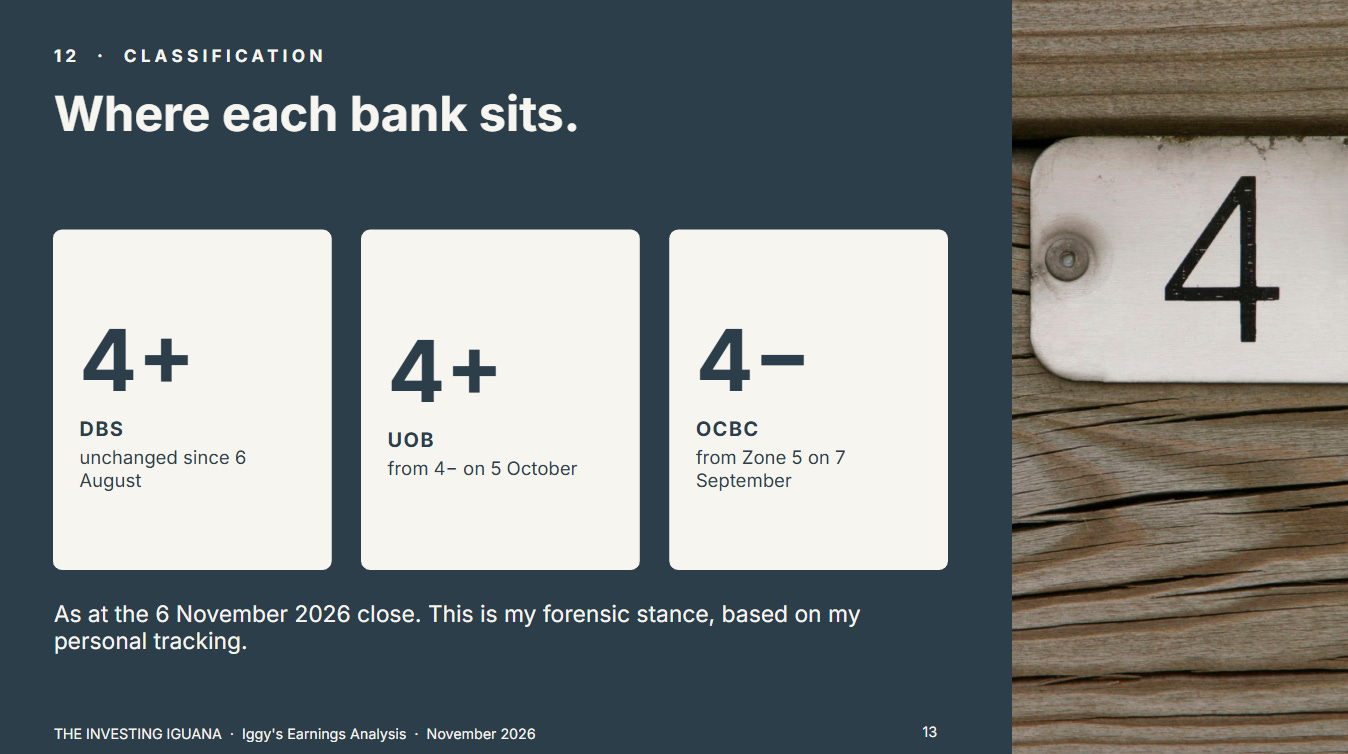
DBS: Zone 4+, Caution (Growth Read: a bank whose commercial book is at a record while the trading line shrinks, with the dividend set quarter by quarter and part of it a capital return)
UOB: Zone 4+, Caution (Growth Read: a profit headline that looks tall against a low base, with the lowest capital headroom of the three, and a Greater China credit trend that is worse than the group ratio shows)
OCBC: Zone 4-, Caution (Growth Read: a record in Banking Operations beside a weaker insurance contribution, with a yield that clears my floor by about one basis point)
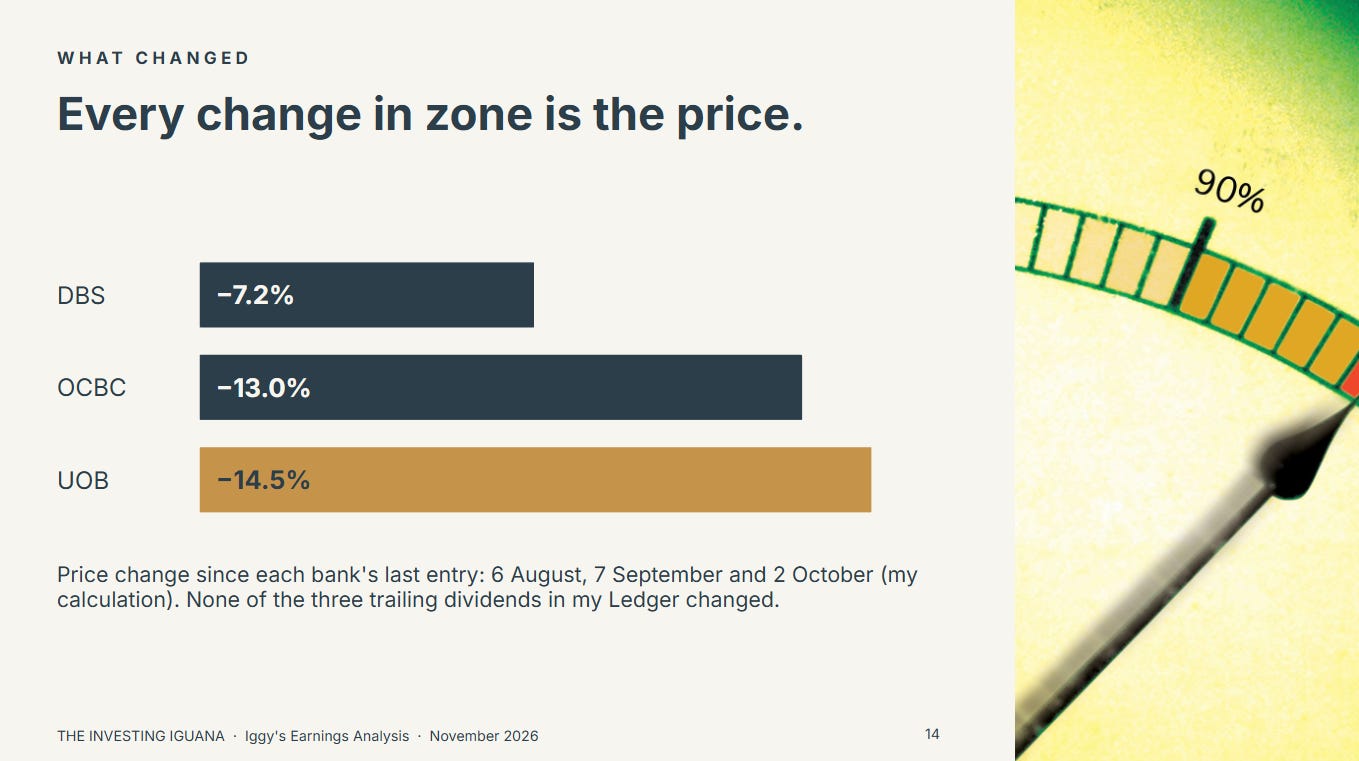
These reflect the three results, the prices at the 6 November close and the Ledger entries I updated for this piece, and they will be recalculated against the price on the day I next cite them. DBS was Zone 4+ in my entry of 6 August and is unchanged. UOB was Zone 4- in my entry of 5 October and moves to 4+. OCBC was Zone 5 in my entry of 7 September and moves to Zone 4-. Every one of those changes is the price: DBS has fallen 7.2% since 6 August, UOB 14.5% since 2 October and OCBC 13.0% since 7 September (my arithmetic). None of the three dividends in my Ledger changed.
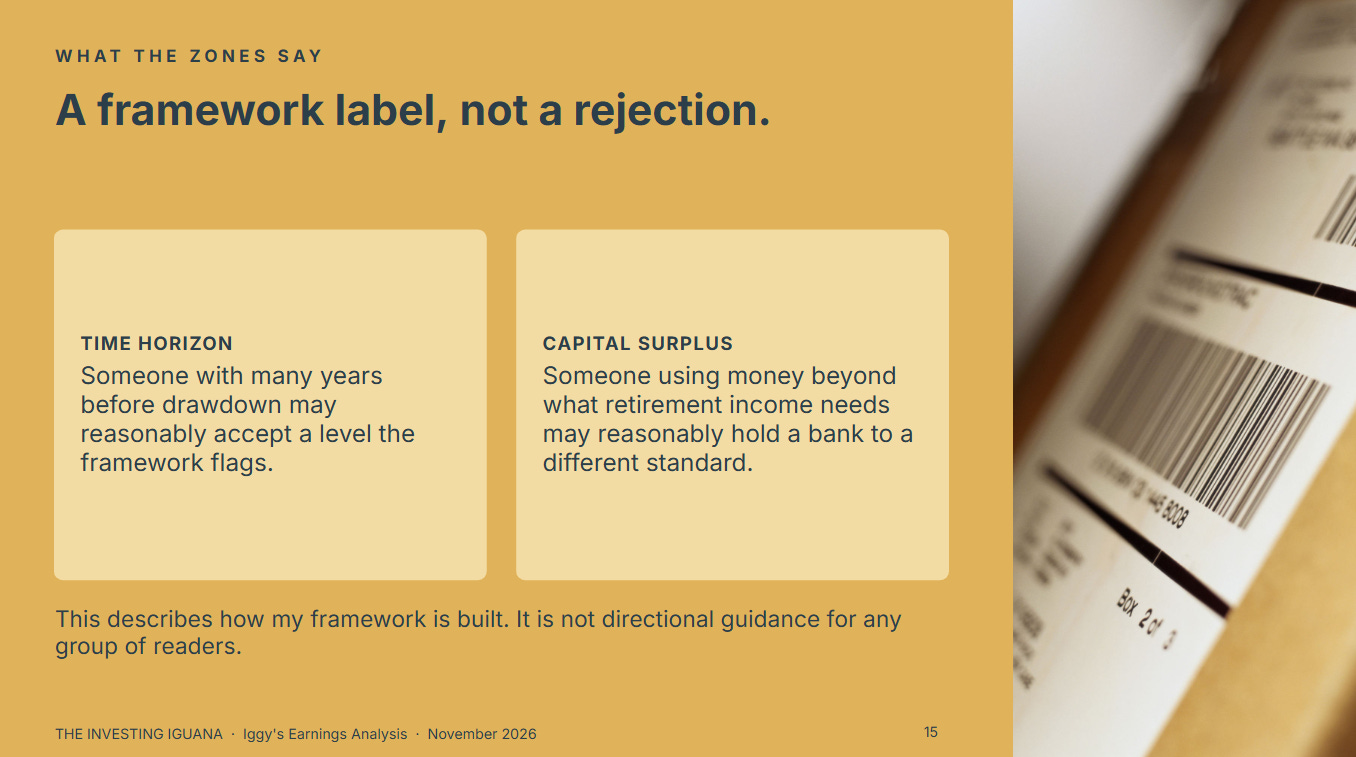
The zones are how my framework is calibrated and are not an instruction to anyone. The framework is built around a reader drawing income in retirement, so it applies fixed tests to every company. The paid section shows which tests set each label and by how much.
What the Yields Look Like at the 6 November Close
My yield basis is the dividends actually paid over the trailing window, with specials never added. The prices are the 6 November closes: DBS SGD 69.72, UOB SGD 36.88 and OCBC SGD 27.73. The Singapore market is closed on Monday 9 November for Deepavali, so these are the latest closes when this is published.
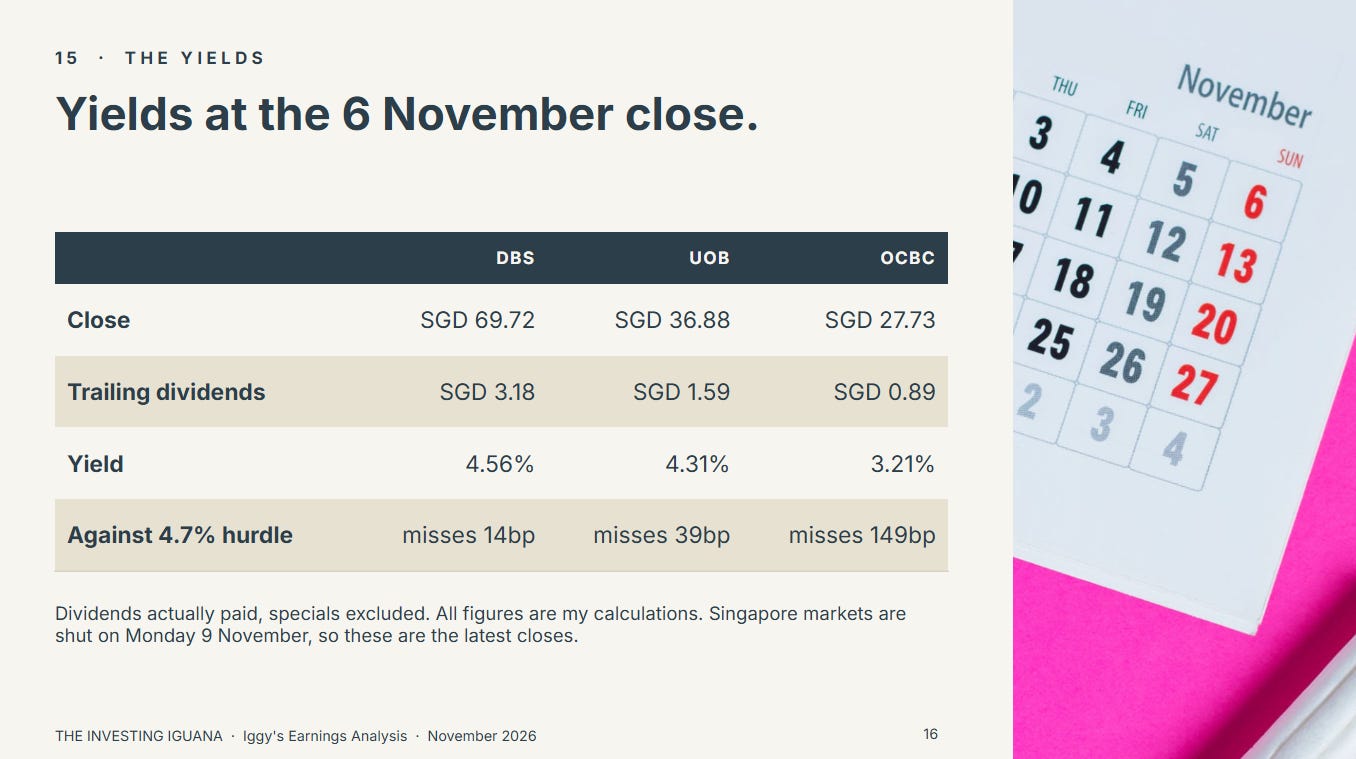
All yields, differences and prices are my arithmetic from the stated inputs. The trailing dividends are the four quarters paid for DBS (75 cents for 3Q25, then 81 cents for each of 4Q25, 1Q26 and 2Q26), the final 71 cents for 2025 plus the interim 88 cents for the first half of 2026 for UOB, and the final 42 cents for 2025 plus the interim 47 cents for 2026 for OCBC. OCBC’s 16 cent special for 2025 is excluded under my standing rule on one-off specials.
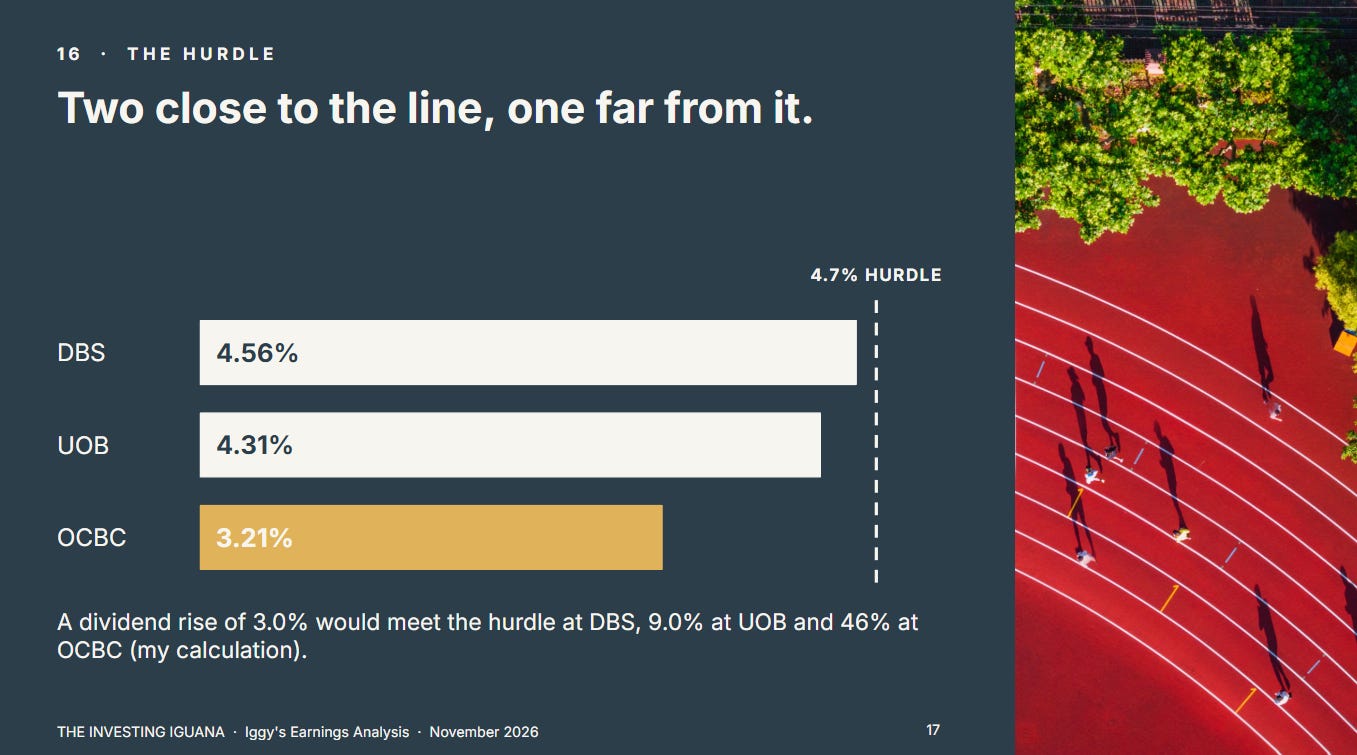
Three points on the table.
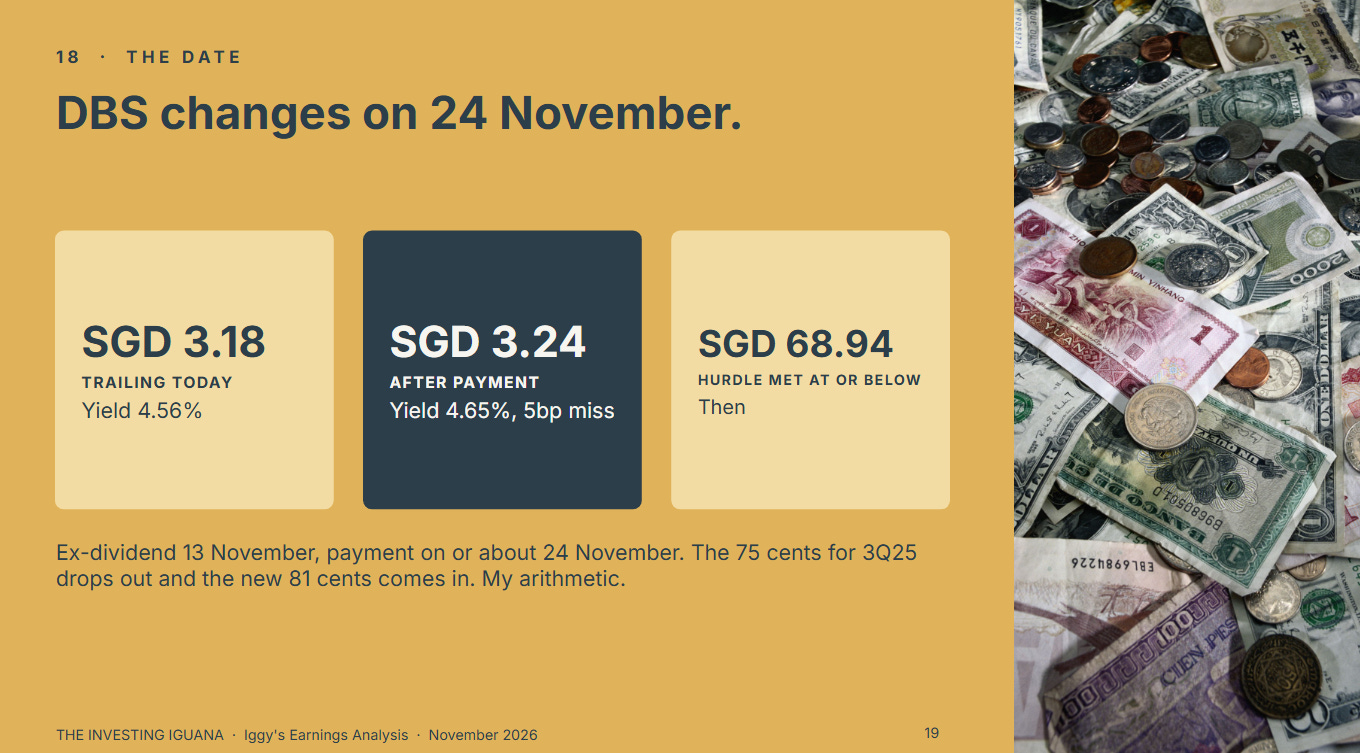
DBS declared 81 cents for the third quarter on 5 November, with an ex-dividend date of Friday 13 November and payment on or about Tuesday 24 November. I count dividends when they are paid. Until 24 November the trailing figure is SGD 3.18. After it, the 3Q25 payment of 75 cents drops out and the new 81 cents comes in, which makes SGD 3.24, and at the same price a yield of 4.65%, a miss of 5 basis points, with the hurdle met at about SGD 68.94. That is a date in the table, not a forecast, and it moves the number by 6 cents.
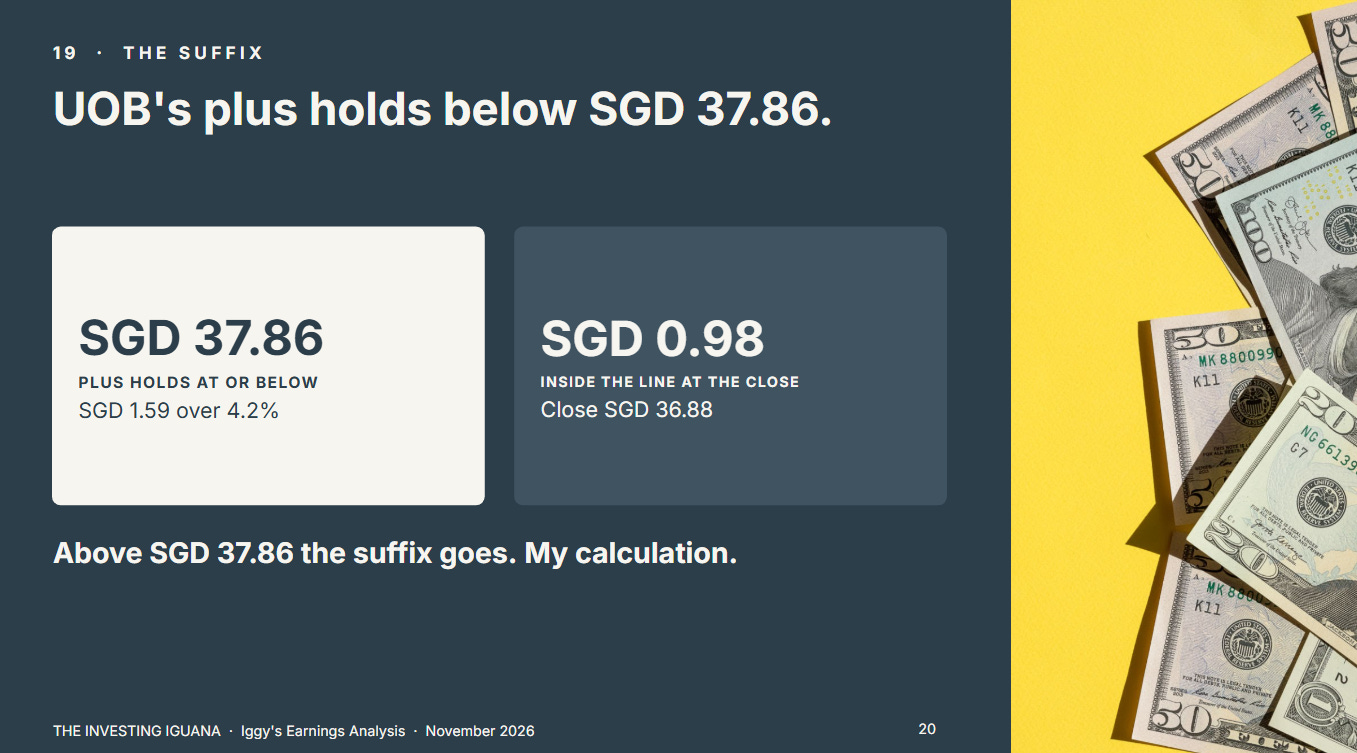
UOB’s yield stays above its suffix line. The “+” on a miss of 50 basis points or less holds at or below about SGD 37.86 (1.59 divided by 0.042), and the close is SGD 0.98 inside it. Above that price the suffix goes.
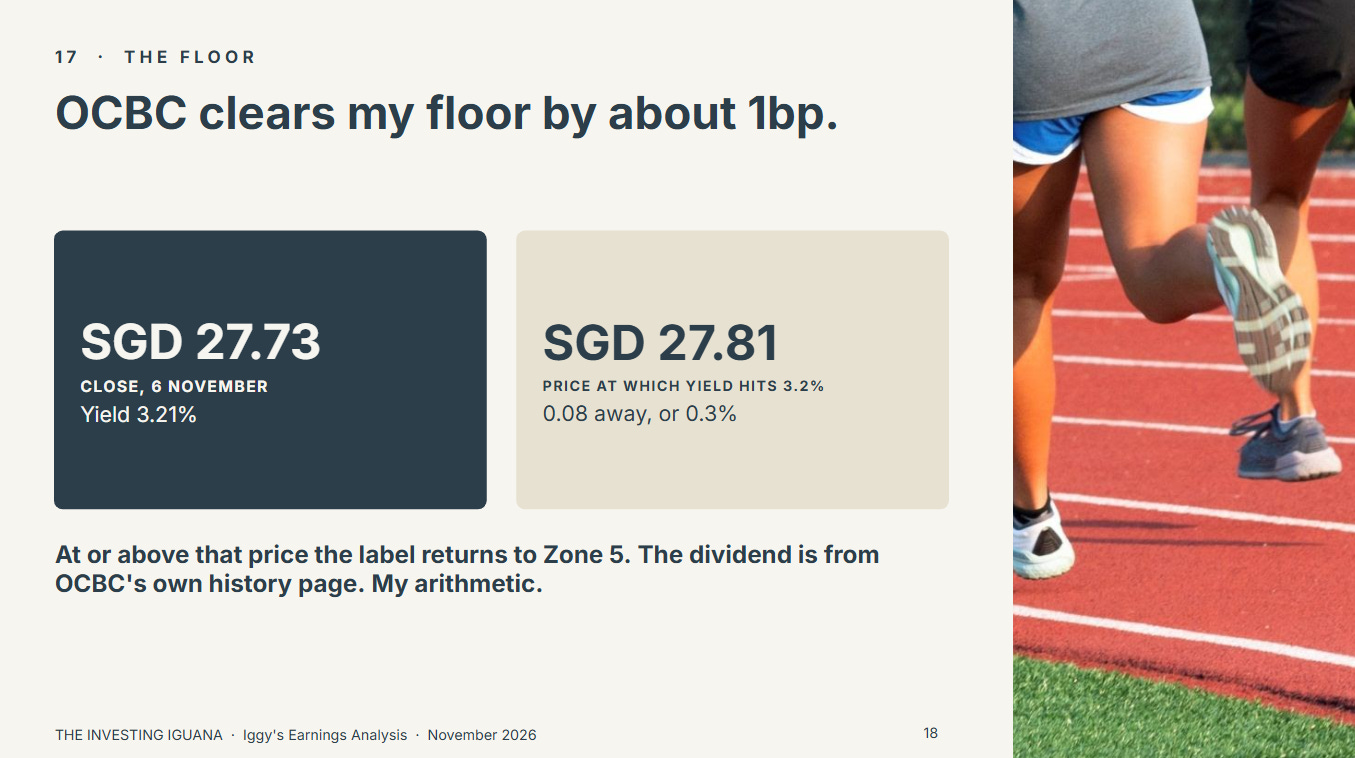
OCBC’s margin is the thinnest of anything in this piece. The yield equals my 3.2% floor at about SGD 27.81, and the close is SGD 0.08 below it, 0.3% (my arithmetic). One day of trading could put the yield at or below the floor and the label back at Zone 5. I show the number and not a view of where the price goes. The OCBC deck contains no dividend, and I did not read OCBC’s SGX announcement, so the SGD 0.89 is carried from my 7 September entry and needs that announcement to confirm it.
The last row of the table is the size of the gap in dividend terms. A rise of 3.0% in DBS’s trailing dividend would meet the hurdle at today’s price, and a rise of 46% would at OCBC. I take no view on whether either is likely.
What the Paid Half Adds
The free half has set out the quarter in each bank’s own figures, what moved each capital ratio, the credit and margin lines, my zone for each, and how each yield tests at the 6 November close. What it has not shown is how much room each capital ratio has above my lines, and what each dividend is set against.
The paid half sets out the capital test, how DBS’s quarterly dividend is built, including the 15 cent capital return dividend that is 19% of what DBS paid over the last four quarters, why the payout looks different on profit and on the ordinary dividend, what UOB’s lack of a third-quarter dividend means for the trailing figure, why OCBC’s dividend is a figure I carried and not one I read, each test against its threshold in one table, and what I will watch next. Paid members get the full written analysis for its depth, not for any earlier access.
The Substack Only Plan, US$8 a month, gives you the full written analysis, the portfolio walkthroughs and the analyst cheatsheets.
The YouTube Only Plan, S$5 a month, gives you the full-length Members Edition video.
The YouTube/Substack Combo, S$12 a month, gives you all of it.
🔒 What’s Next
One bank clears my yield floor by about a basis point, and another has a capital ratio only 0.6 point above my line. The paid half shows the room on each test.
