

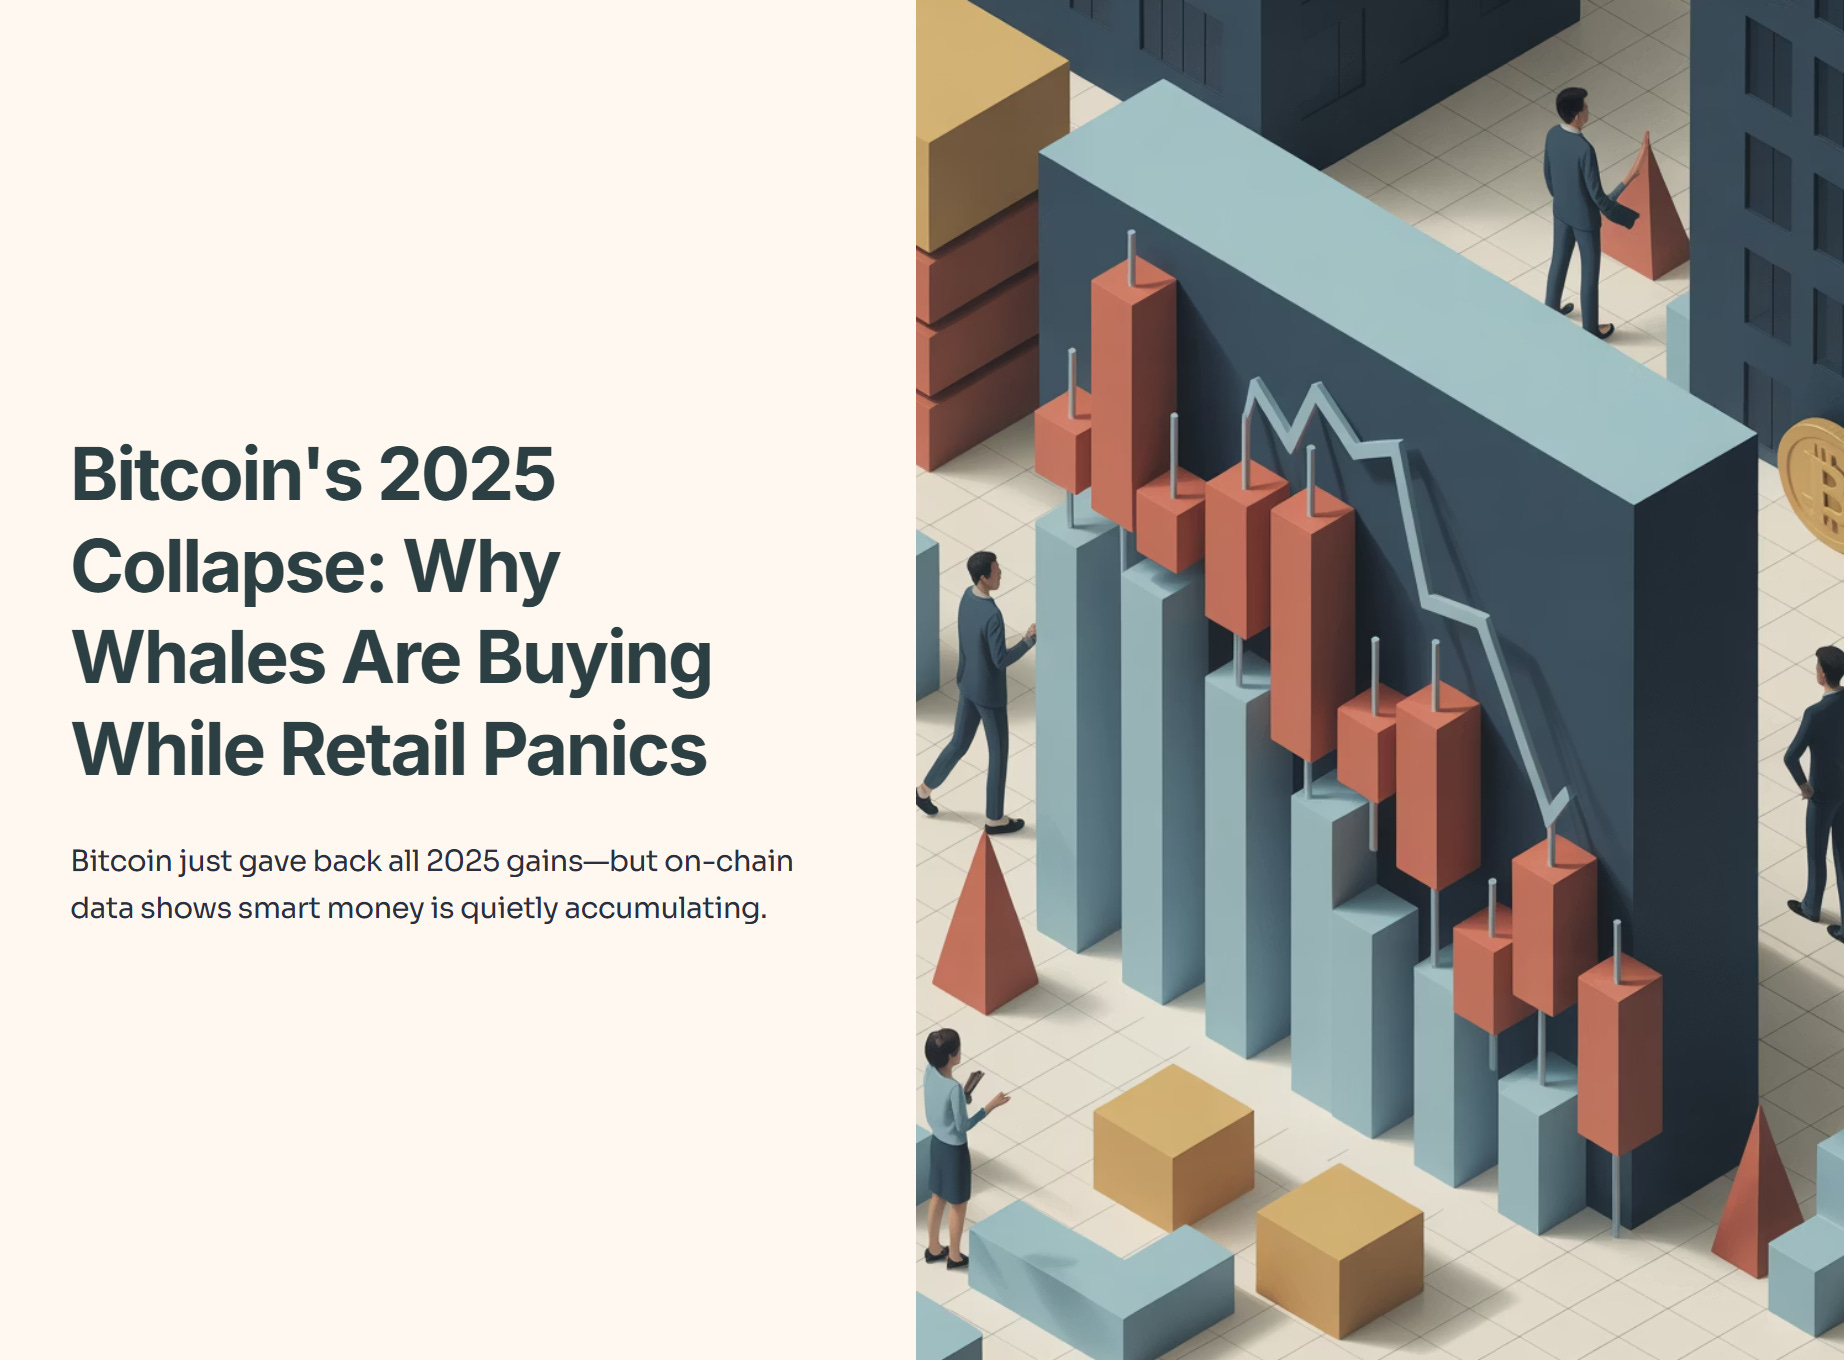
BTC $92k: Why I’m NOT Selling (My Strategy for Singaporeans) 🦖 EP1283
Bitcoin just gave back all 2025 gains—but on-chain data shows smart money is quietly accumulating. Here’s what that means for your portfolio.

If you opened your portfolio this morning, you likely saw red. A lot of it.
Bitcoin has officially surrendered every single dollar of gain it made in 2025. As of today, Thursday, November 20, 2025, we are trading at US$92,508, down 2.4% from where we started the year. The euphoria of the October “Trump Pump” to US$126k is gone, replaced by a cold, hard bear market.
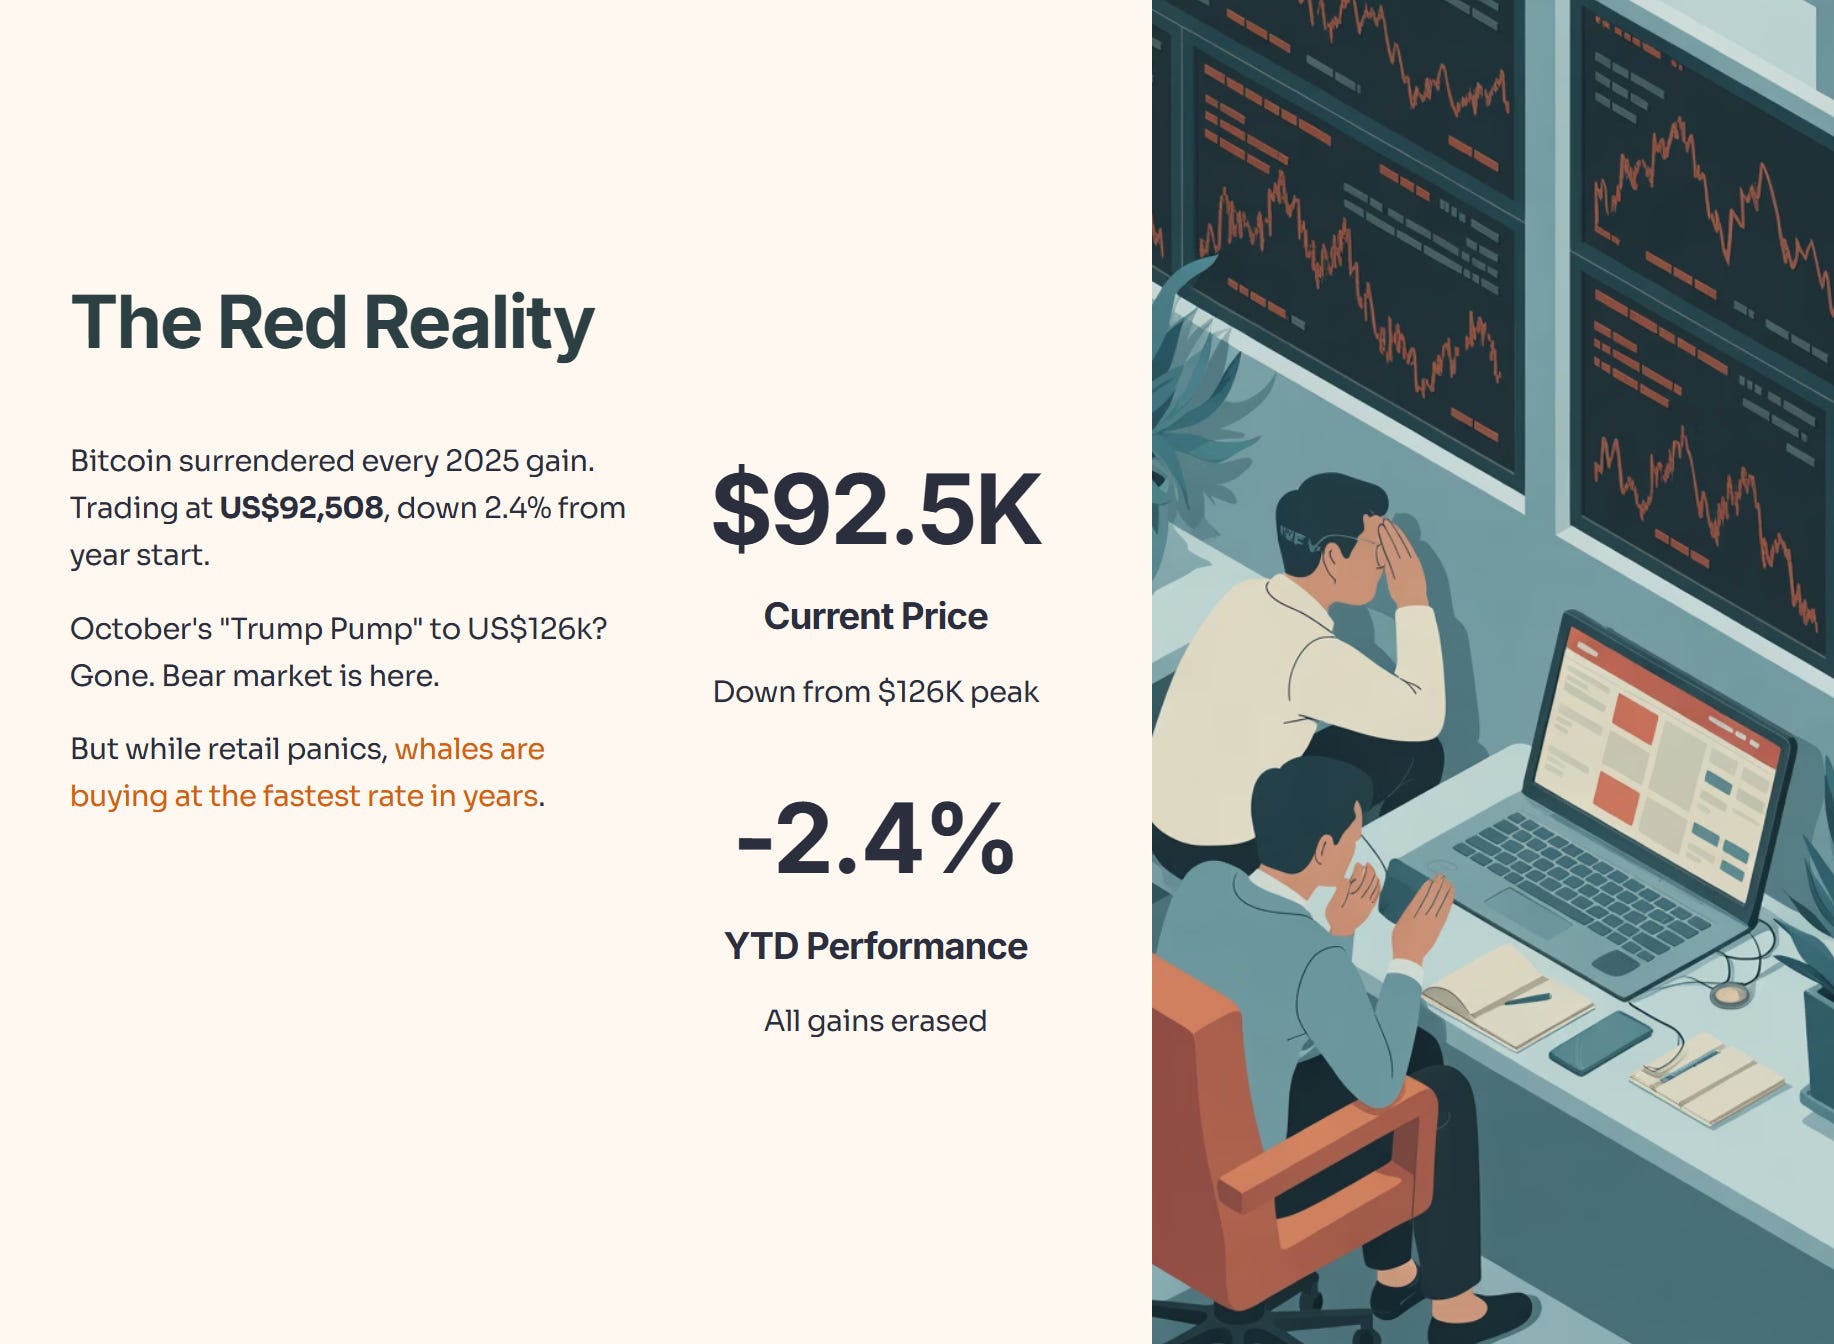
Retail investors are asking if crypto is dead (again). But while the average investor is panic-selling, on-chain data reveals a massive divergence: Whales are buying at the fastest rate we’ve seen in years.
Here is why the “Smart Money” is betting on a rebound, and why the macro environment—not the asset itself—is the real culprit.
In This Article:

• The Data: It’s a Liquidity Story, Not a Crypto Story
• The Divergence: Whales vs. Retail
• The Historical Mirror: We Have Seen This Movie Before
• The Singapore Context: The “Strong Dollar” Cushion
• Iggy’s Strategy for Locals
• Iggy’s Insights: The Alpha
• The Bottom Line & Next Steps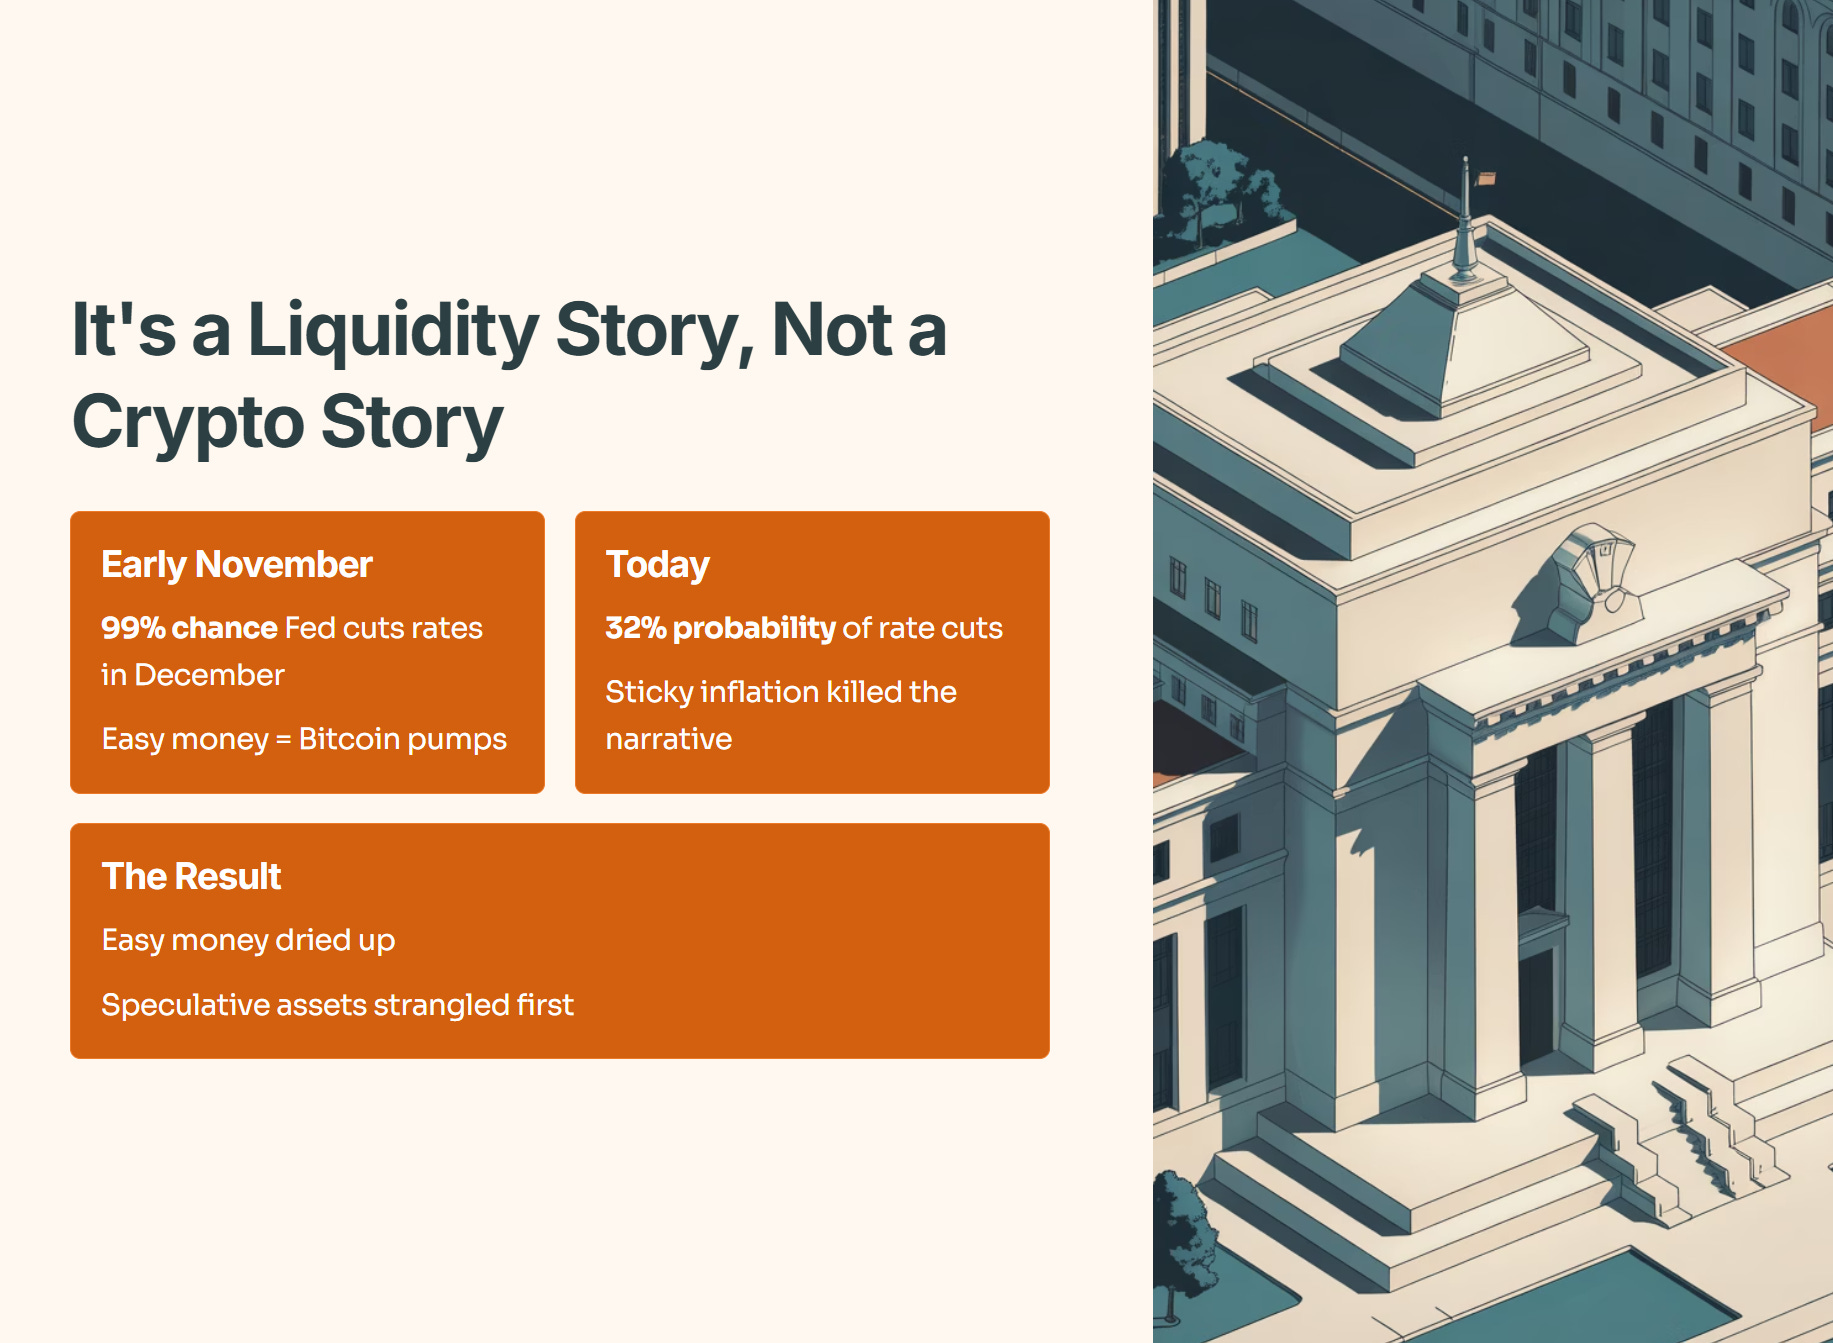
The Data: It’s a Liquidity Story, Not a Crypto Story
Why the sudden crash? It’s simple: The “easy money” narrative just died.
In early November, the market believed there was a 99% chance the US Federal Reserve would cut interest rates in December. Cheaper interest rates usually mean more money flows into risky assets like Bitcoin.
Today? That probability has collapsed to 32%. Sticky inflation and backlog data from the government shutdown have forced the Fed to keep rates high. When “easy money” dries up, speculative assets like Bitcoin are the first to get strangled.
Bitcoin Price Performance: Oct 2025 - Nov 2025
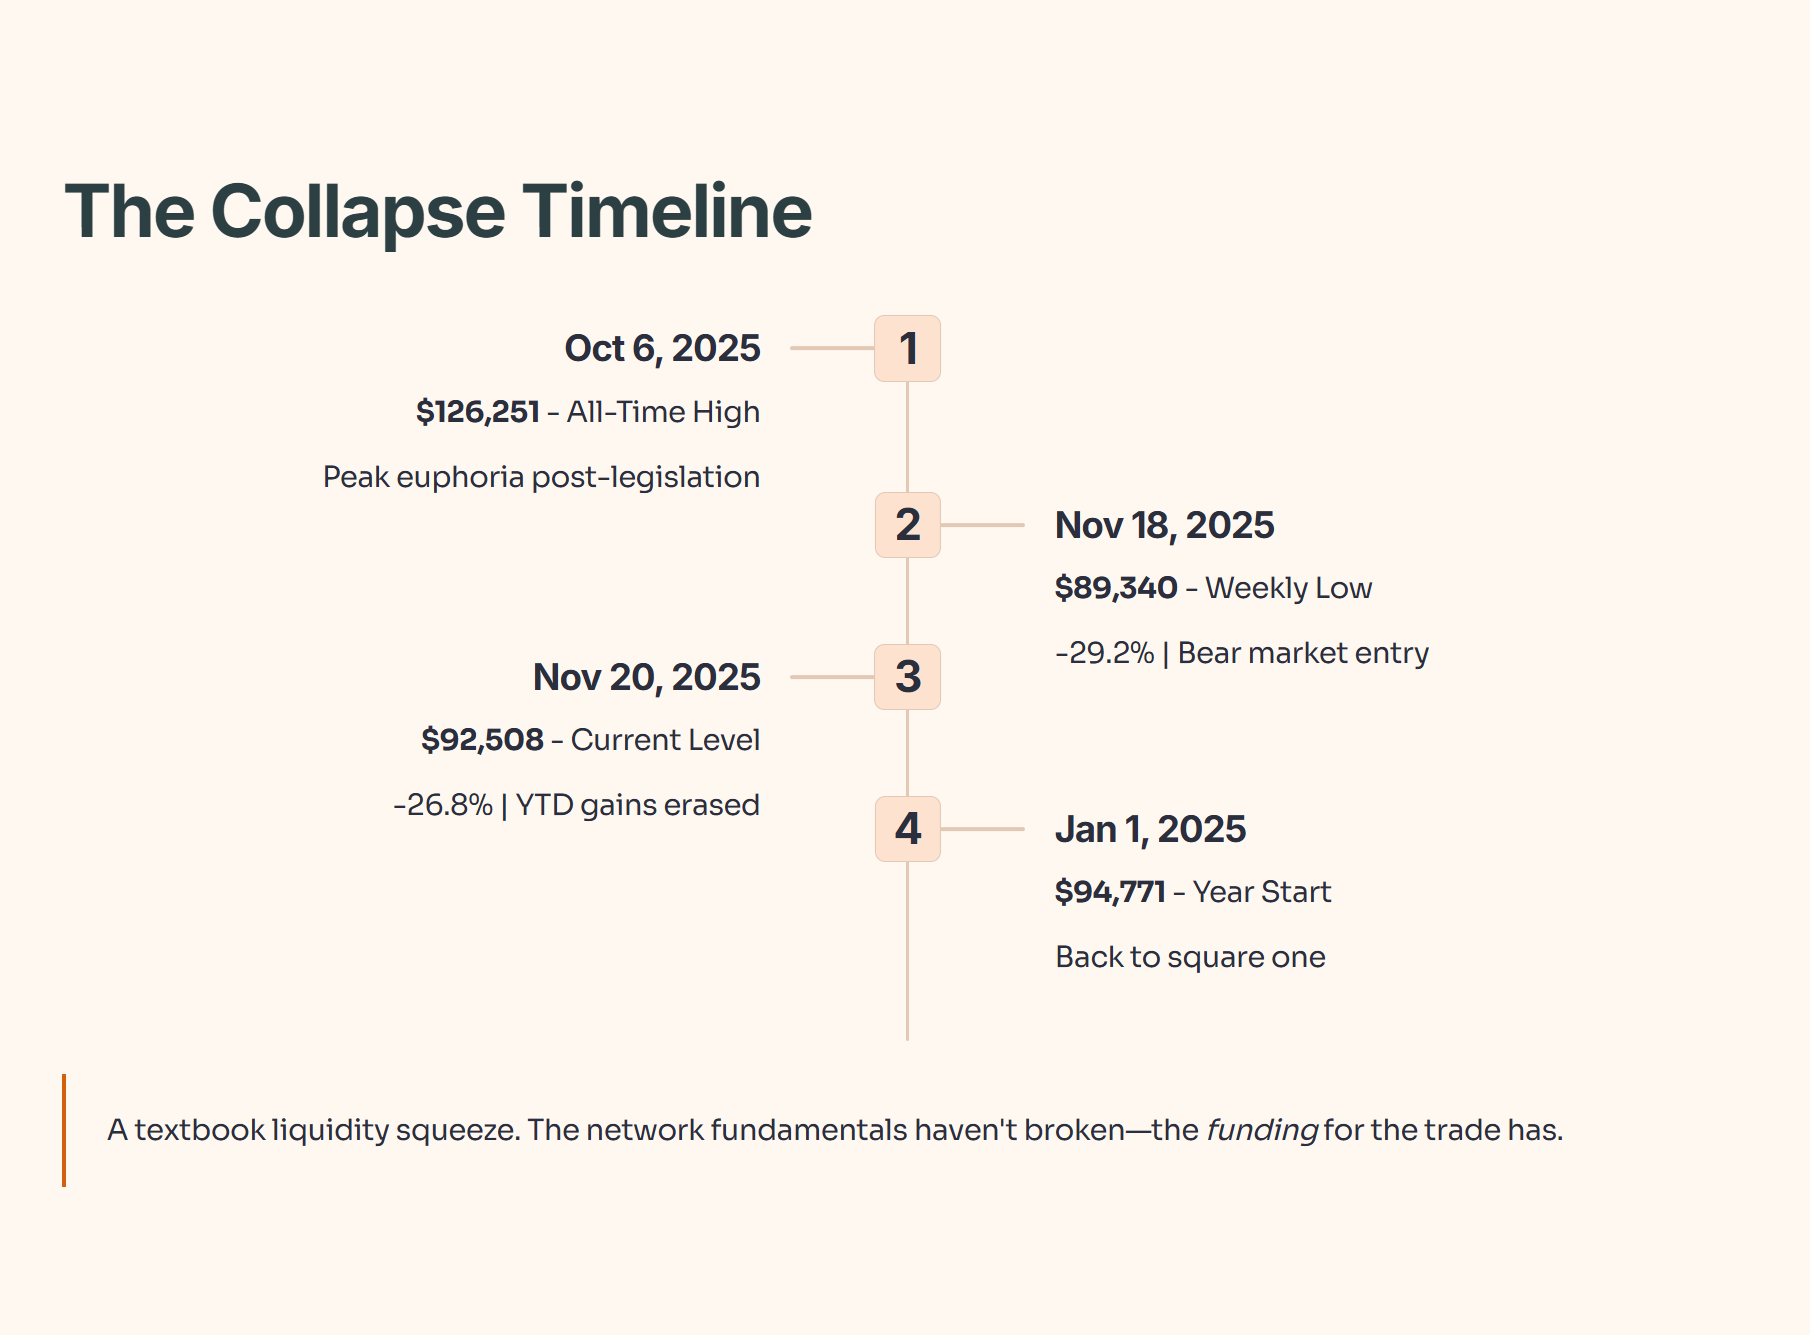
Source: Market Data
This table illustrates a textbook liquidity squeeze. The fundamentals of the network haven’t broken; the funding for the trade has.
The Divergence: Whales vs. Retail
This is the most important chart you aren’t seeing on the news. There is a massive split in behavior between “Tourist Capital” (Retail/ETFs) and “Conviction Capital” (Whales/Institutions).
The Flow of Funds
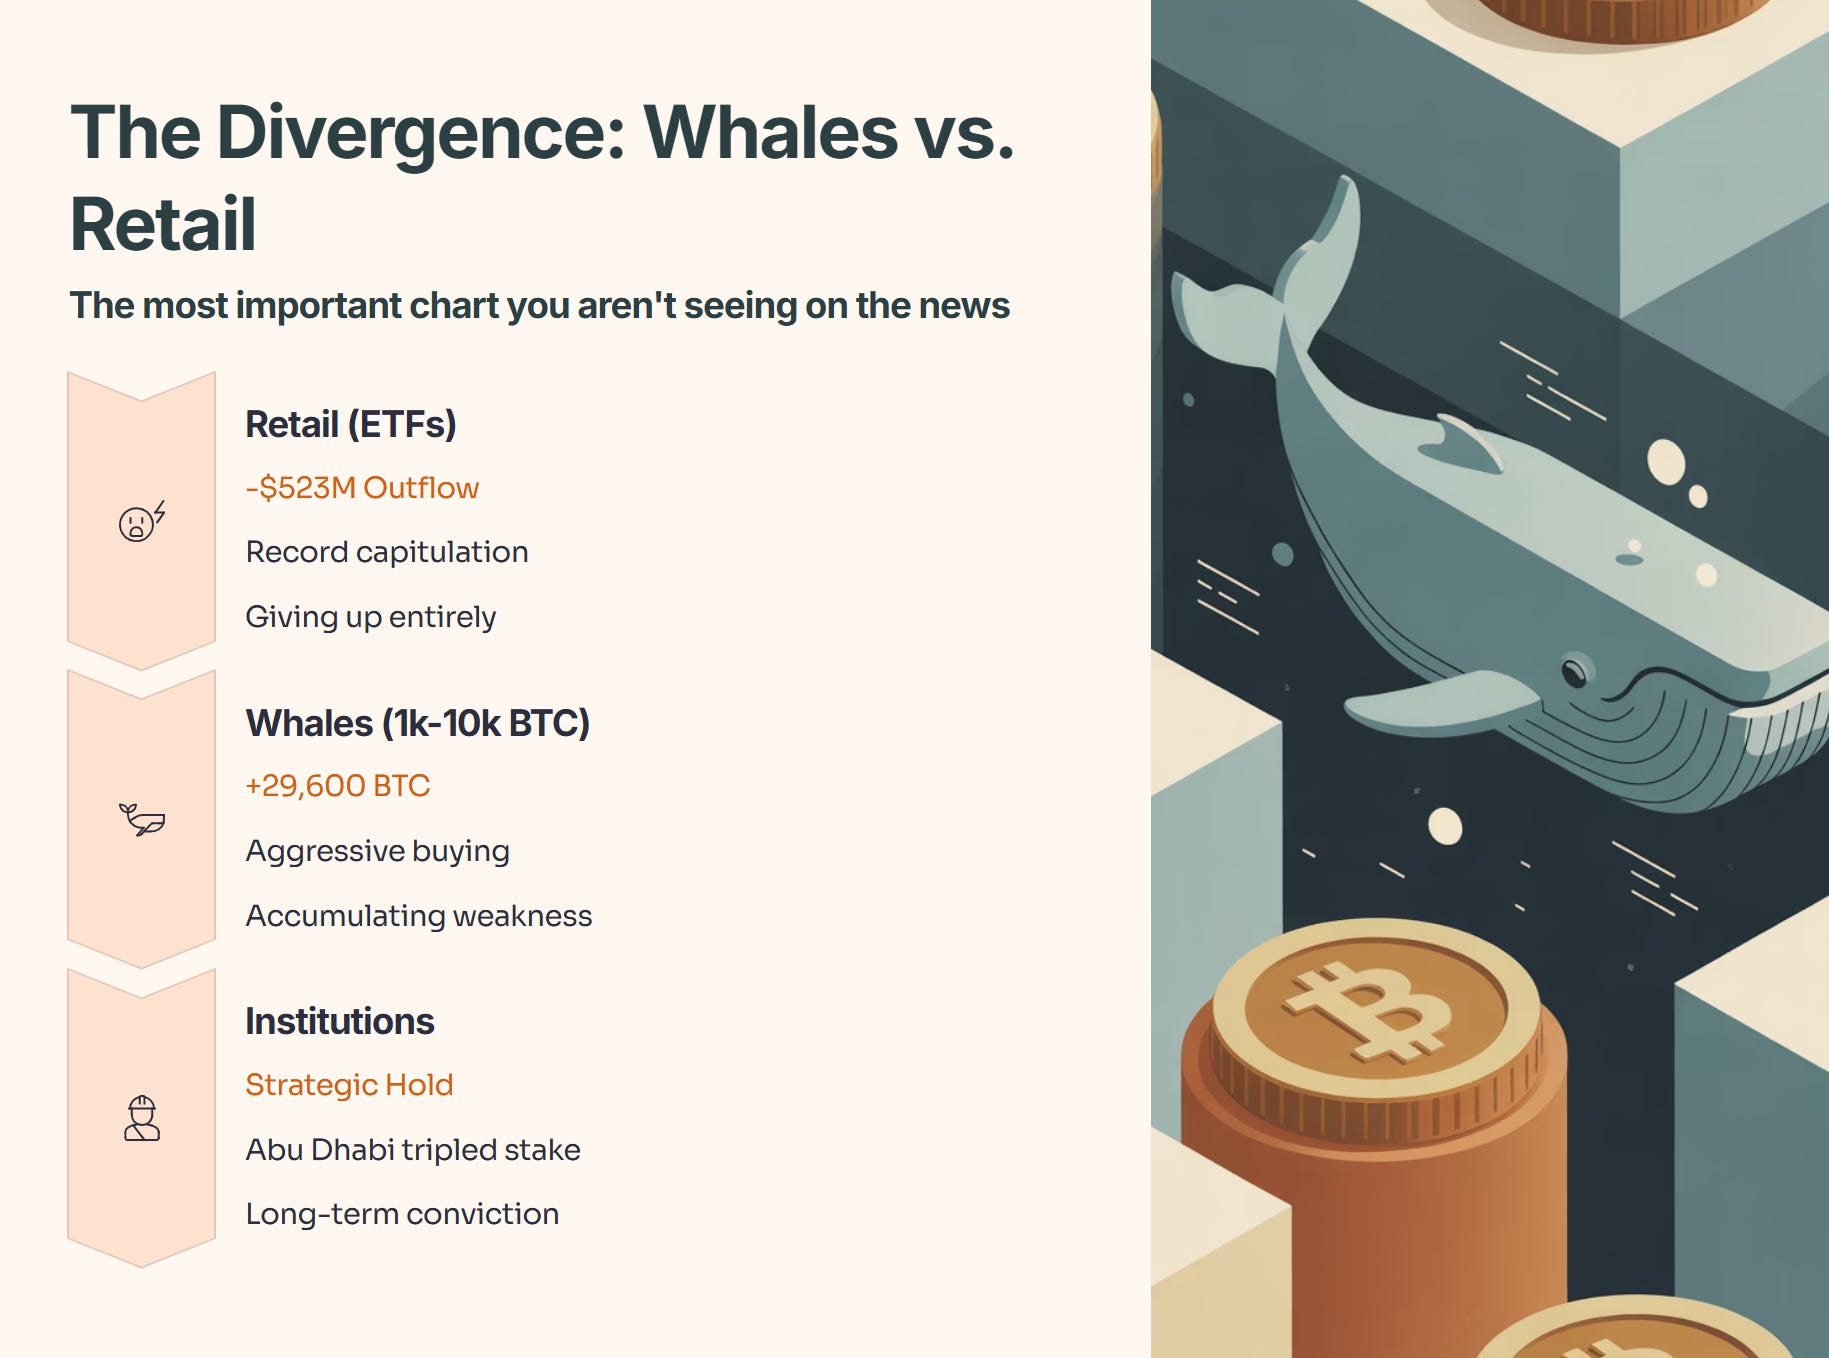
While the iShares Bitcoin Trust (IBIT) saw record outflows, wallets holding over 1,000 BTC injected roughly US$3 billion into the market during this dip. One strategic accumulator purchased US$835M worth of Bitcoin at an average of US$102k.
They aren’t buying because they like losing money. They are buying because they view the asset as mispriced relative to the long-term structural trend.
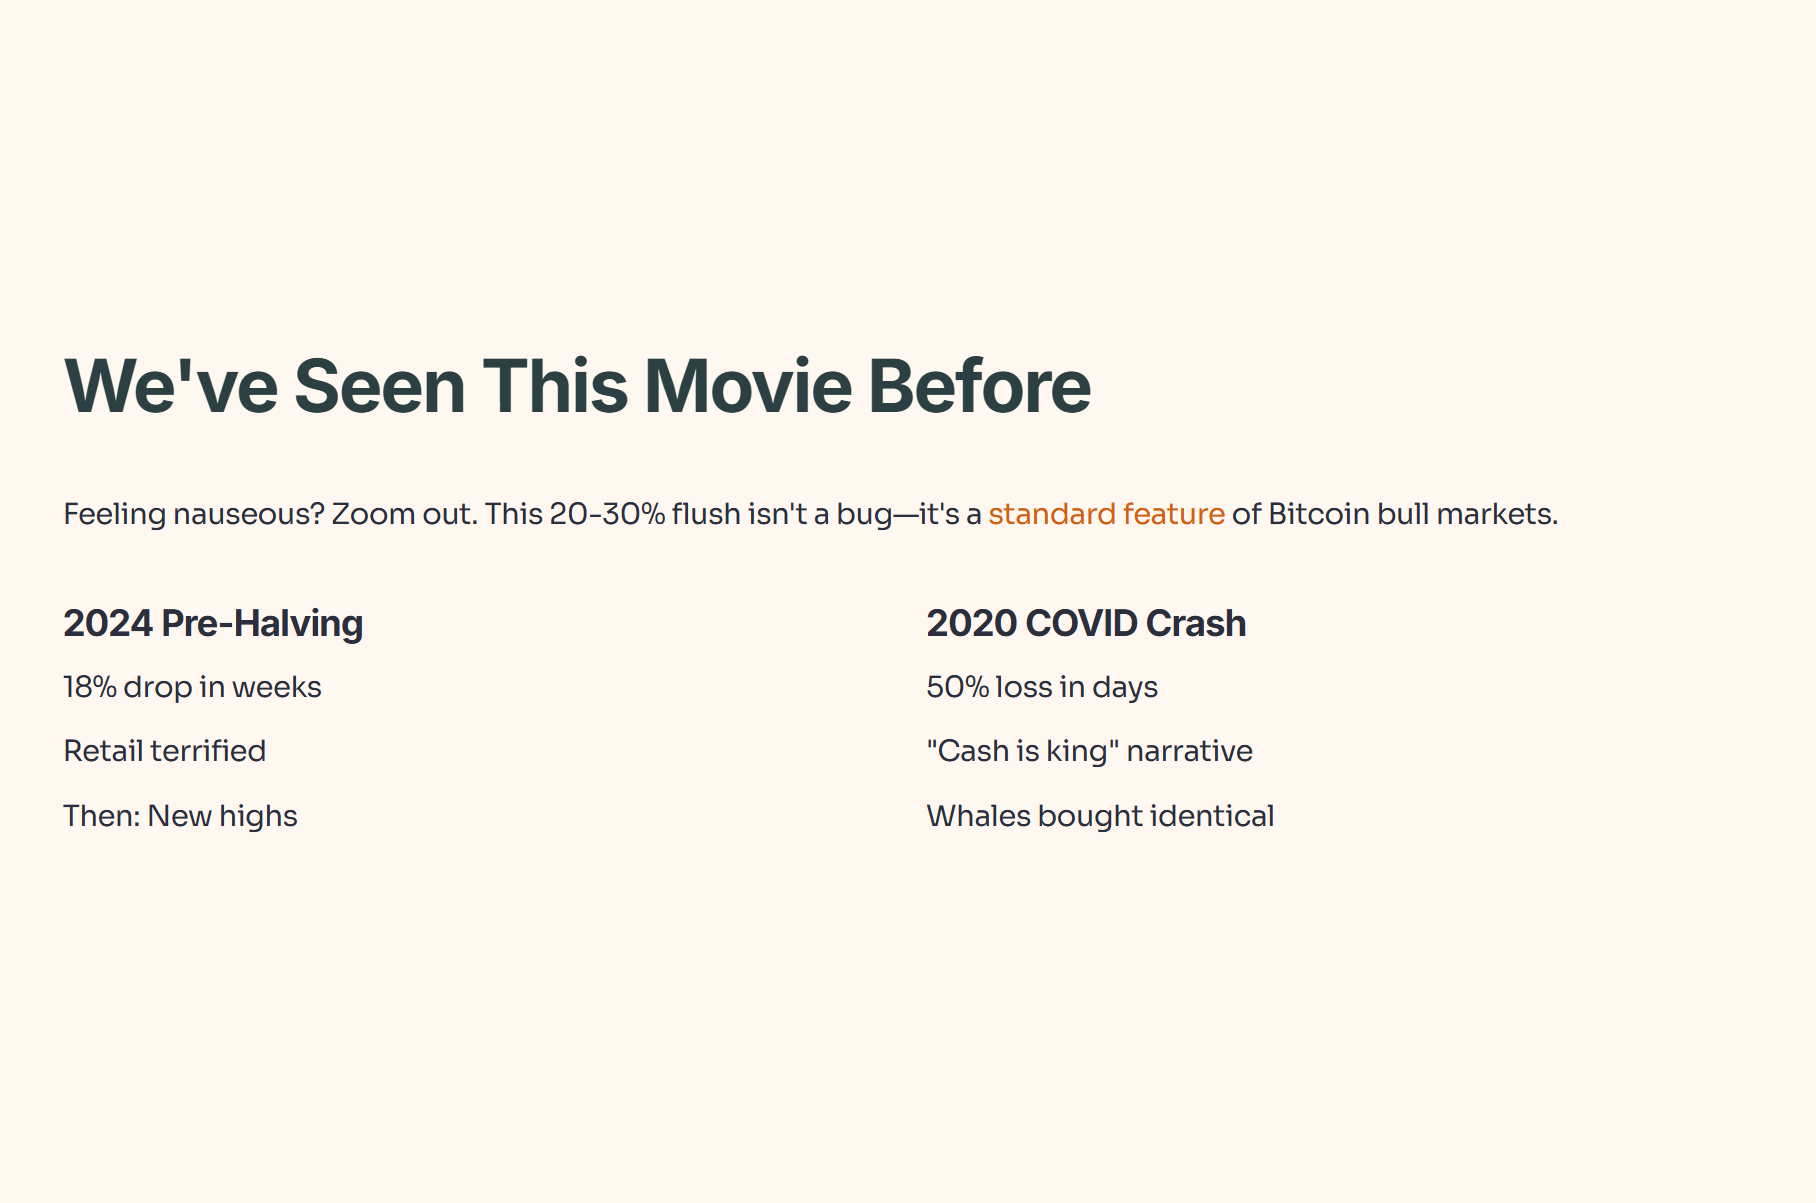
The Historical Mirror: We Have Seen This Movie Before
If you are feeling nauseous looking at your portfolio, zoom out. This exact scenario—a 20-30% flushing of leverage—is not a bug; it is a standard feature of Bitcoin bull markets.
Let’s look at the “Pre-Halving Retracement” of 2024. In that cycle, Bitcoin dropped 18% in weeks, terrifying retail investors who thought the run was over. What happened next? It consolidated for two months before ripping to new highs.
Go back further to the 2020 COVID Crash. Bitcoin lost 50% of its value in days. The narrative then was “cash is king.” But the on-chain data (whales buying) was identical to what we are seeing today.
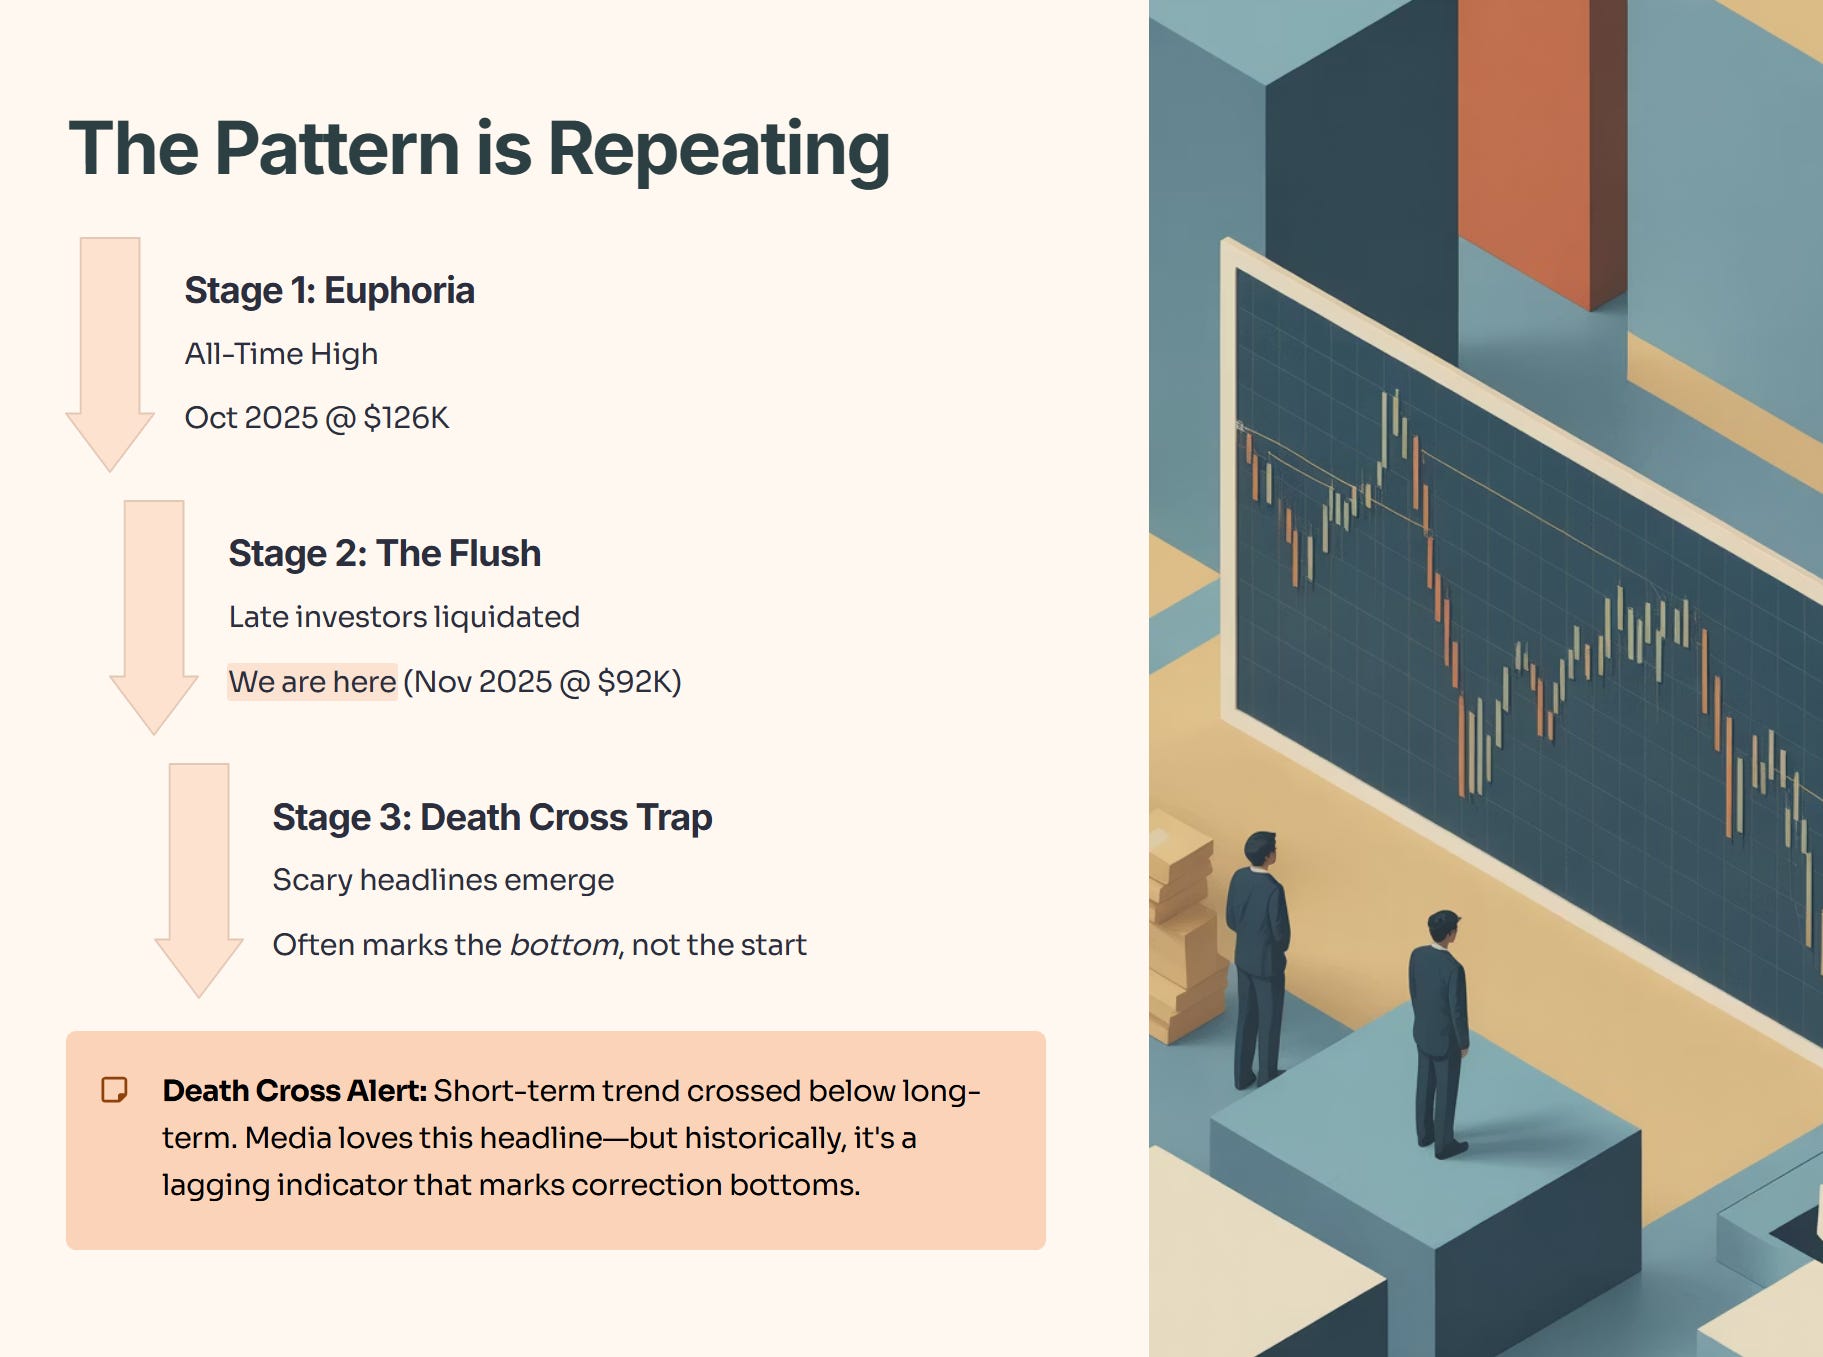
The Pattern is Repeating:
Stage 1 (Euphoria): Asset hits All-Time High (Oct 2025 @ US$126k).
Stage 2 (The Flush): Late investors get liquidated. We are here (Nov 2025 @ US$92k).
Stage 3 (The Death Cross Trap):
Technically, we just printed a “Death Cross” (where the short-term trend line crosses below the long-term trend line). Mainstream media loves this headline because it sounds scary. But historically? It is often a lagging indicator that marks the bottom of the correction, not the start of a new winter.
The Singapore Context: The “Strong Dollar” Cushion
Here is the nuance that US-based analysts miss, but matters for your CPF and SRS planning.
