

Can CSE Still Deliver for SG Investors? 2025 Mid-Year Results Demand a Fresh Look
Sluggish order book and sticky margin pressures: Is CSE Global facing a turning point, or hidden opportunity? Here’s what serious Singaporean investors should know, and how to move next.


Navigating CSE as a Singapore Investor
Mid-2025 leaves many Singaporean investors with big questions. Economic headwinds, a shifting SGX landscape, and regional uncertainty have everyone asking: Where can CSE Global fit in your CPF or SRS-driven portfolio? You’re not alone—many feel the same way: is the long-hyped “Electrification and Communications” story running out of steam, or just getting warmed up?
Here’s how this deep dive unfolds:
Each main page from CSE’s 2025 1H financial report gets my razor-sharp breakdown—plenty of numbers, but also plain English on what it means for you. Practical tables, CPF/SRS link-ups, risks, upside, “what if” scenarios, and a direct Buy/Hold/Sell call at the end.
Let’s dig in.
Note: As always, I’m attaching the Financial Statement for you to reference as you go through my insights.
In This Article:

• Navigating CSE as a Singapore Investor
• Page 1: Key Financial Performance
• Page 2: Segmental Performance—Electrification, Communications, Automation
• Page 3: Order Book Breakdown
• Page 4: Regional Performance
• Page 5: Cash Flow and Capital Resources
• Page 6: Dividend Announcement
• Page 7: Strategic Acquisitions
• Page 8: Balance Sheet Strength
• Page 9: Intangibles and Write-Offs
• Page 10: Forward Guidance and Outlook
• Iggy’s Portfolio Guidance: What Should Singapore Investors Do?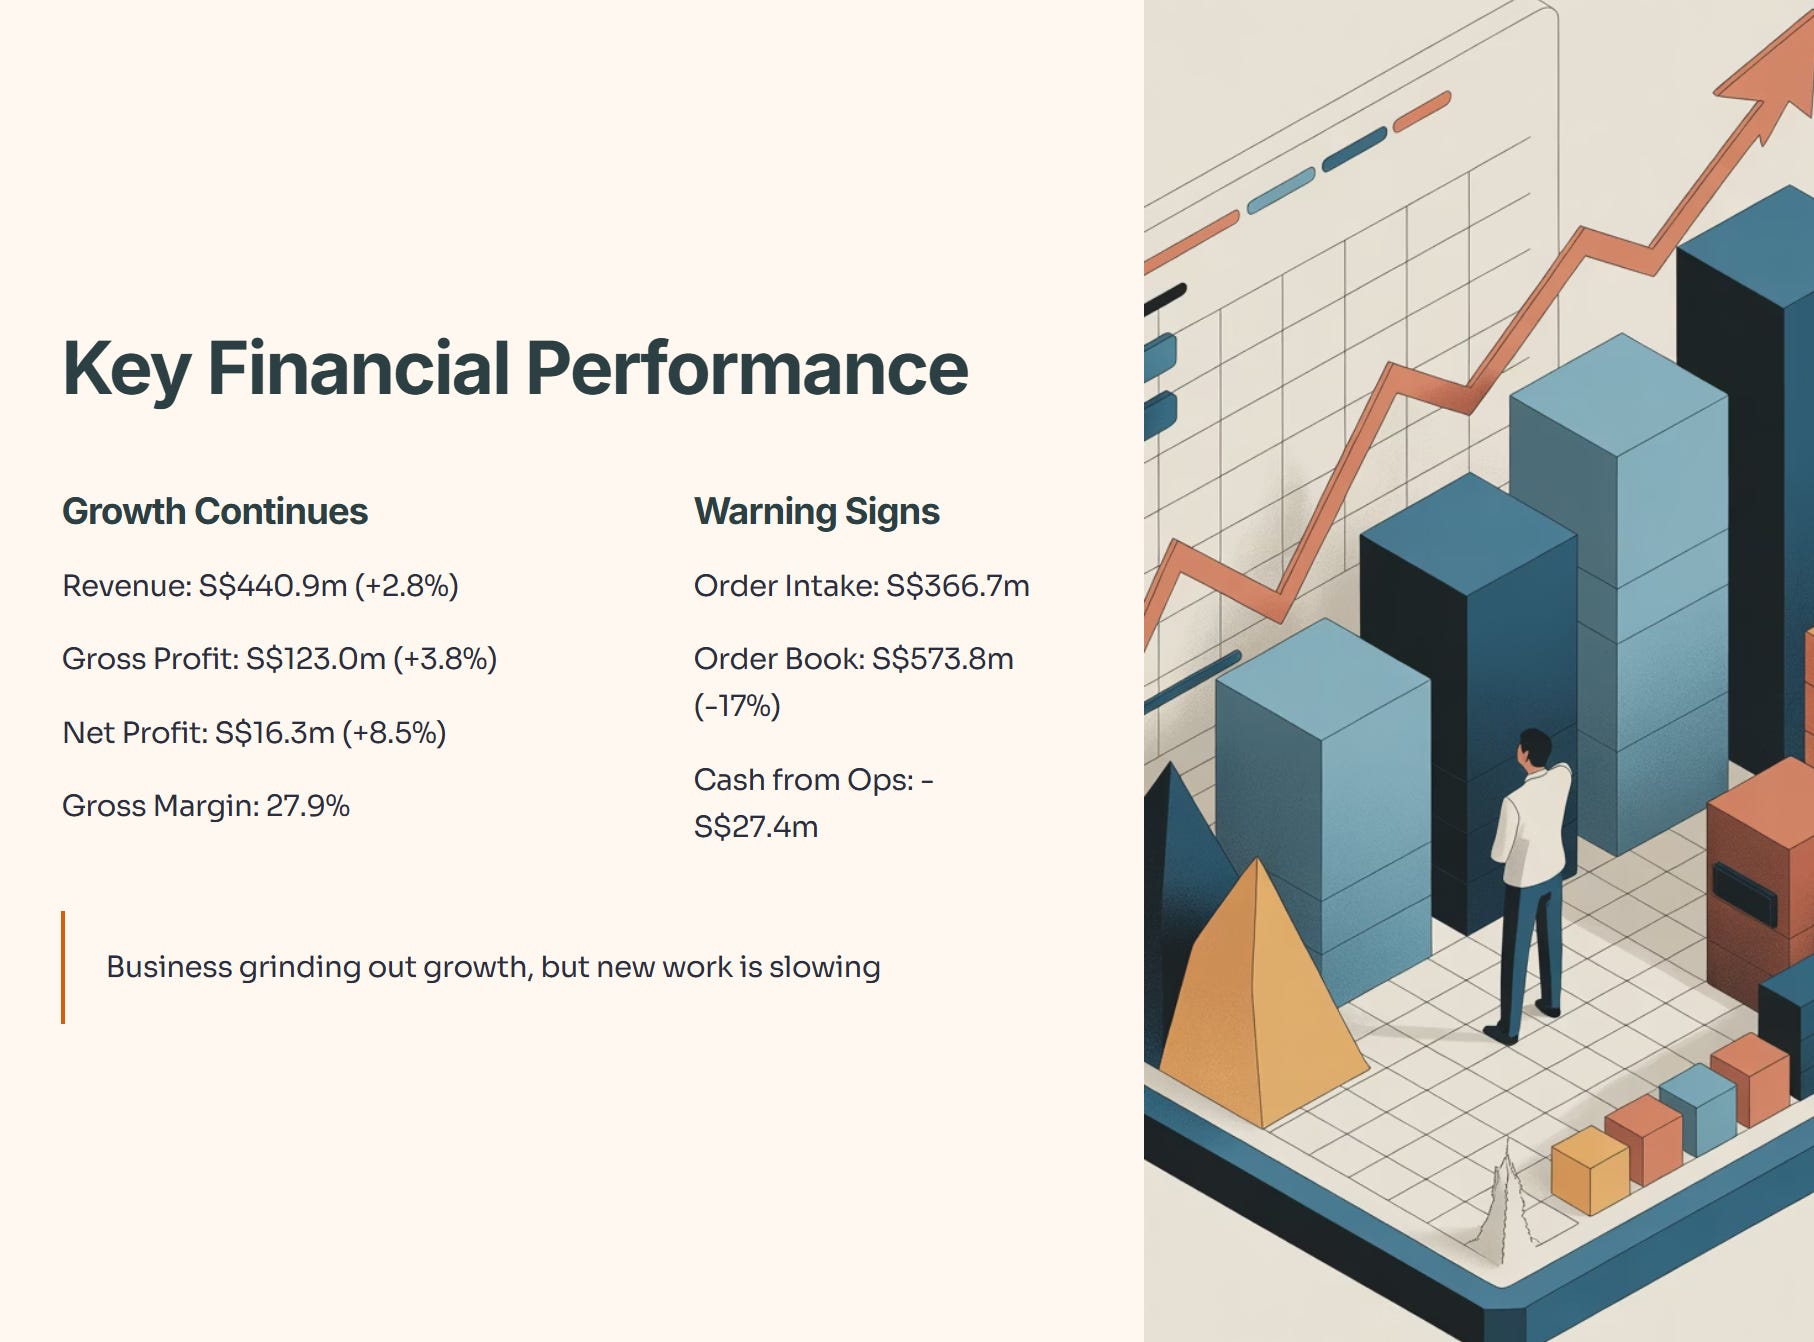
Page 1: Key Financial Performance
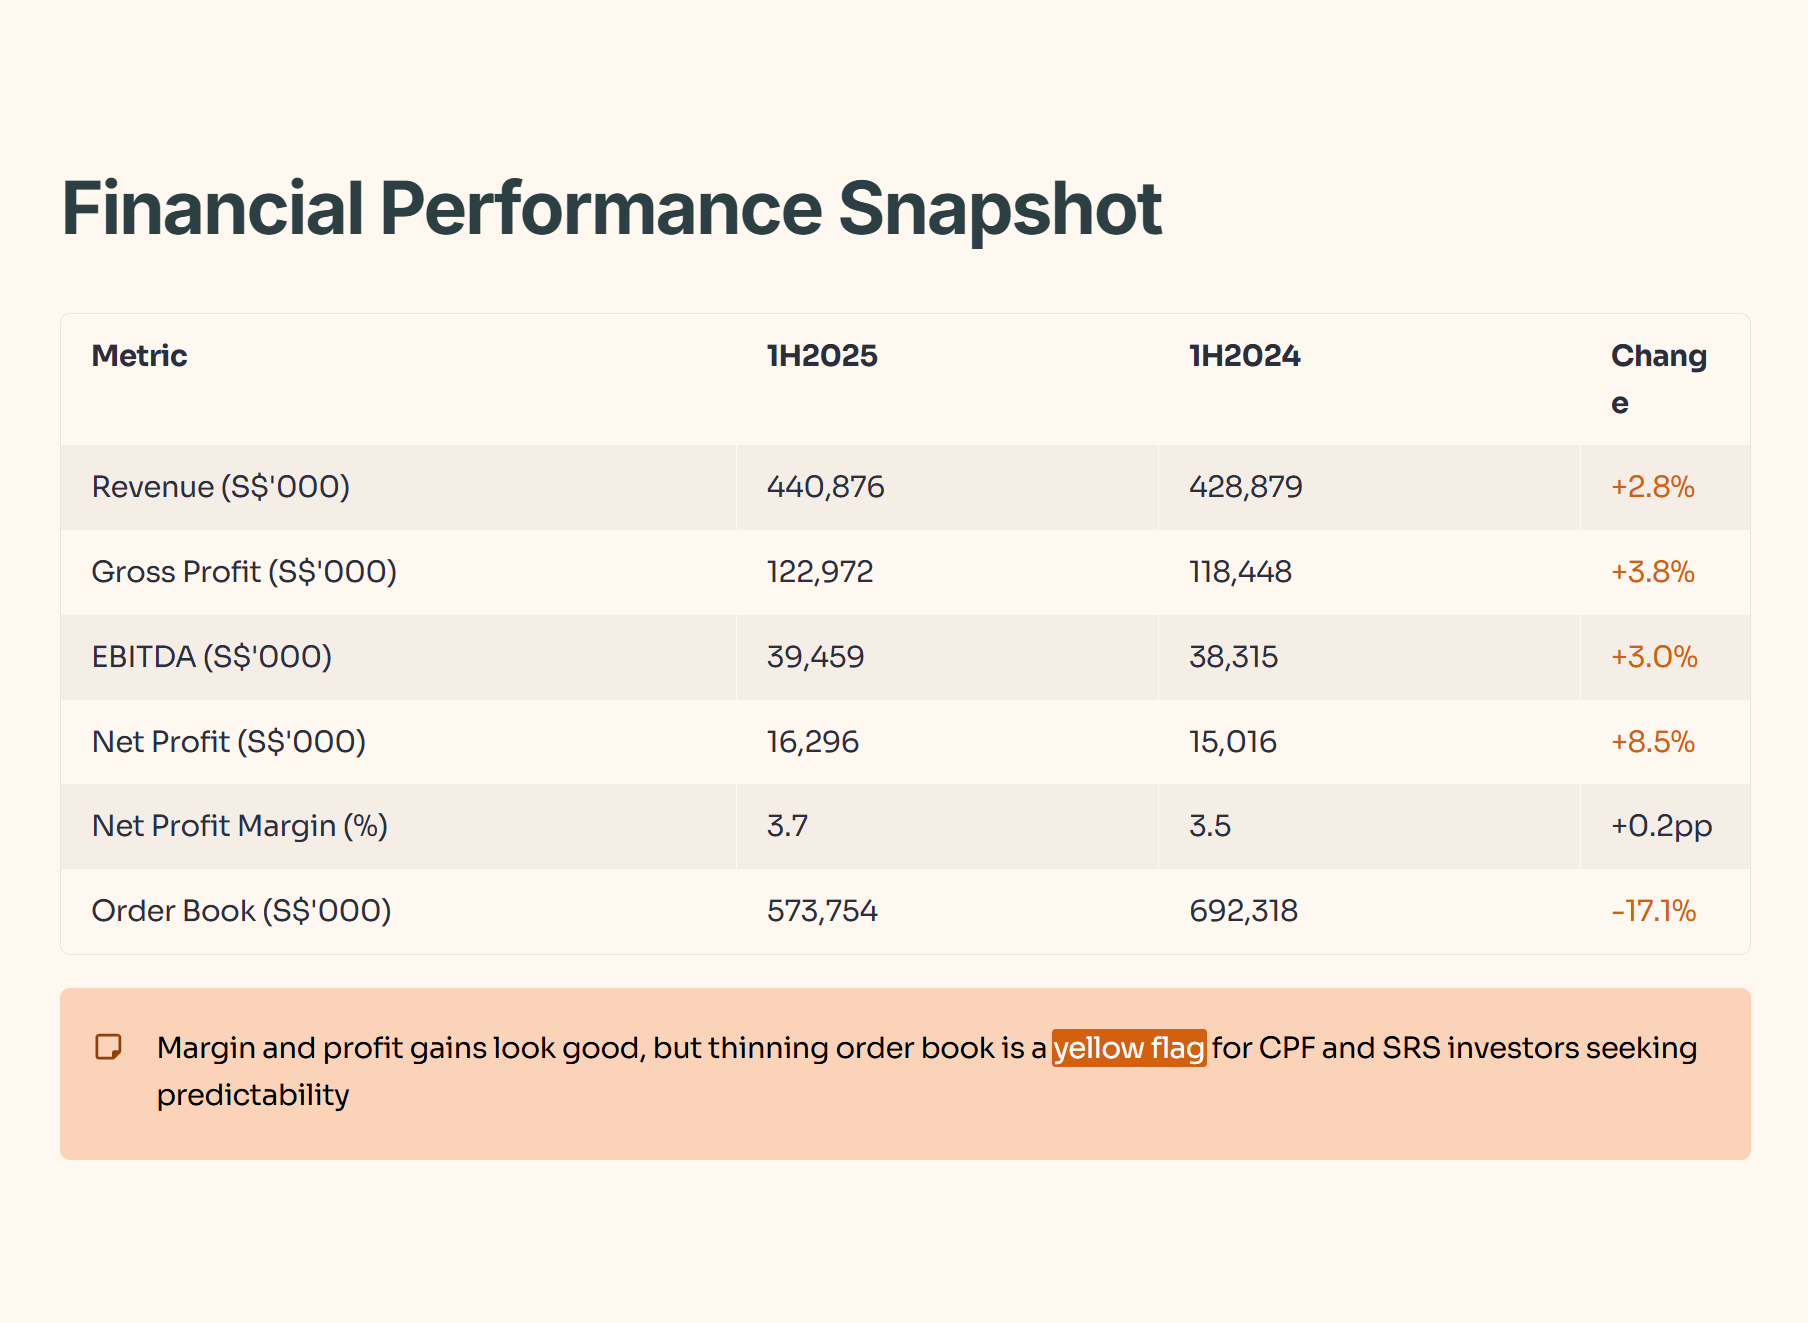
CSE chalked up S$440.9m revenue (+2.8%), S$123.0m gross profit (+3.8%), EBITDA S$39.5m (+3.0%), and net profit S$16.3m (+8.5%). Gross margin ticked up slightly to 27.9%. But order intake shrank to S$366.7m, and the order book dropped hard to S$573.8m—a 17% fall from the prior year.
This shows a business still grinding out growth, but new work is slowing. Cash from ops was negative S$27.4m, reflecting projects tying up working capital.
Table: CSE Financial Performance (S$’000, 1H2025 vs 1H2024)
Page 2: Segmental Performance—Electrification, Communications, Automation
Revenue split:
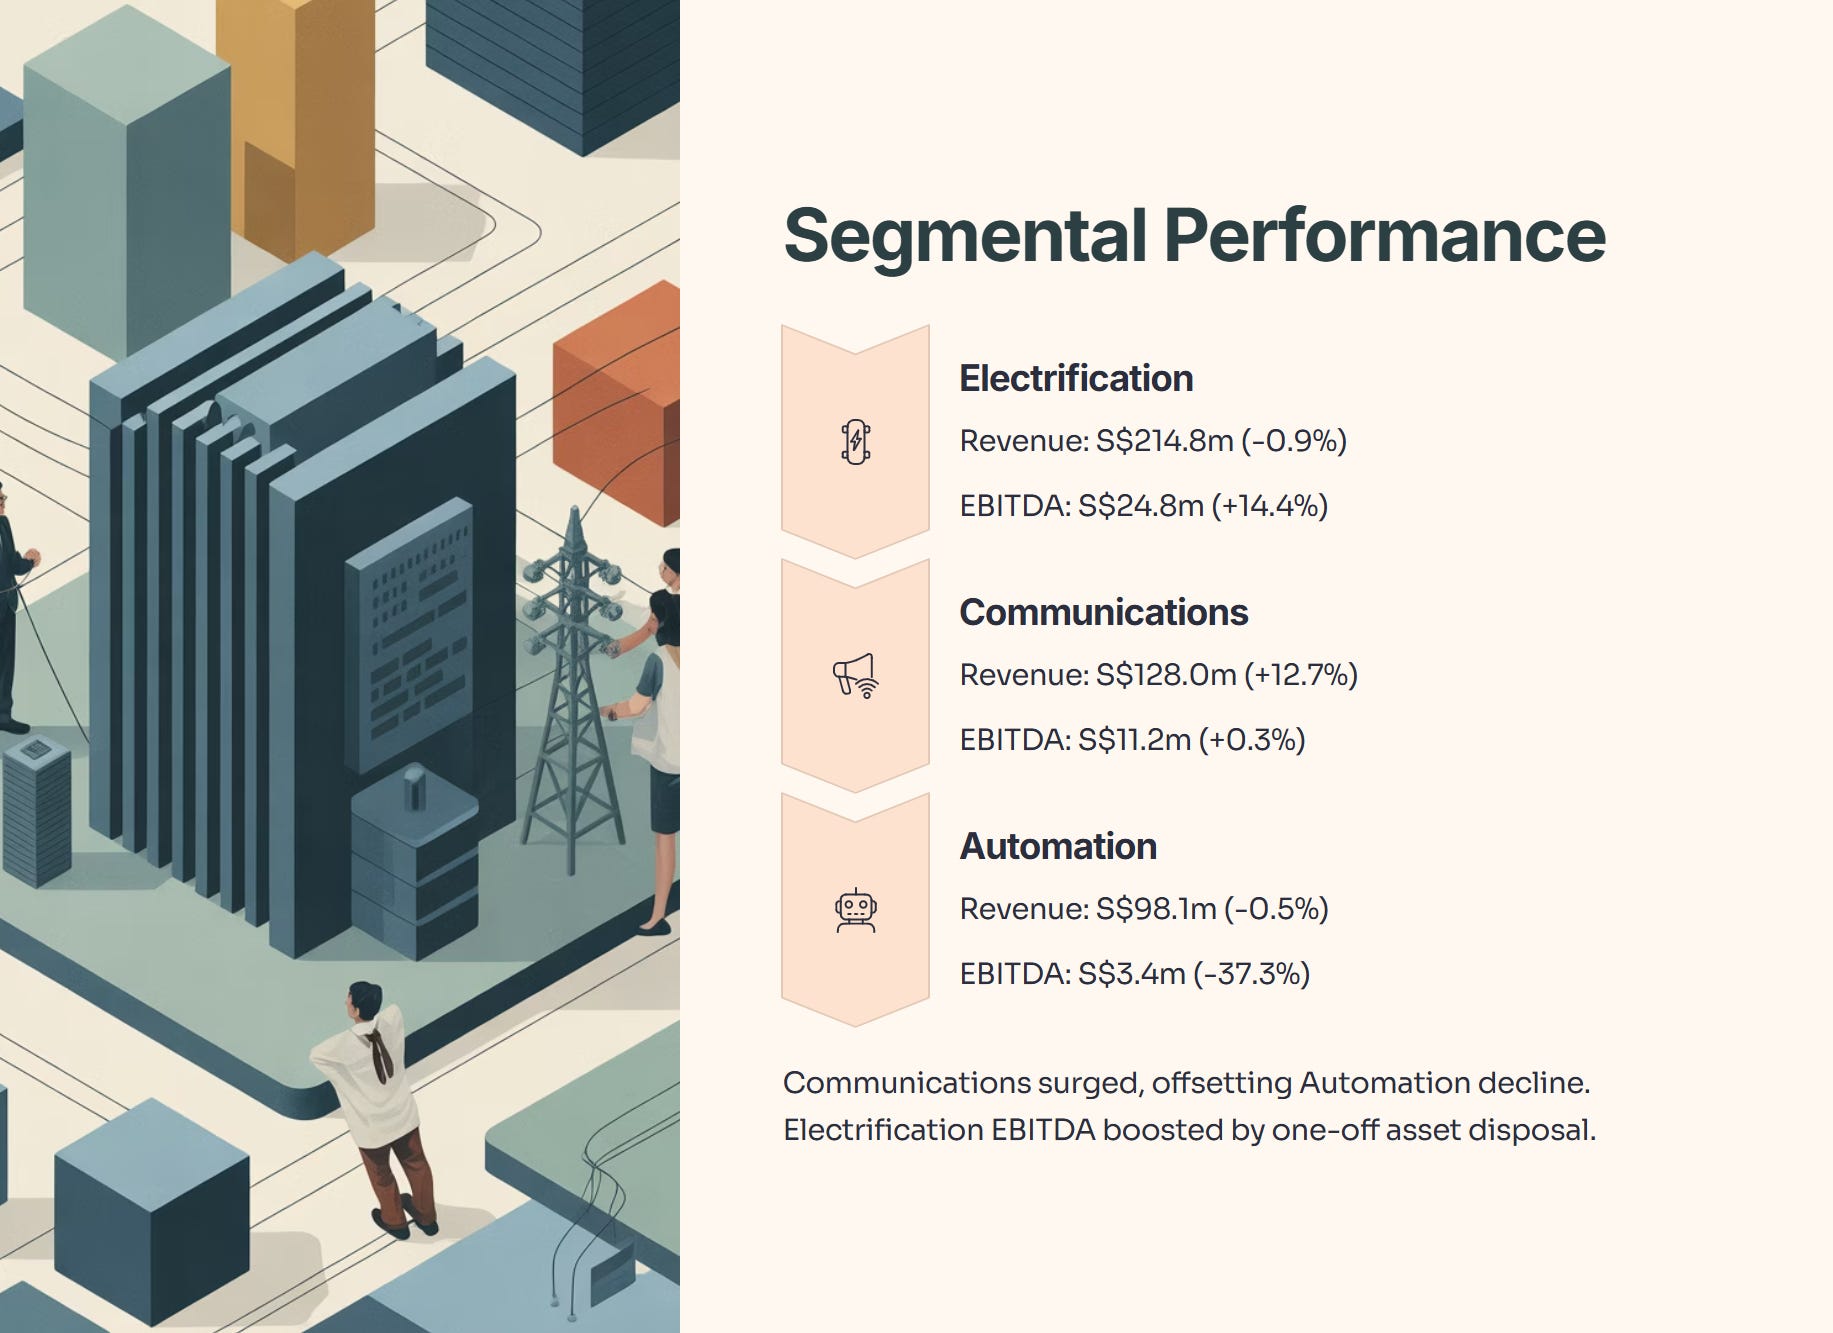
Electrification: S$214.8m (-0.9%)
Communications: S$128.0m (+12.7%)
Automation: S$98.1m (-0.5%)
EBITDA:
Electrification: S$24.8m (+14.4%)
Communications: S$11.2m (+0.3%)
Automation: S$3.4m (-37.3%)
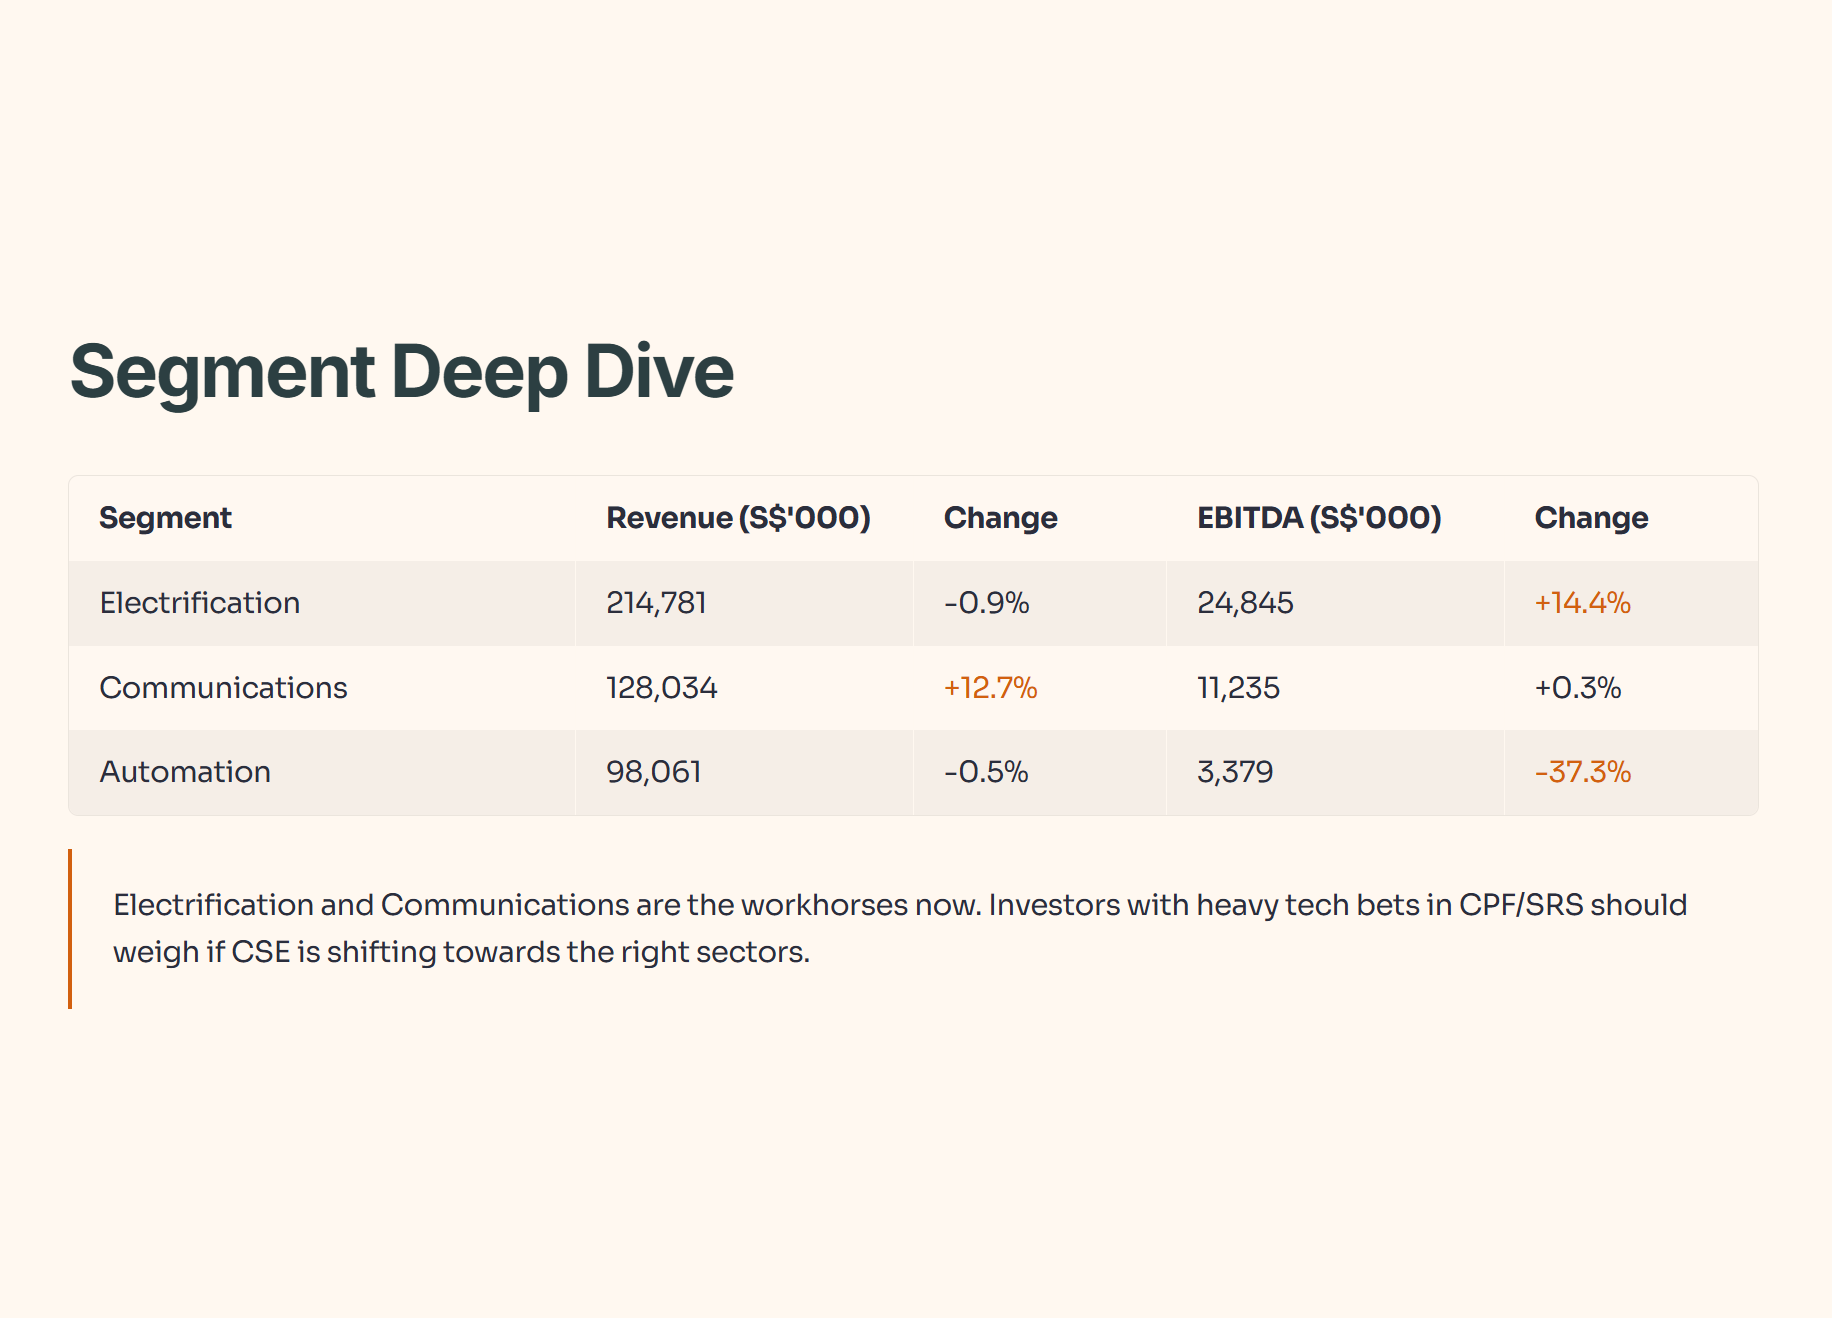
Why does this matter for your Singapore holdings? CSE’s pivot to “Electrification” and “Communications” seems justified—Communications picked up sharply, more than offsetting Automation decline. Electrification EBITDA surge was aided by a one-off asset disposal. Automation profits slumped due to asset and know-how write-offs.
Table: Segment Revenue & EBITDA (1H2025 vs 1H2024)
Page 3: Order Book Breakdown
As at June 2025: Electrification (51%), Communications (19%), Automation (31%). Total order book is S$573.8m, down notably from both December 2024 and June 2024.
A shrinking order book could mean future headwinds unless major new contracts are secured soon.
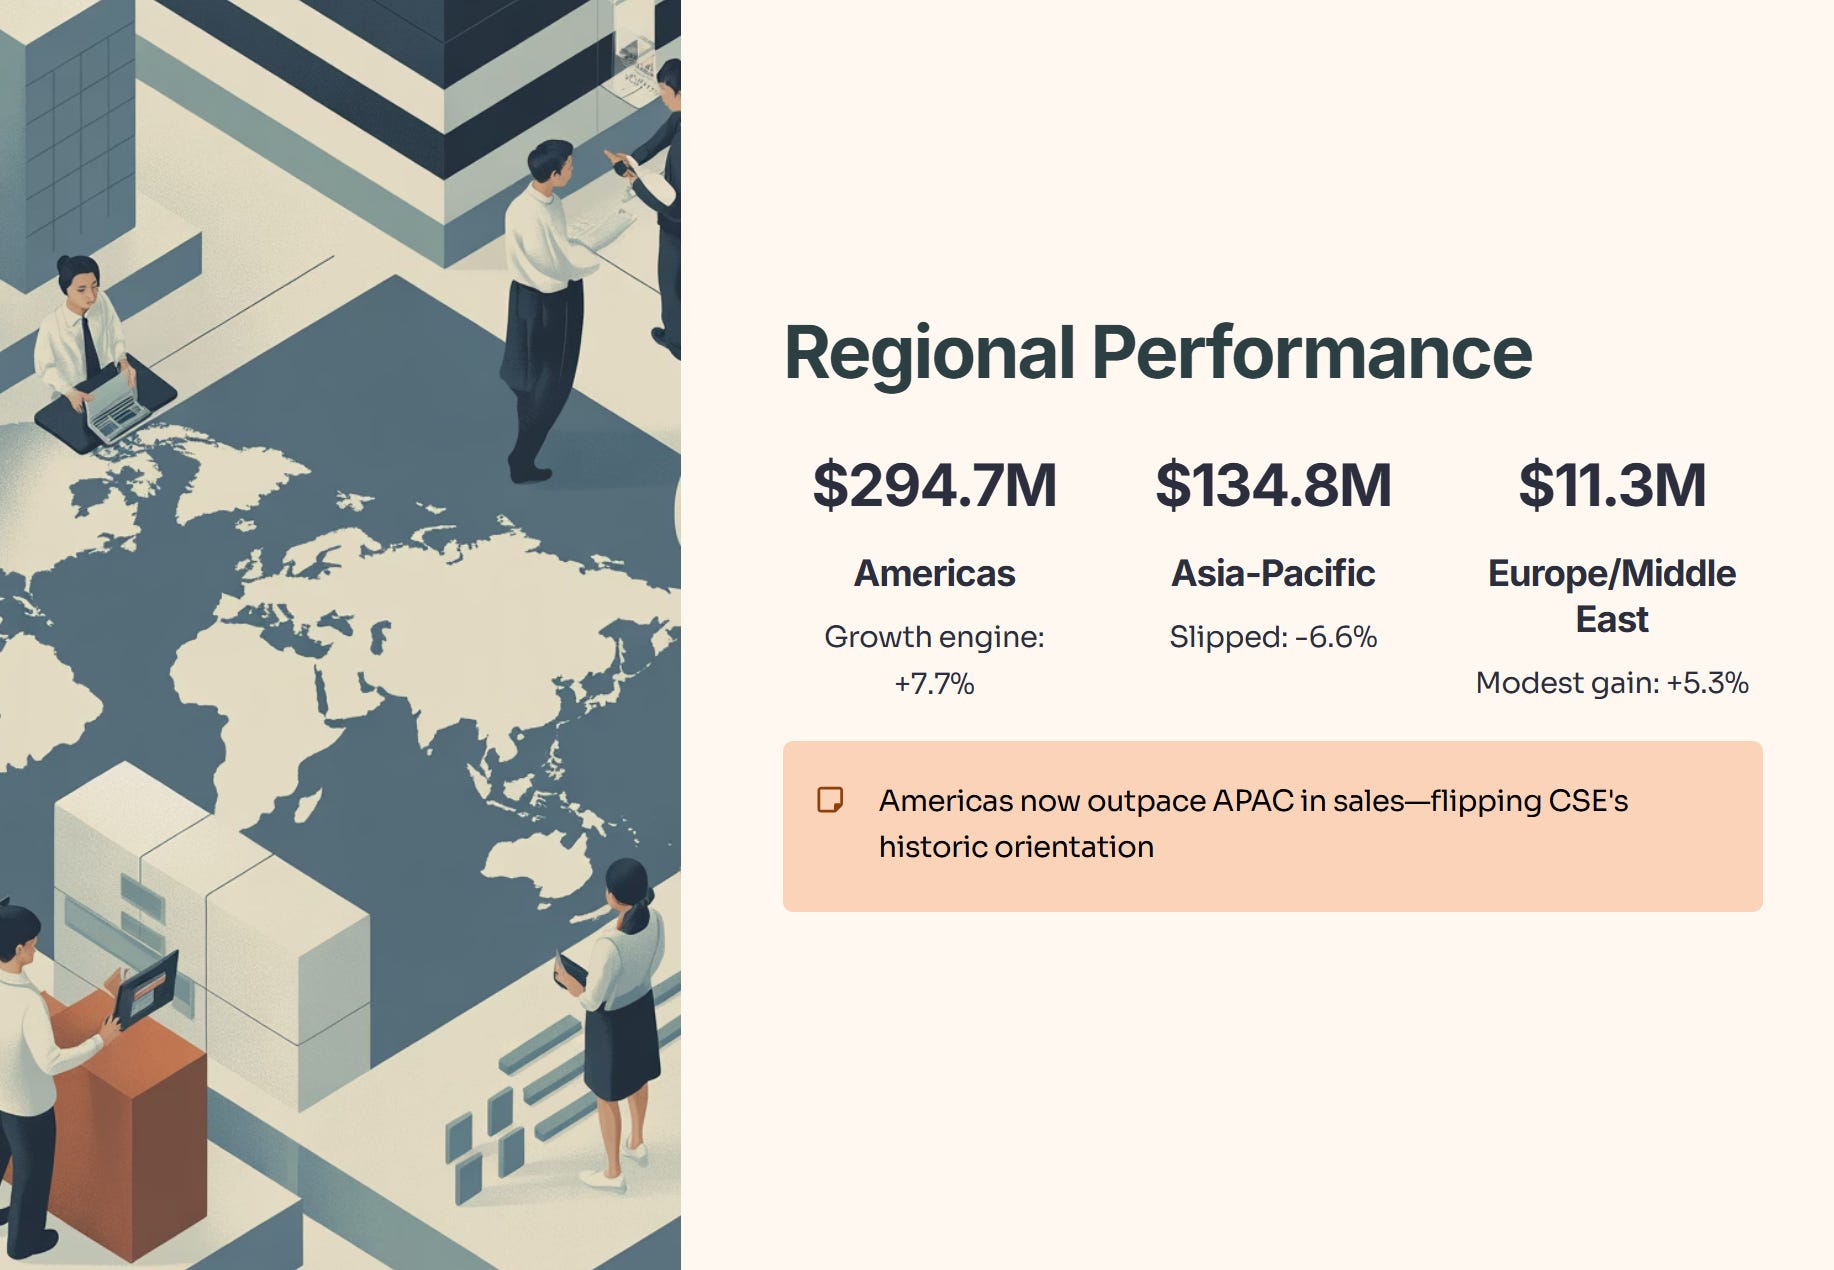
Page 4: Regional Performance
Americas remains the growth engine, pulling in S$294.7m of sales (+7.7%). Asia-Pacific slipped to S$134.8m (-6.6%). Europe/Middle East: S$11.3m (+5.3%).
What matters is not just the global footprint, but that the Americas now outpace APAC in sales—flipping CSE’s historic orientation.
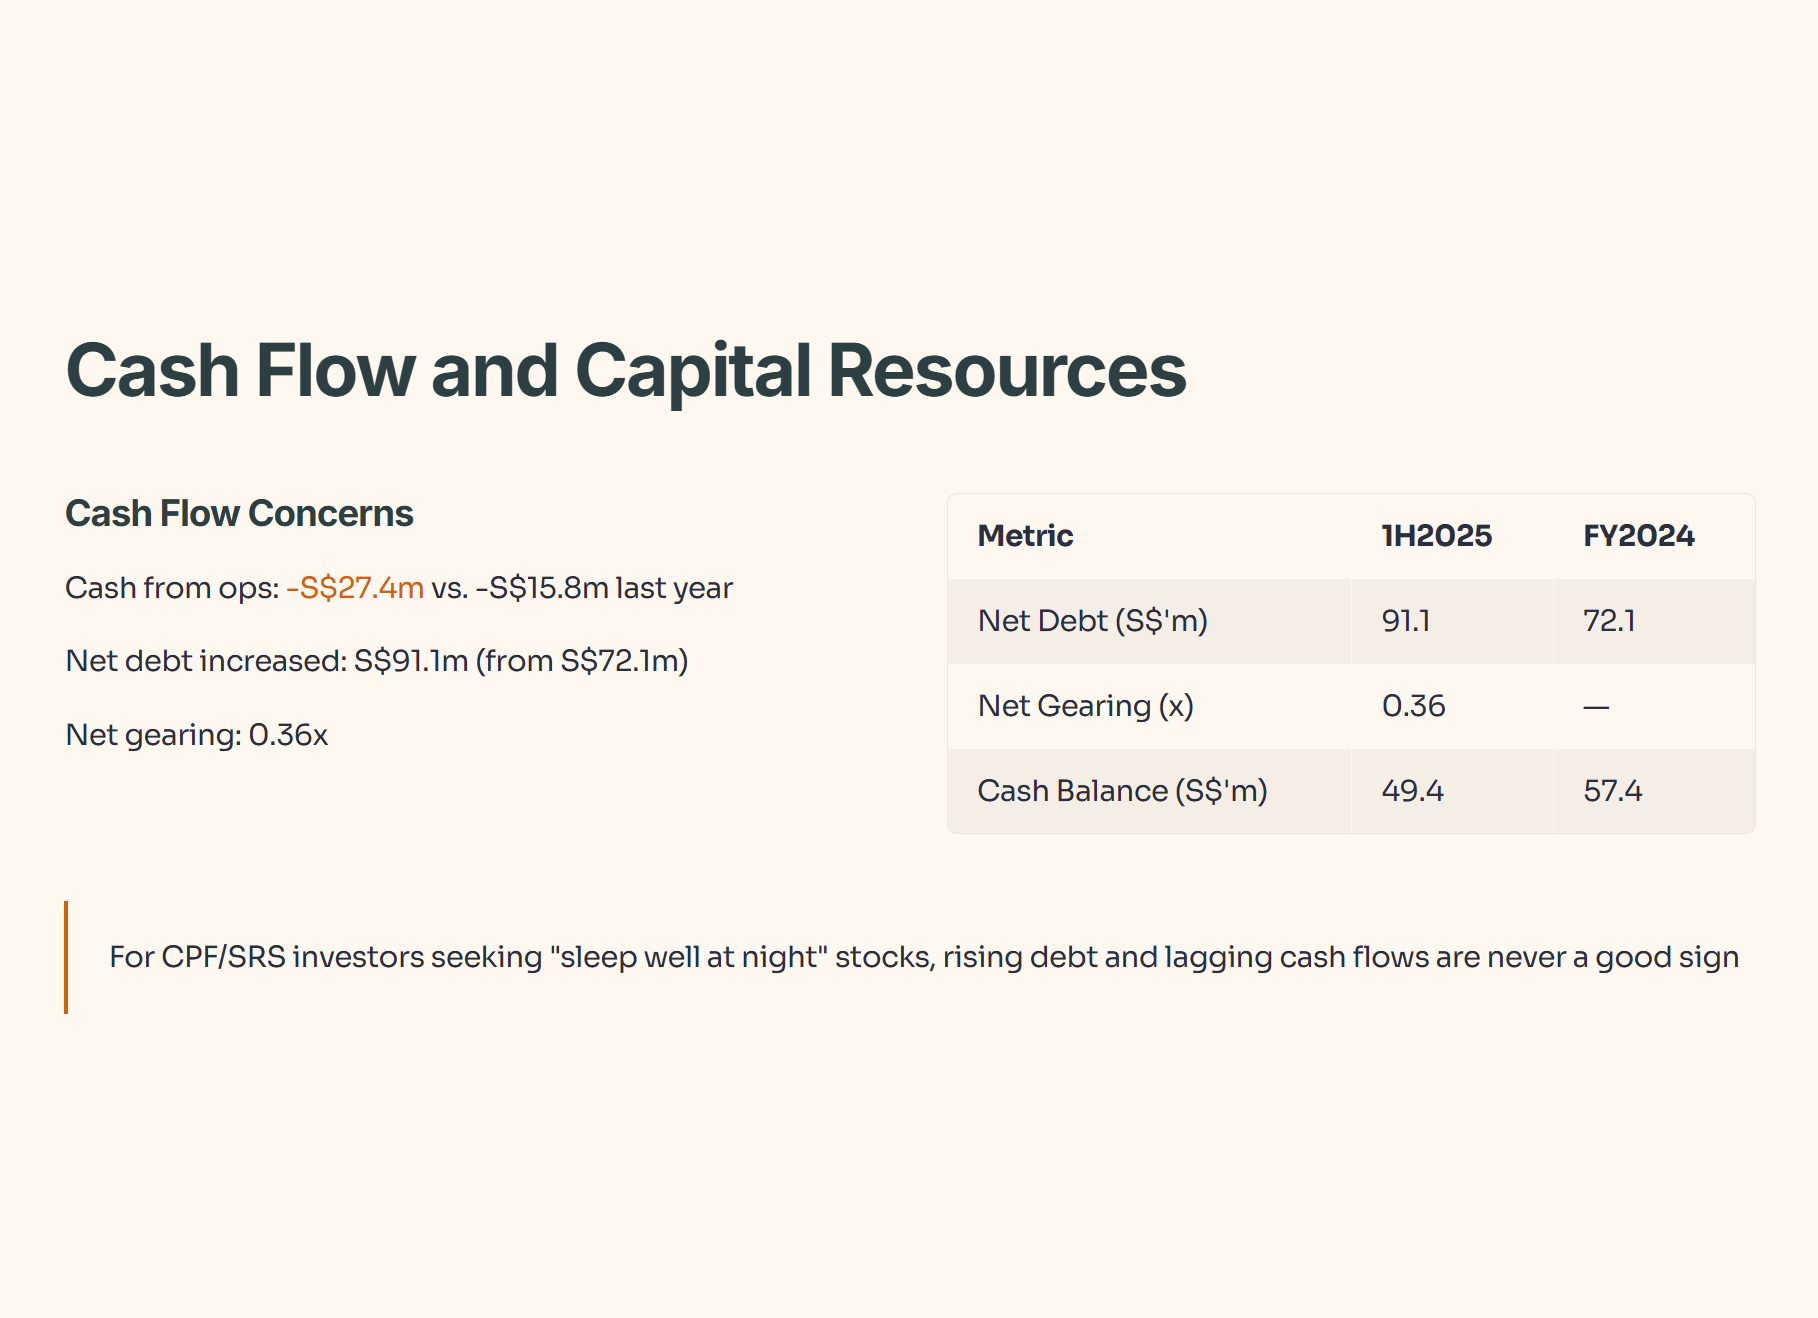
Page 5: Cash Flow and Capital Resources
Cash flow from ops was negative S$27.4m vs. negative S$15.8m last year—reflecting more cash tied in ongoing projects rather than into shareholder returns or new investments.
Net debt increased to S$91.1m (from S$72.1m end-2024). Net gearing now at 0.36x.
For dividend investors: keep an eye on how sustained negative cash flow could impact payout ability.
Table: Key Cash and Capital Metrics
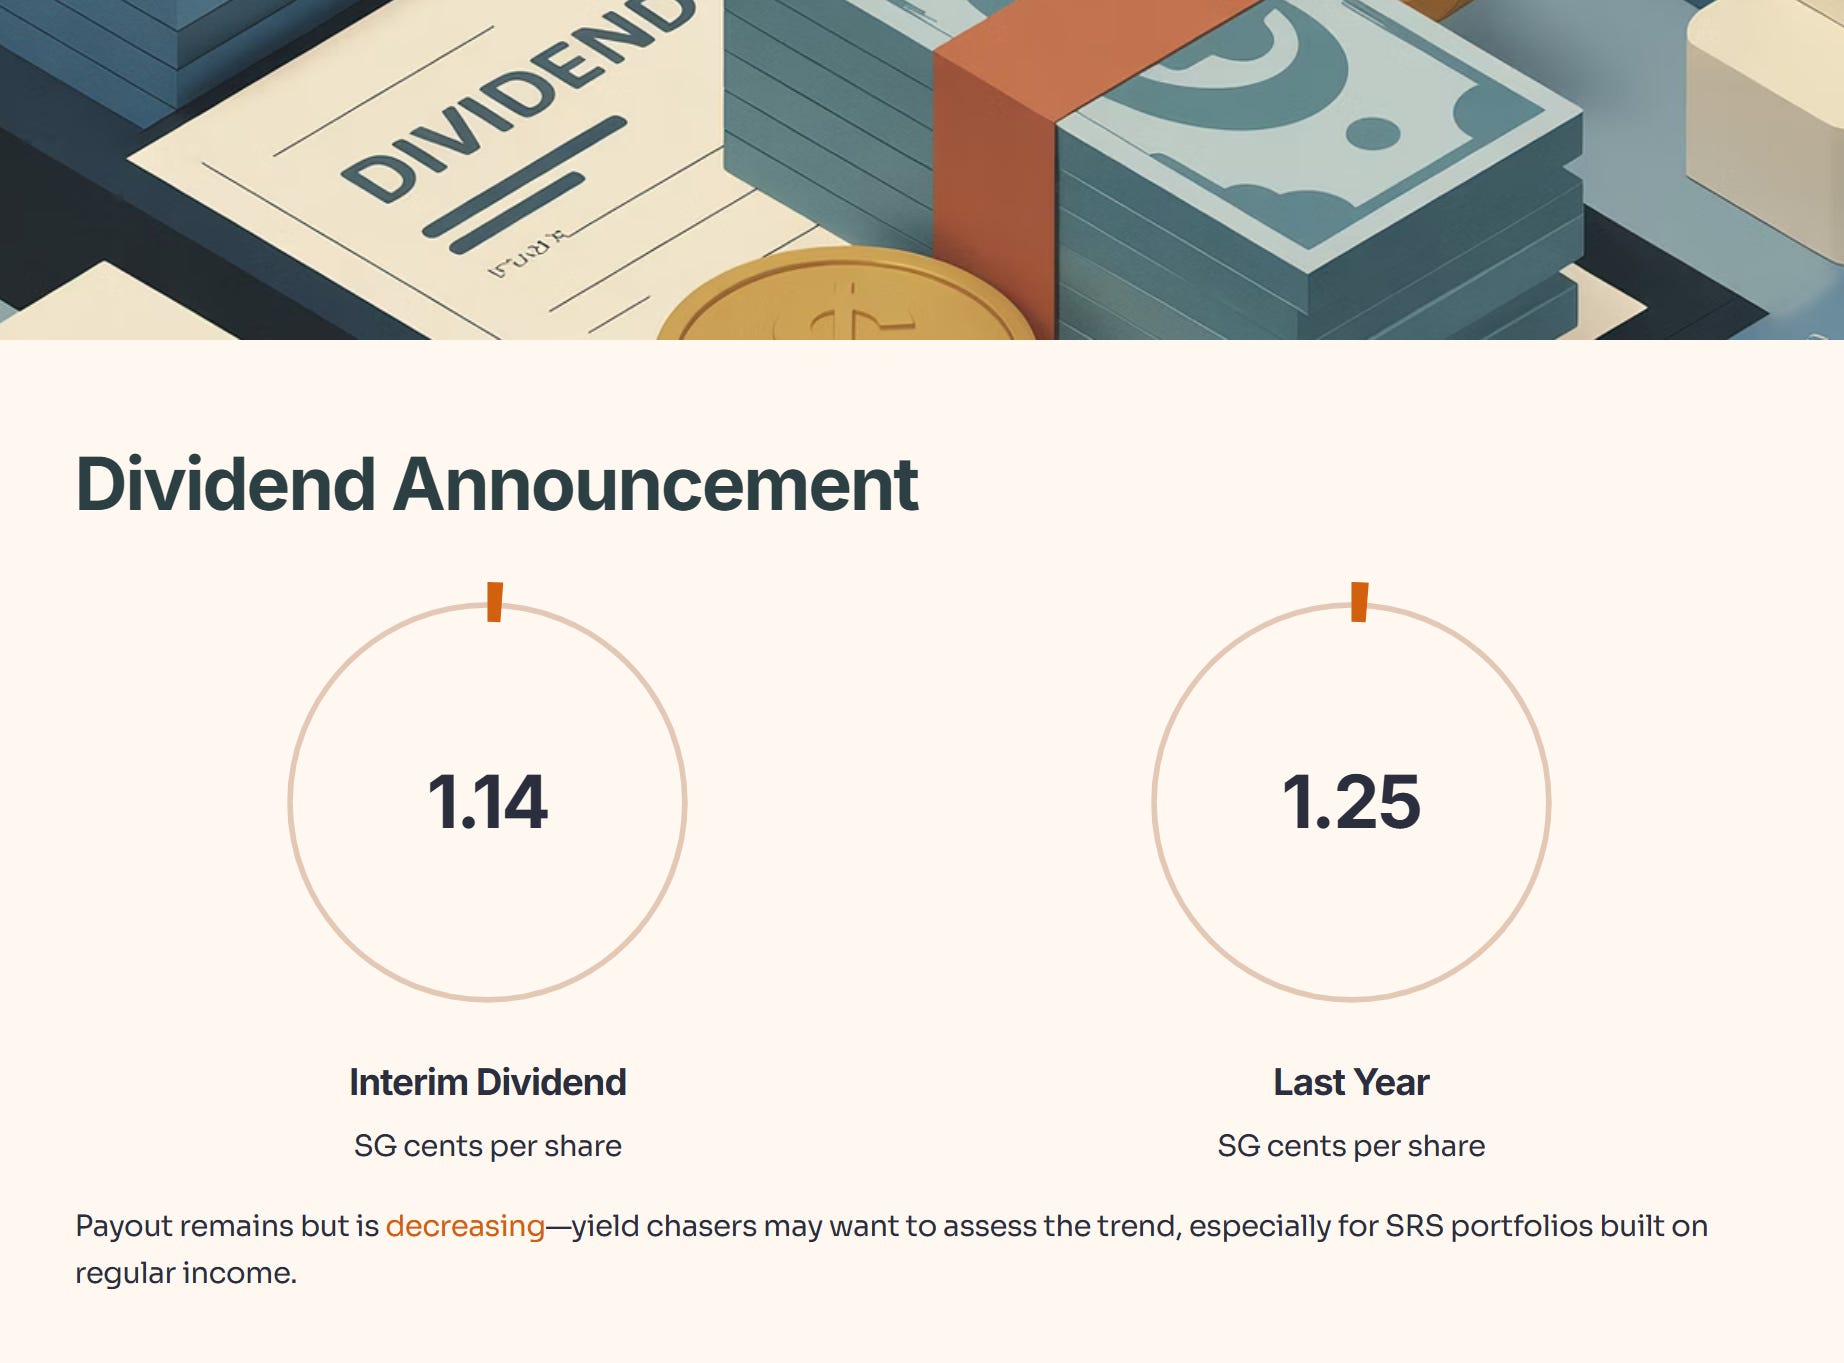
Page 6: Dividend Announcement
Interim dividend: 1.14 SG cents per share (lower than last year’s 1.25 SG cents).
Payout remains but is decreasing, so yield chasers may want to assess the trend—especially for SRS portfolios built on regular income.
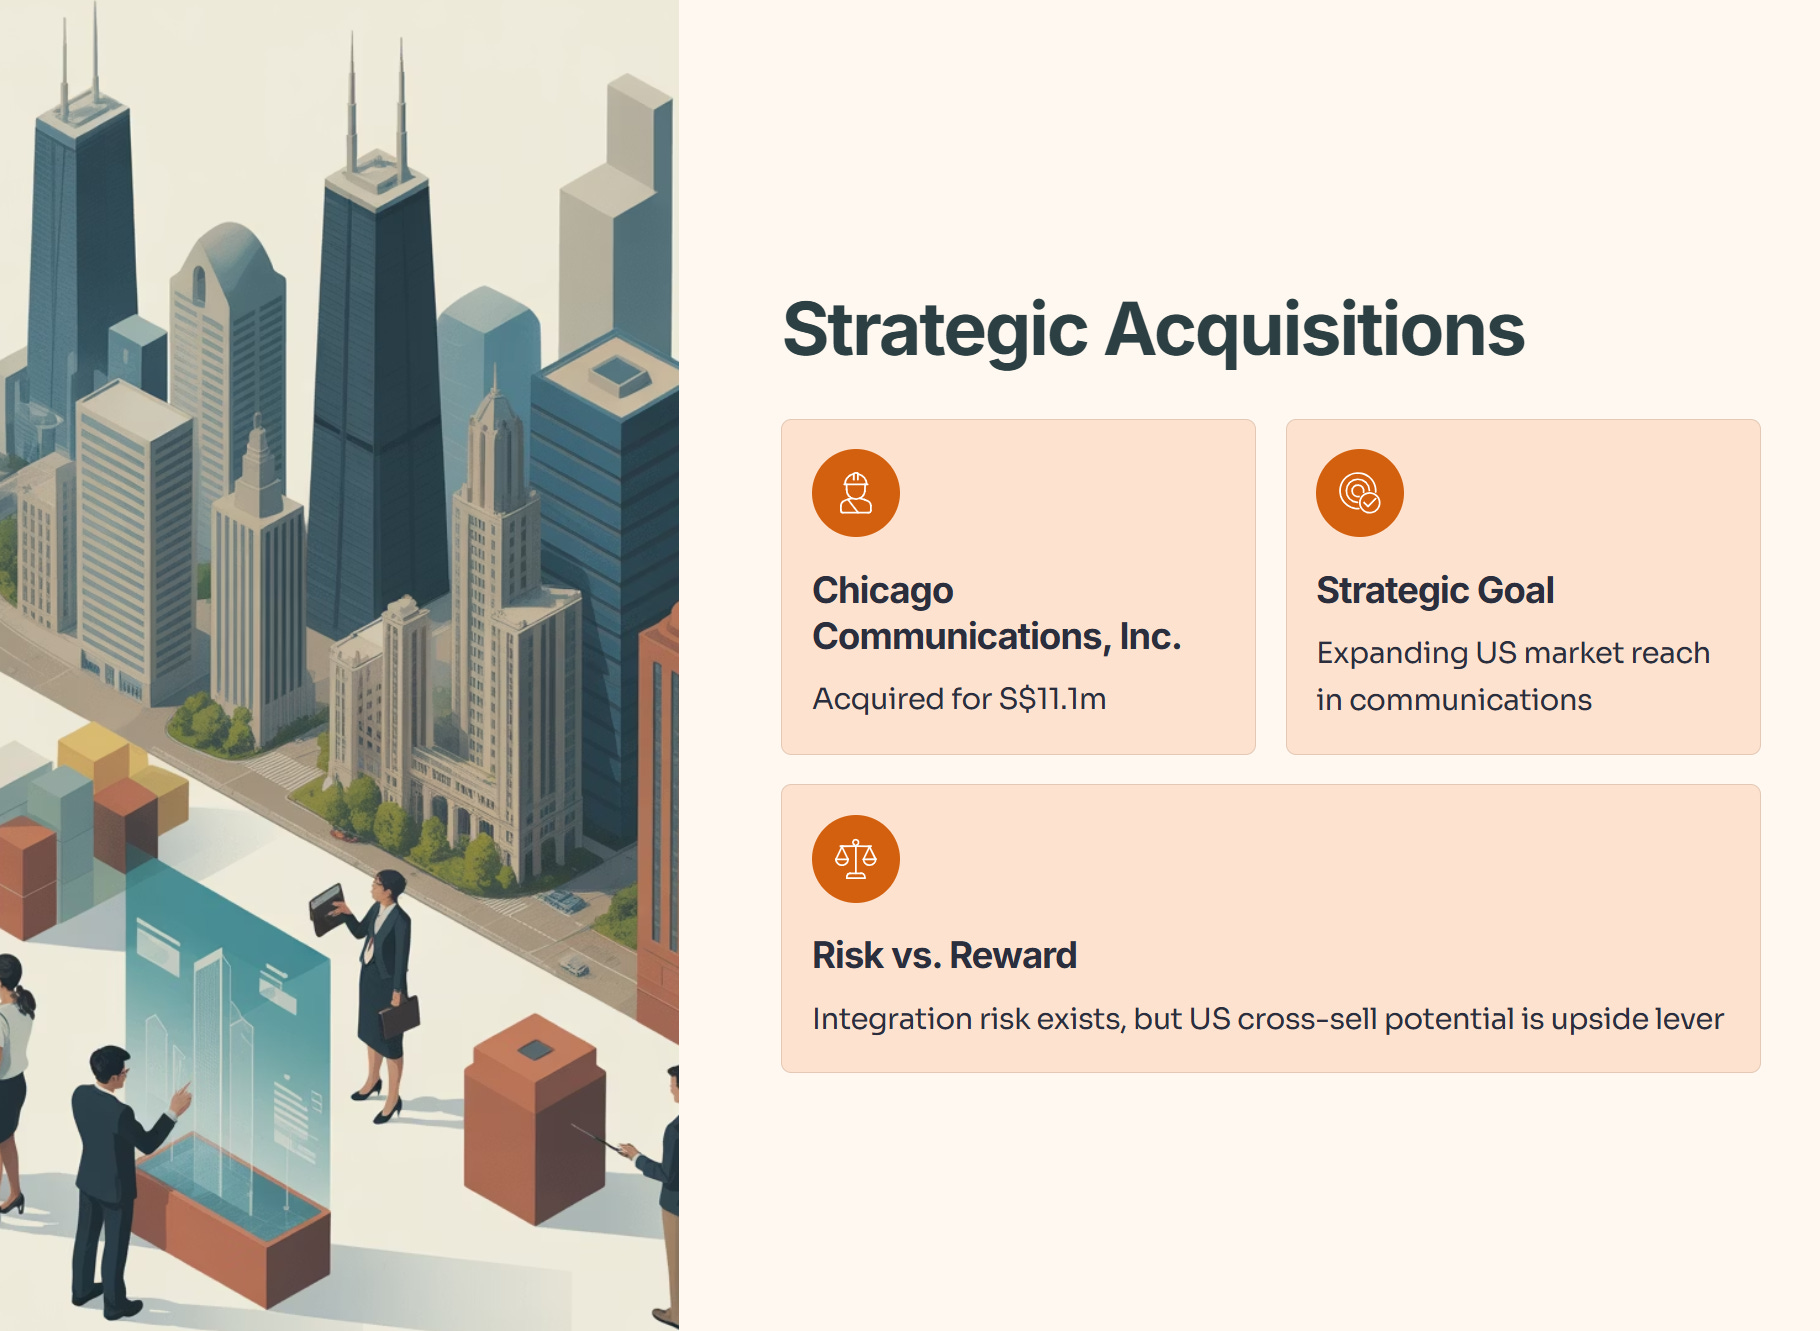
Page 7: Strategic Acquisitions
Chicago Communications, Inc. acquired for S$11.1m, expanding US market reach in communications. Integration risk exists, but potential US cross-sell is an upside lever.
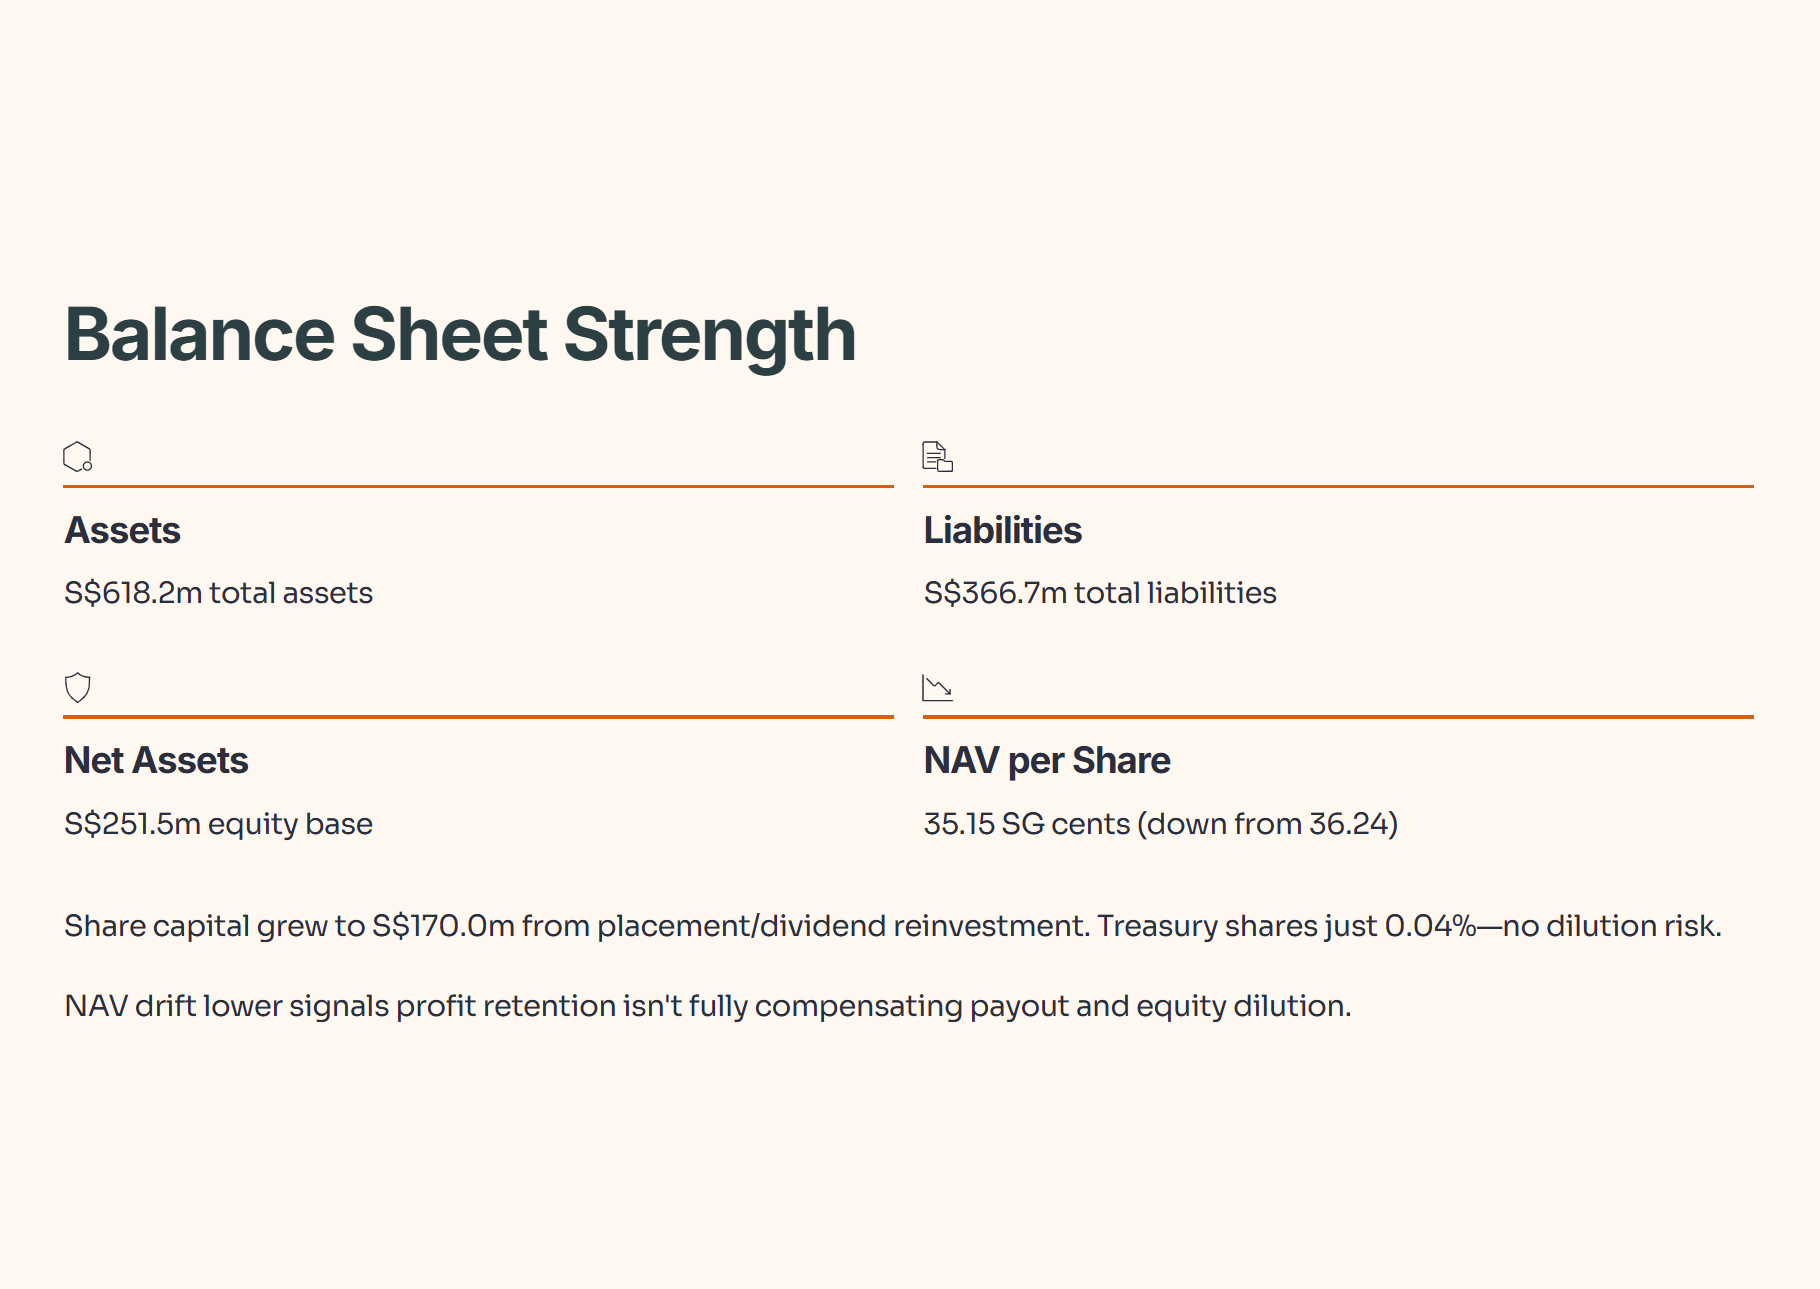
Page 8: Balance Sheet Strength
Assets: S$618.2m; Liabilities: S$366.7m; Net assets: S$251.5m
Share capital grew (S$170.0m from share placement/dividend reinvestment).
Treasury shares represent just 0.04%—no dilution risk for retail holders. Net asset value per share: 35.15 SG cents, down from 36.24 at the end of 2024.
NAV drift lower is not alarming, but signals profit retention isn’t fully compensating payout and equity dilution.
Page 9: Intangibles and Write-Offs
Intangible assets total S$111.1m, mainly goodwill from prior and new acquisitions.
Write-offs of technical know-how and some plant-intensive assets (linked to the Automation segment) bit into profits.
