

CapitaLand Ascendas REIT 3Q 2025: Can Singapore’s Largest Industrial REIT Weather the Storm of Rising Leverage and Slowing Occupancy?
Your portfolio needs stability and growth—but is CLAR delivering both, or masking pressure with shiny acquisitions? This deep dive breaks down every slide to show you what analysts won’t say.

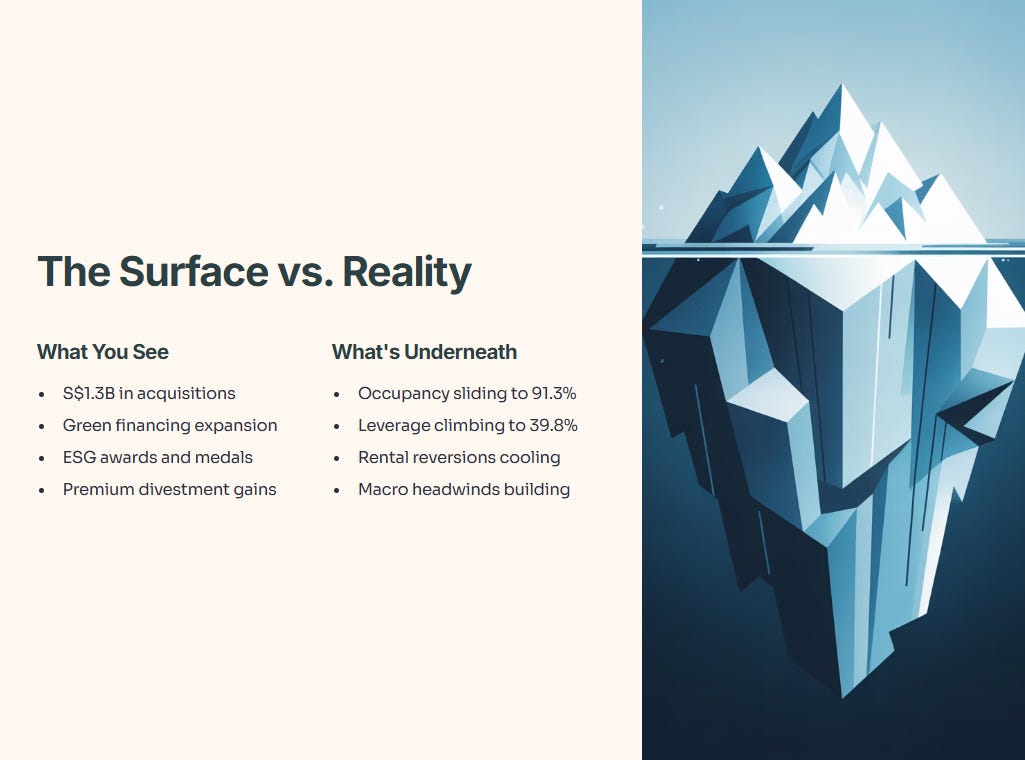
Singapore investors hunting for industrial REIT exposure face a tricky question right now. CapitaLand Ascendas REIT just dropped its 3Q 2025 business update, and on the surface it looks impressive—S$1.3 billion in acquisitions, green financing, ESG medals. But dig past the headlines and you see occupancy sliding, leverage climbing to 39.8%, and rental reversions cooling from earlier peaks. Is this business-as-usual market adjustment, or a signal that CLAR’s best days are behind it?
What follows is a slide-by-slide dissection of CLAR’s 69-page presentation released October 31, 2025. I’ll walk you through the acquisitions that boosted asset value, the divestments recycling capital at premiums, the leverage creep you need to watch, portfolio occupancy dips in key markets, rental reversion trends, debt maturity, currency hedging, sustainability wins, and what it all means for your DPU and capital growth. By the end you’ll have a clear Buy, Hold, or Sell call grounded in facts, not hype.
In This Premium Deep-Dive, You Will Learn:

Why CLAR’s S$1.3B acquisition spree is a double-edged sword for its DPU.

The one “Red Flag” in their Capital Management (Leverage) that I am watching closely.

A deep-dive into the “mixed signals” in their Asset Management: why are occupancies dipping while rental reversions are still strong?

My final Buy, Hold, or Sell call and what price I’m waiting for.
Slide 1-3: Cover, Agenda, and Disclaimers
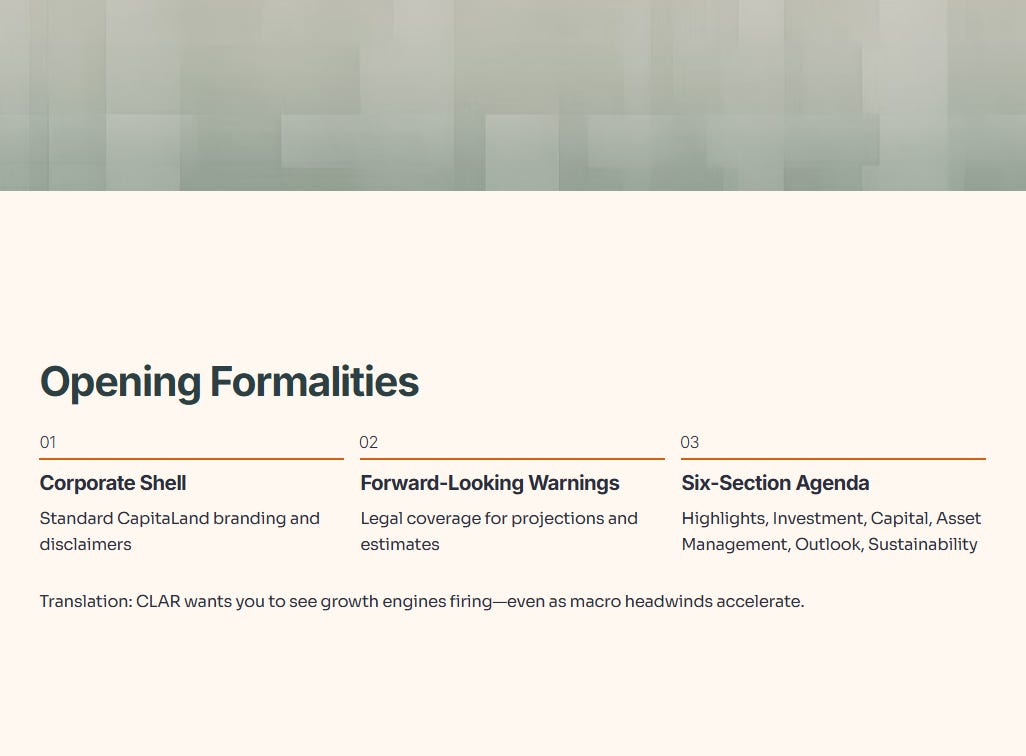
The report opens with the standard corporate shell—CapitaLand branding, a snapshot of 1 Science Park Drive, and the usual forward-looking statement warnings. Nothing actionable here, but it sets the tone: this is a REIT running hard to stay ahead. The agenda promises six sections—Highlights, Investment Management, Capital Management, Asset Management, Market Outlook, and Portfolio Resilience & Sustainability. Translation: CLAR wants you to see growth engines firing on all cylinders, even as macro headwinds pick up speed.
Slide 4-6: 3Q 2025 Highlights—Big Numbers, Bigger Questions
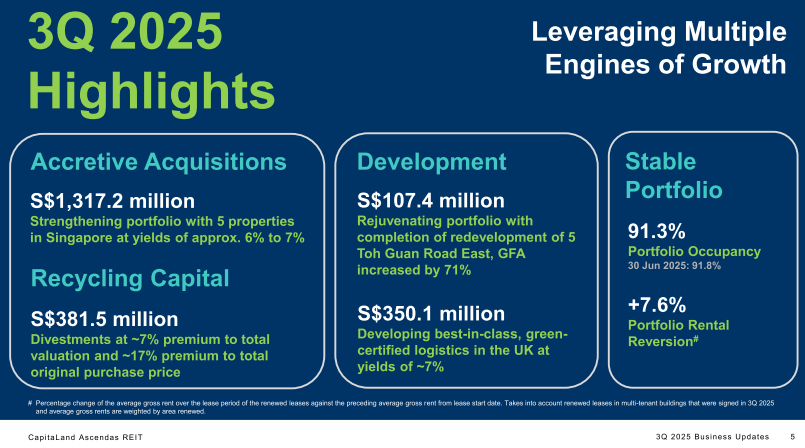
Here’s where the fireworks start. CLAR announces it deployed S$1,317.2 million across five properties in Singapore at yields of roughly 6% to 7%. That’s aggressive capital deployment in a quarter when most REITs are sitting tight. The portfolio occupancy stands at 91.3%, down 0.5 percentage points from 91.8% in June 2025. Rental reversion clocked in at +7.6%, still healthy but cooling from the +8.0% posted last quarter.
Table 1: 3Q 2025 Key Highlights
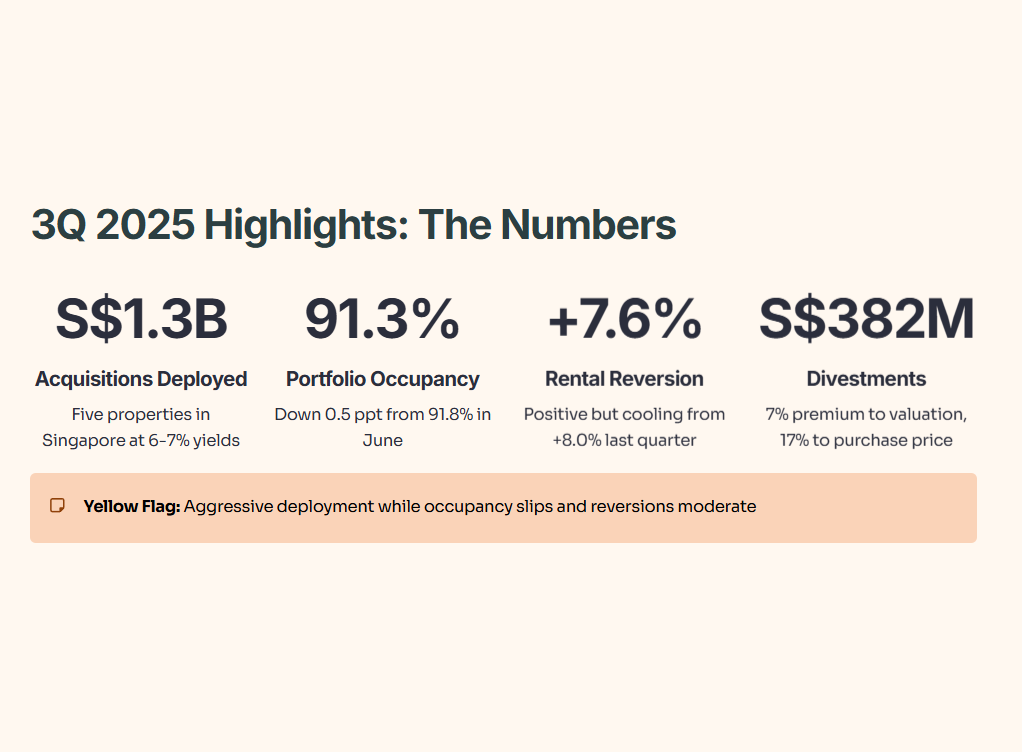
This table shows CLAR is buying and building fast. The divestment premium is real—selling old assets at 7% above valuation frees up capital for newer, higher-yielding properties. But occupancy slipped, and that’s a yellow flag. Why? Because industrial markets across Singapore, the US, and Australia are all feeling macro pressure—tariff uncertainty, slower manufacturing, cautious tenant expansion.
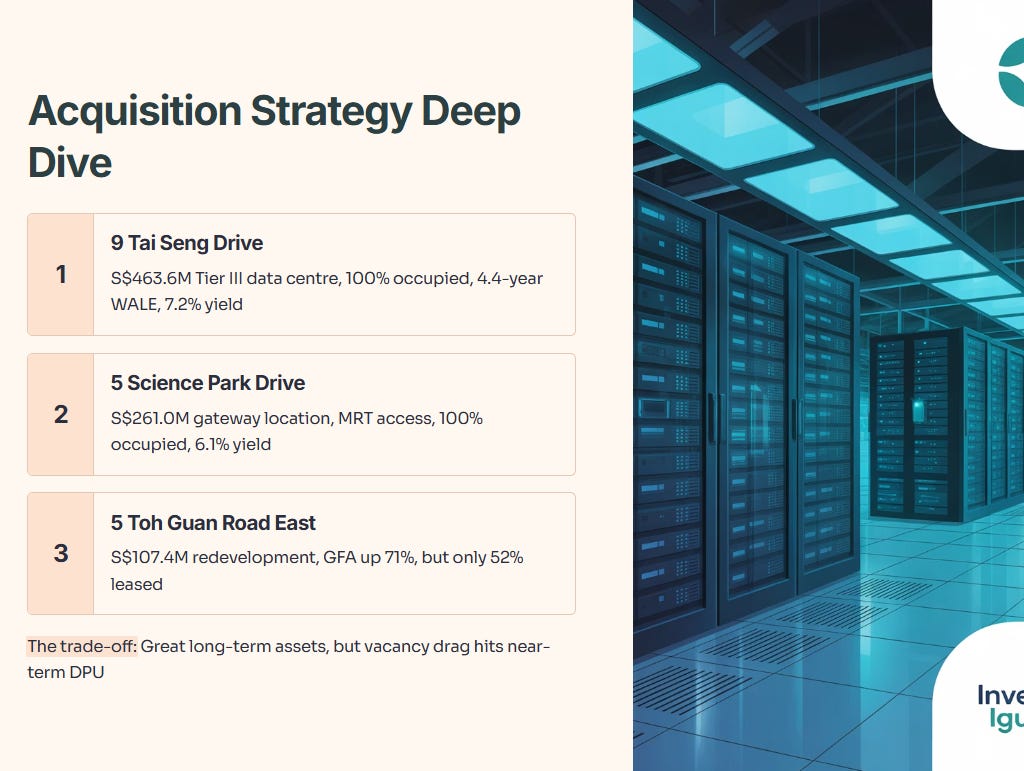
From a Singapore investor’s lens, the acquisition strategy makes sense if you believe industrial and data centre demand will stay robust. Data centres are the crown jewel here—9 Tai Seng Drive is a Tier III colocation facility acquired for S$463.6 million, and it’s fully occupied with a 4.4-year weighted average lease expiry (WALE). That’s the kind of sticky, high-quality income stream that justifies paying up. But the redevelopment at 5 Toh Guan Road East is only 52% occupied (with another 13% in advanced negotiations). That’s immediate dilution to near-term cash flow until leasing picks up.
Think of it like buying a condo in a new launch—great long-term potential, but you eat vacancy risk for a few quarters. If you’re counting on stable DPU, this kind of deployment can sting in the short run.
Slide 7-14: Investment Management—Buying, Building, and Selling
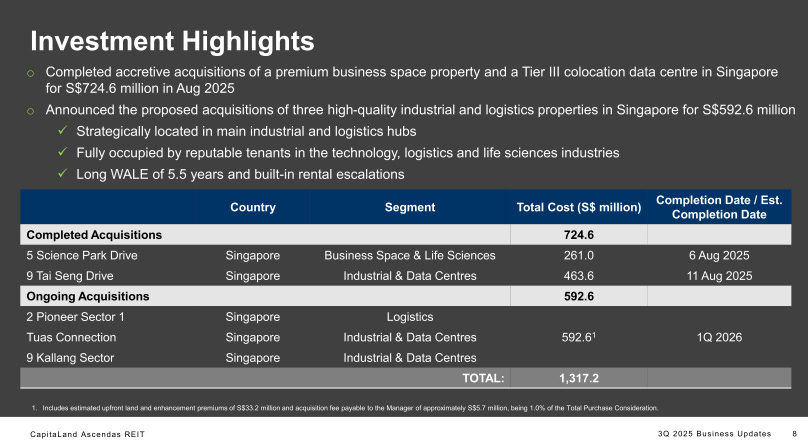
CLAR completed two major acquisitions in August 2025: 5 Science Park Drive for S$261.0 million and 9 Tai Seng Drive for S$463.6 million. Combined, that’s S$724.6 million deployed at initial NPI yields of 6.1% and 7.2% respectively (post-transaction costs, 5.7% and 7.1%). Both are premium assets—5 Science Park Drive sits at the gateway of Singapore Science Park 1 with direct access to Kent Ridge MRT, while 9 Tai Seng Drive is a modern data centre with dual power systems and high floor loading capacity.
On top of that, CLAR announced three ongoing acquisitions totalling S$592.6 million—2 Pioneer Sector 1, Tuas Connection, and 9 Kallang Sector—all in Singapore, all fully occupied by technology, logistics, and life sciences tenants, and all boasting a combined WALE of 5.5 years with built-in rental escalations. Expected completion is 1Q 2026.
Table 2: Completed and Ongoing Acquisitions
This is textbook accretive REIT management—buying quality assets at yields above your cost of debt (3.6%) and weighted average cost of capital. The data centre play is particularly smart. Singapore is a Tier 1 data centre hub in APAC, and colocation demand is booming as cloud adoption and AI workloads explode. The 9 Tai Seng Drive acquisition taps into that structural tailwind.
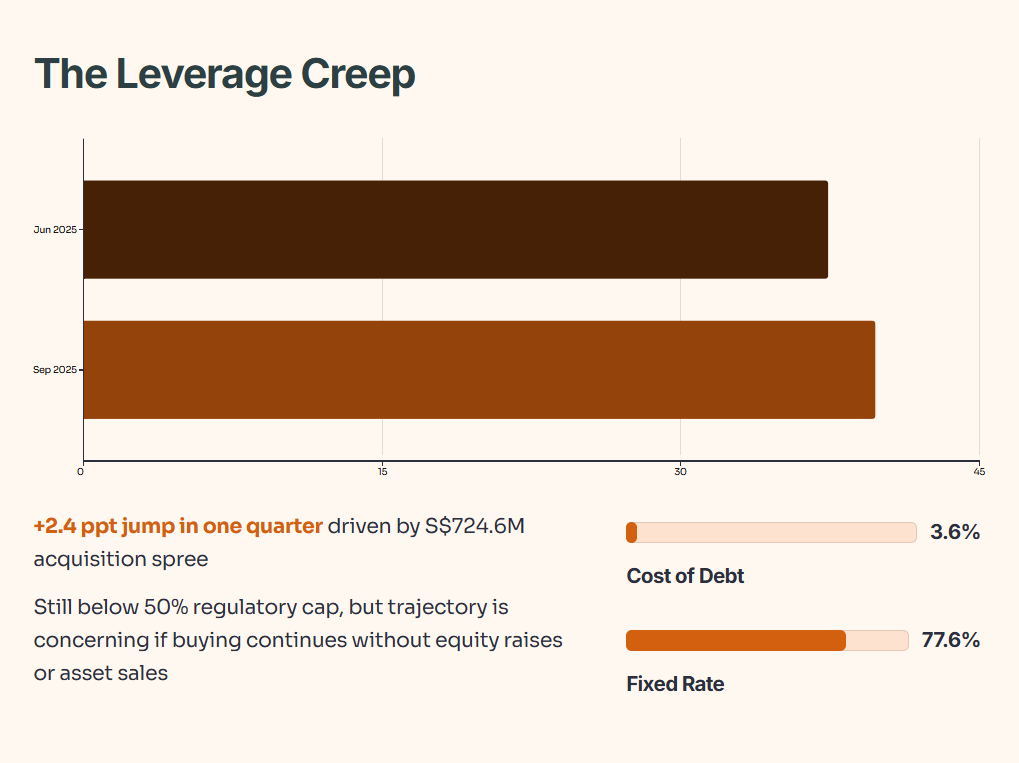
But here’s the risk: CLAR is levering up to fund this. Aggregate leverage jumped from 37.4% in June to 39.8% in September. That’s still comfortably below the 50% regulatory cap, but it’s heading in the wrong direction if interest rates stay elevated or if asset values soften. More on that in the Capital Management section.
CLAR also completed the redevelopment of 5 Toh Guan Road East, turning it into a six-storey ramp-up logistics property with GFA expanded by 71% to 50,920 sqm for S$107.4 million. Features include dedicated loading bays, high floor capacity, cold storage power provision, and 12-metre ceilings—state-of-the-art logistics specs. The catch? Only 52% leased as of end-September, with another 13% in advanced negotiations. So you’ve got a brand-new asset sitting partially empty for now.
This is the trade-off with redevelopment: you create value by unlocking unutilised plot ratio, but you absorb vacancy drag until tenants move in. If you’re a CPF/SRS investor relying on quarterly distributions, this kind of portfolio reshuffling can create DPU volatility.
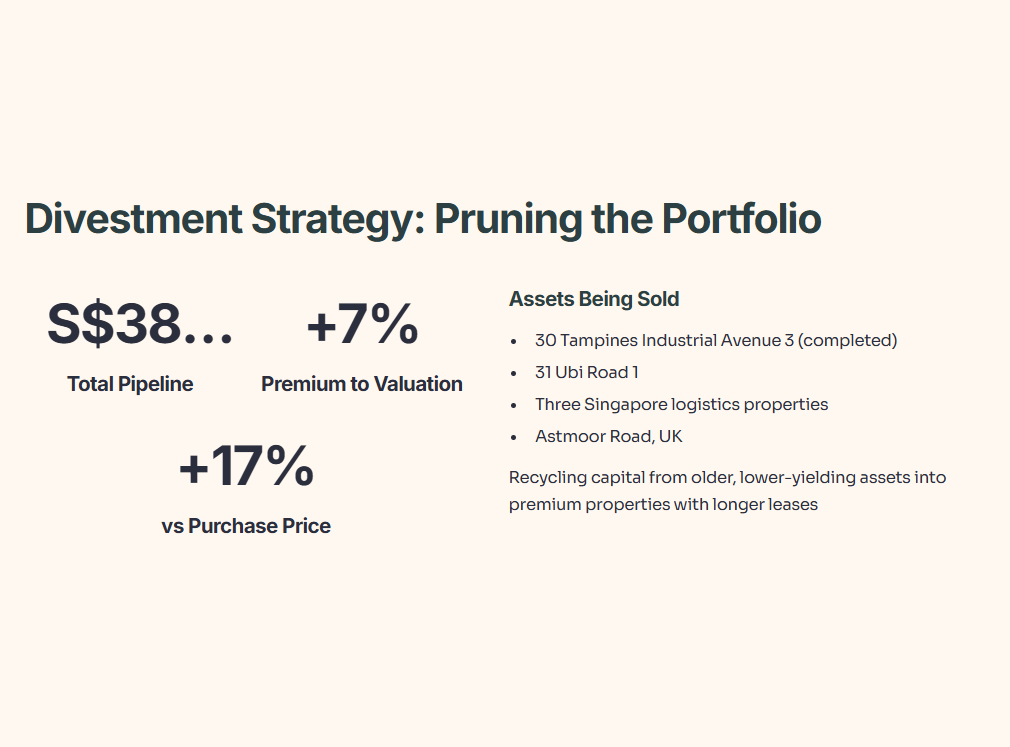
On the divestment front, CLAR is pruning older, lower-yielding assets. It completed the sale of 30 Tampines Industrial Avenue 3 for S$23.0 million at a 5% premium to valuation, and has ongoing divestments totalling S$358.5 million—including 31 Ubi Road 1, three logistics properties in Singapore, and Astmoor Road in the UK. Total divestment pipeline: S$381.5 million at roughly 7% above total valuation and 17% above original purchase price.
Think of this as selling your old HDB flat at a profit to upgrade to a newer condo. The proceeds get recycled into higher-quality, better-located properties with longer lease tenures and modern specs. It’s smart capital allocation, but it also signals that some of CLAR’s legacy assets are hitting their ceiling in terms of rental growth and value appreciation.
Slide 15-19: Capital Management—Leverage, Debt Cost, and Green Financing
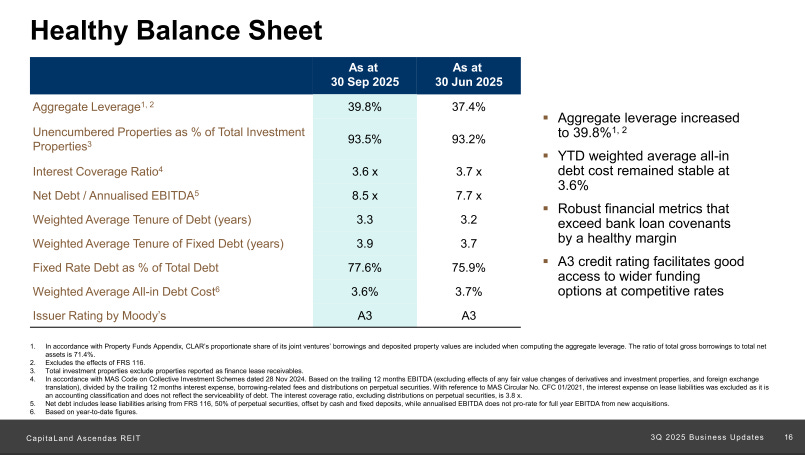
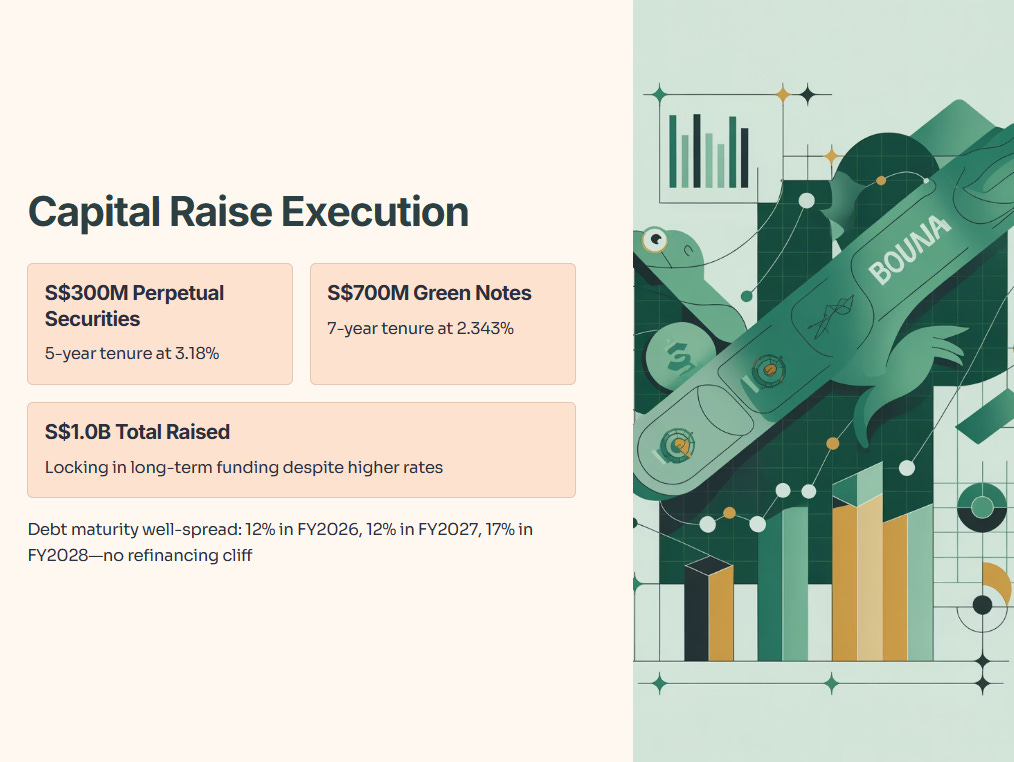
Aggregate leverage climbed to 39.8% as of September 30, 2025, up from 37.4% in June. That’s a 2.4 percentage point jump in one quarter, driven by the S$724.6 million acquisition spree. CLAR raised S$1.0 billion in capital during the quarter—S$300 million in 5-year perpetual securities at 3.18% and S$700 million in 7-year green notes at 2.343%. That’s impressive execution, locking in relatively cheap long-term funding despite the higher rate environment.
Table 3: Capital Management Metrics
The cost of debt edged down from 3.7% to 3.6%, thanks to refinancing some maturing loans at lower spreads. Fixed-rate debt now covers 77.6% of total borrowings, up from 75.9%, which insulates CLAR from rate volatility. The weighted average debt tenure stretched slightly to 3.3 years. Interest coverage ratio dipped to 3.6x from 3.7x, still healthy but worth monitoring.
Here’s the concern: if leverage keeps climbing toward 45% or 50%, CLAR’s financial flexibility shrinks. Higher leverage means less room to borrow for future acquisitions without issuing equity (which dilutes existing unitholders) or selling assets (which can be timing-dependent). And if property valuations drop due to higher cap rates or weaker tenant demand, the leverage ratio automatically worsens.
From a Singapore investor’s standpoint, you want your REIT manager to balance growth with prudence. CLAR is clearly in growth mode—deploying S$1.3 billion in a single quarter is aggressive. That’s fine if the acquisitions generate strong returns, but if occupancy wobbles or rental reversions turn negative, the downside risk magnifies.
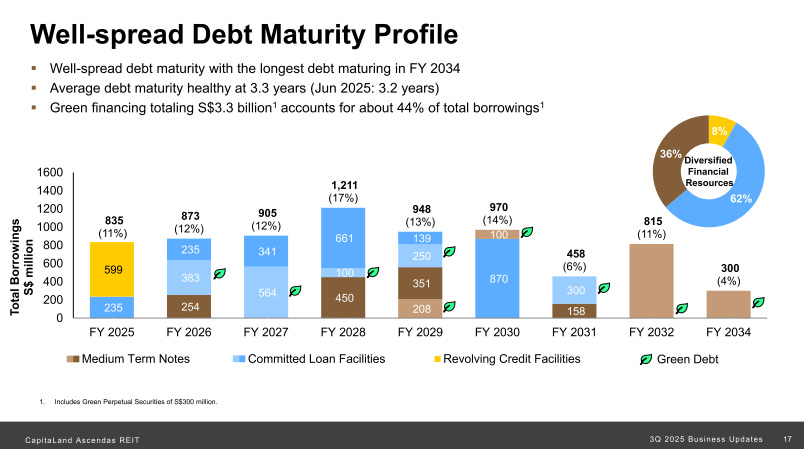
The debt maturity profile is well-spread, with no single year facing a massive refinancing cliff. About S$873 million (12% of total debt) matures in FY 2026, followed by S$905 million (12%) in FY 2027 and S$1,211 million (17%) in FY 2028. That’s manageable, assuming credit markets stay open and CLAR’s A3 Moody’s rating holds.
Green financing now totals S$3.3 billion, accounting for 44% of total borrowings. That’s a nice-to-have from an ESG angle, and it can unlock slightly cheaper funding from sustainability-linked investors. But it doesn’t fundamentally change the cash flow equation—green debt still has to be serviced from operating income.
CLAR’s natural hedge on foreign currency exposure is strong: 70% for Australia, 78% for the US, 78% for the UK, and 100% for Europe. That means most overseas assets are funded with local currency debt, minimising FX translation risk. This is textbook REIT risk management—match your assets and liabilities by currency to avoid getting whipsawed by volatile exchange rates.
Slide 20-33: Asset Management—Occupancy, Rental Reversions, and Lease Expiry
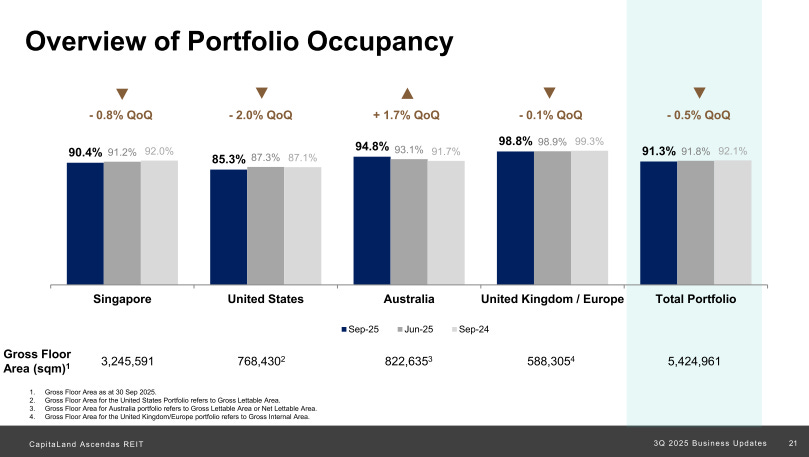
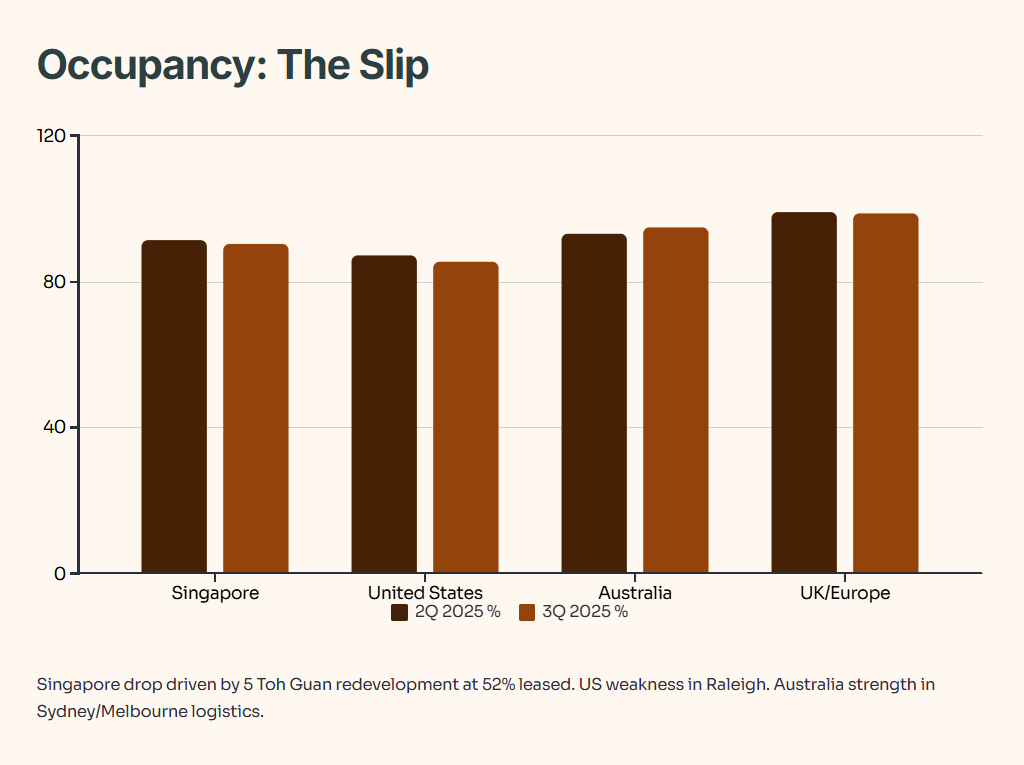
Portfolio occupancy dropped to 91.3% from 91.8% the previous quarter. Singapore occupancy fell from 91.2% to 90.4%, dragged down by the 5 Toh Guan Road East redevelopment hitting the books at only 52% leased. Excluding that property, Singapore occupancy would have held steady at 91.1%. US occupancy slipped from 87.3% to 85.3%, mainly due to weaker leasing in Raleigh. Australia jumped from 93.1% to 94.8%, driven by strong logistics leasing in Sydney and Melbourne. UK/Europe stayed rock-solid at 98.8%.
Table 4: Portfolio Occupancy by Geography
The rental reversion story is still positive but cooling. Singapore posted +8.5% reversion in 3Q 2025, with business space at +5.9%, logistics at +24.5%, and industrial/data centres at +11.4%. The US clocked +11.1%, Australia had no significant renewals, and UK/Europe saw a slight -2.5% reversion in data centres. Overall portfolio reversion: +7.6%, down from +8.0% in 2Q 2025.
Table 5: Rental Reversions by Segment (3Q 2025)
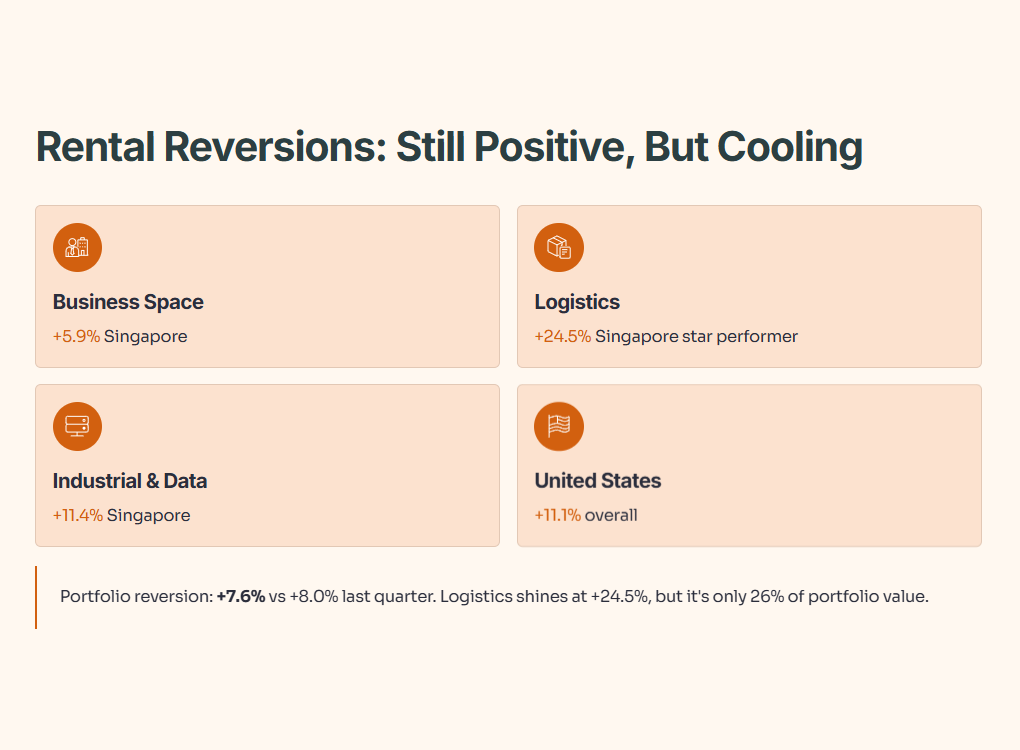
For Singaporean investors, the logistics segment is the star—+24.5% reversion is exceptional. That reflects tight supply and strong e-commerce demand. But remember, logistics only makes up 26% of CLAR’s portfolio value. Business space and industrial/data centres dominate, and those segments are seeing more moderate growth.
The weighted average lease expiry (WALE) sits at 3.6 years for the total portfolio, with Singapore at 3.3 years, the US at 4.6 years, Australia at 3.8 years, and UK/Europe at 5.4 years. Only 4.5% of gross rental income expires in the remainder of FY 2025, and most of that is in Singapore (91.2% of expiring leases). The lease expiry profile is well-staggered through FY 2029 and beyond, so there’s no immediate cliff risk.
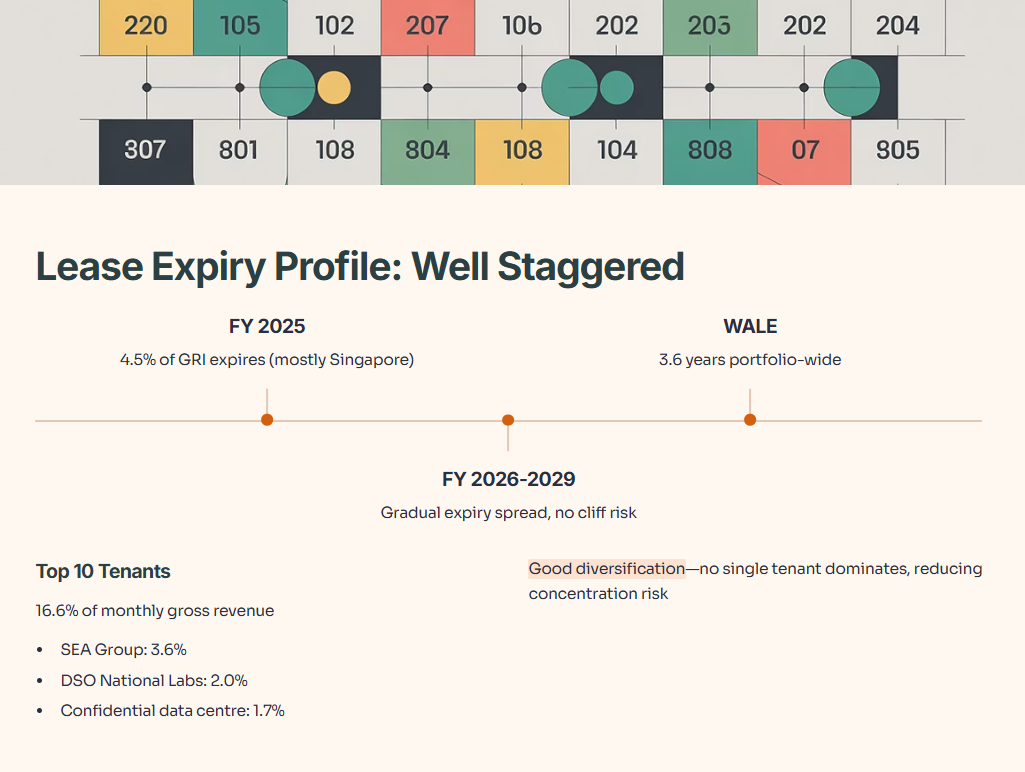
Top 10 tenants account for 16.6% of monthly gross revenue, with SEA Group (parent of Shopee) at 3.6%, DSO National Laboratories at 2.0%, and a confidential data centre tenant at 1.7%. That’s good diversification—no single tenant dominates, which reduces concentration risk if any one player hits trouble.
Sources of new demand in 3Q 2025 skewed heavily toward electronics (49.1%), lifestyle/retail/consumer products (11.8%), distributors/trading (11.4%), and logistics/supply chain (8.6%) in Singapore. Overseas, logistics and supply chain dominated at 78.1%. This tells you CLAR’s tenant base is riding secular tailwinds in e-commerce, data, and advanced manufacturing.
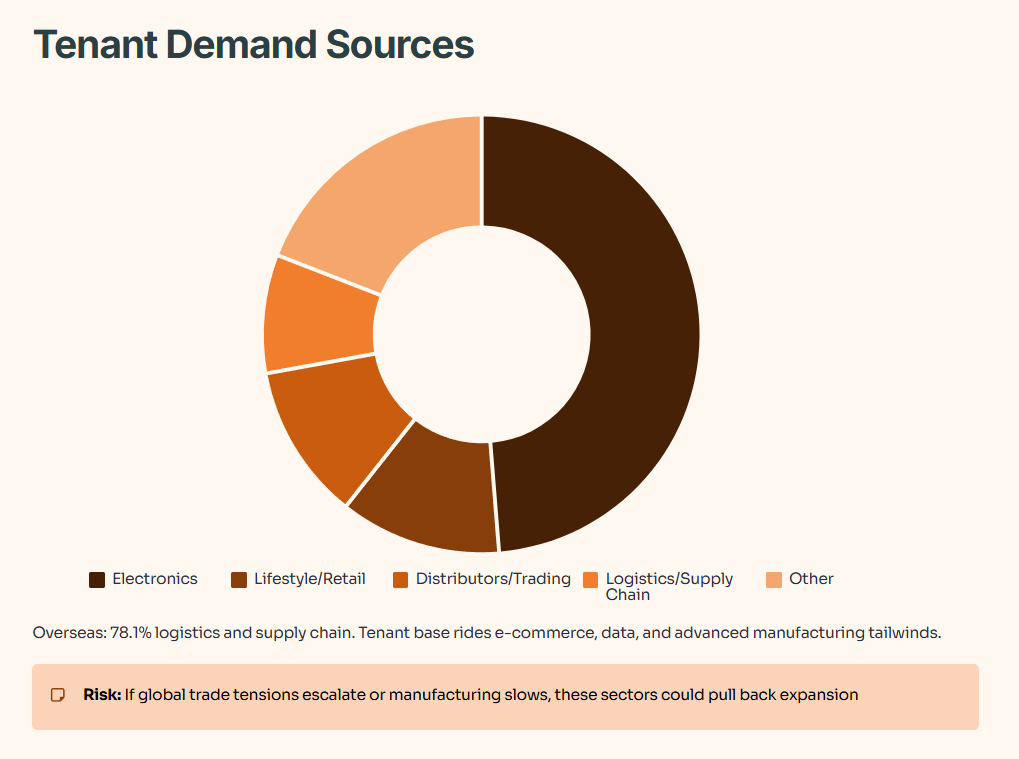
But here’s the rub: if global trade tensions escalate or manufacturing activity slows, those tenant segments could pull back on expansion. The JTC statistics show island-wide industrial occupancy at 88.8% as of June 2025, down 0.2 ppt from the prior quarter. New industrial supply is coming—3.07 million sqm over the next five years, which is 5.7% of existing stock, though 79% is pre-committed. That’s a mixed bag. Pre-commitment is good, but it also means competition for tenants is heating up.
Slide 34-40: Market Outlook—Macro Headwinds and Regional Divergence
The macro section is blunt. Global GDP growth is projected to slow from 3.3% in 2024 to 3.2% in 2025 and 3.1% in 2026, according to the IMF. Trade tensions, protectionism, and policy uncertainty loom large. Singapore’s GDP grew 2.9% year-on-year in 3Q 2025, moderating from 4.5% in 2Q 2025. Core inflation edged up to 0.4% in September 2025. The Monetary Authority of Singapore (MAS) held policy steady in October, noting that growth has been stronger than expected but caution remains warranted.
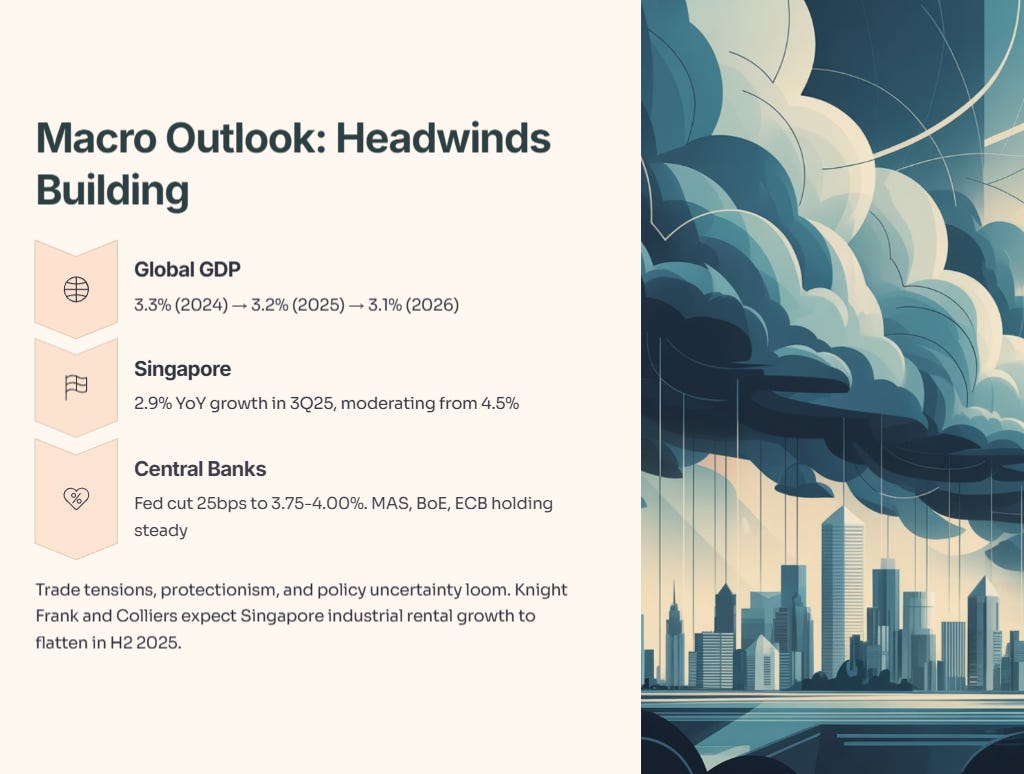
For the US, GDP growth is estimated at 2.0% in 2025. The Federal Reserve cut rates by 25 bps to 3.75%-4.00% in October 2025, signalling a gradual easing cycle. Australia’s economy grew 1.8% in 2Q 2025, with the Reserve Bank holding rates at 3.60% after a prior cut. The UK economy expanded 0.9% in 2Q 2025, with the Bank of England maintaining rates at 4% after an August cut. The Eurozone grew 1.5% in 2Q 2025, with the ECB holding rates steady since June.
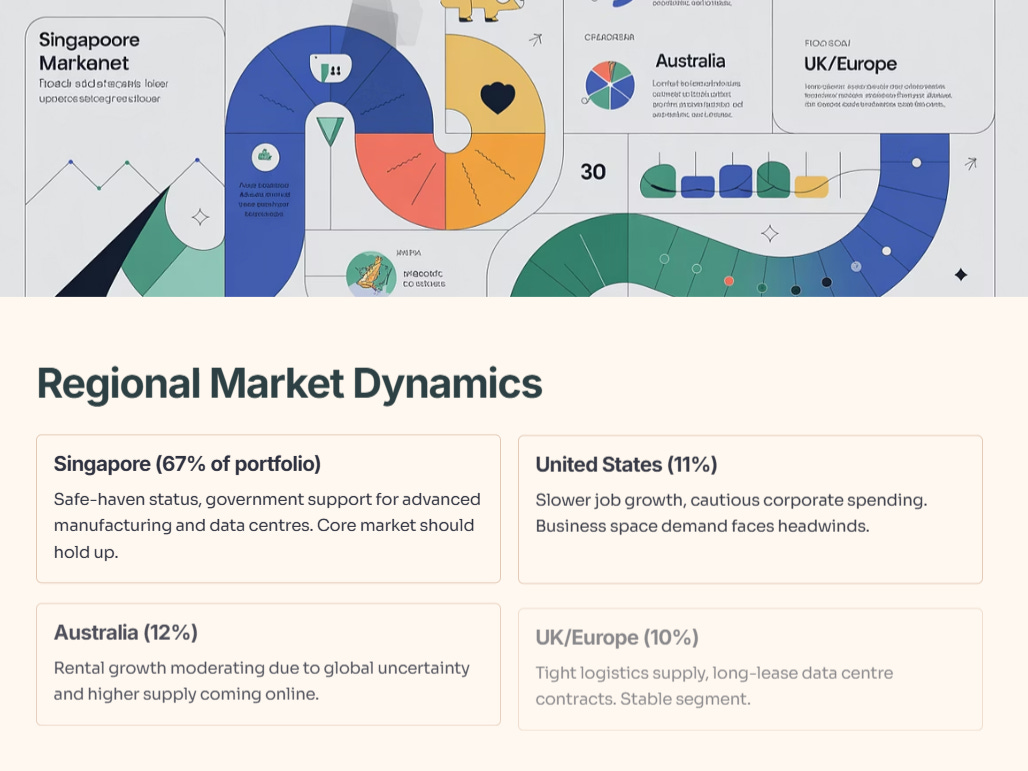
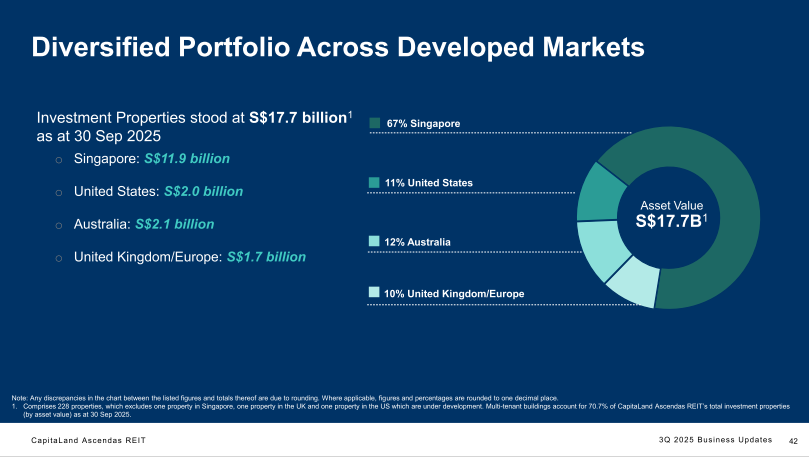
What does this mean for CLAR? Singapore remains the anchor—67% of portfolio value. As long as Singapore’s economy stays resilient and foreign investment flows continue (driven by safe-haven status and government support for advanced manufacturing and data centres), CLAR’s core market should hold up. The US exposure (11% of portfolio) faces headwinds from slower job growth and cautious corporate spending, which could weigh on business space demand. Australia (12%) is seeing rental growth moderate due to global uncertainty and higher supply. UK/Europe (10%) benefits from tight logistics supply and long-lease data centre contracts, so that segment should stay stable.
Knight Frank and Colliers both note that Singapore industrial rental growth is likely to flatten in H2 2025 due to weaker global manufacturing and higher supply. That’s consistent with CLAR’s own experience—rental reversions are still positive but decelerating. If macro conditions worsen, you could see reversions turn neutral or even negative in 2026.
From an investor’s perspective, this is the environment where REIT quality separates winners from losers. High-quality assets with long WALEs, diversified tenant bases, and sticky demand (like data centres) will outperform older, smaller properties with short leases and exposure to cyclical industries.
Slide 41-50: Portfolio Resilience & Sustainability—ESG Wins and Green Credentials
CLAR’s ESG credentials are strong. Green-certified properties now account for 61% of portfolio GFA, up from 49% in June 2025. That’s a net increase of 26 certifications in 3Q 2025 alone, driven by targeted acquisitions, redevelopment, and greening of existing properties. The REIT holds a 4-star GRESB rating, an ‘A’ public disclosure rating for the sixth consecutive year, an MSCI ESG ‘AA’ rating for the third straight year, and came in 2nd place in the Singapore Governance & Transparency Index for REITs and Business Trusts.
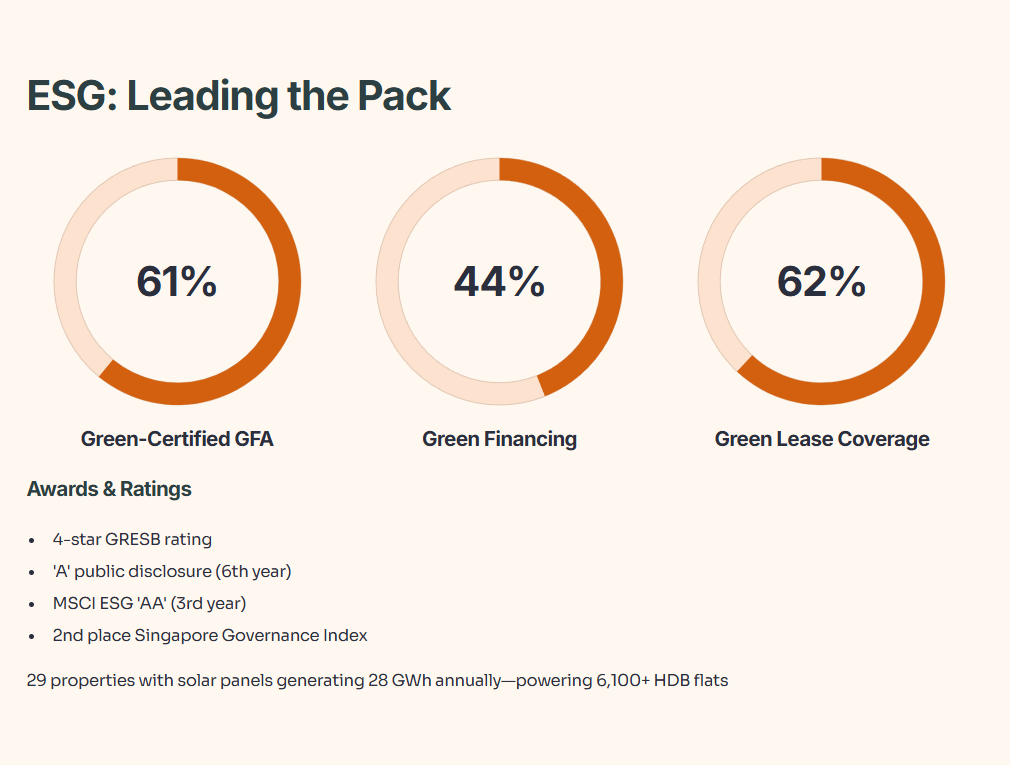
Green financing totals S$3.3 billion, or 44% of total borrowings. Twenty-nine Singapore properties have solar panels installed, projected to generate 28 GWh annually—enough to power over 6,100 four-room HDB flats. Green lease coverage hit 62% of net lettable area, up 8 ppt from 2024.
Why does this matter? Because ESG is no longer a nice-to-have—it’s a competitive necessity. Tenants increasingly demand green-certified space, investors screen portfolios for climate risk, and lenders offer better terms for sustainable financing. CLAR is ahead of the curve here, which should support long-term tenant retention and lower capital costs.
But ESG doesn’t pay the rent. What matters for your DPU is occupancy, rental growth, and cost control. The green credentials help on the margin, but they won’t save you if macro demand collapses or if CLAR overpays for acquisitions.
Slide 51-69: Appendix—Supply Pipeline, Comparable Rents, and Transaction Details
The appendix dives into Singapore industrial supply, market rents, and granular details on acquisitions and divestments. Key takeaway: business park rents in city fringe locations are around S$6.10 psf/month, while rest-of-island business parks are S$3.55 psf/month. High-spec industrial is S$3.53 psf/month, logistics is S$1.90 psf/month, and light industrial is S$1.81 psf/month. Those benchmarks help you assess whether CLAR’s rental reversions are sustainable or inflated.
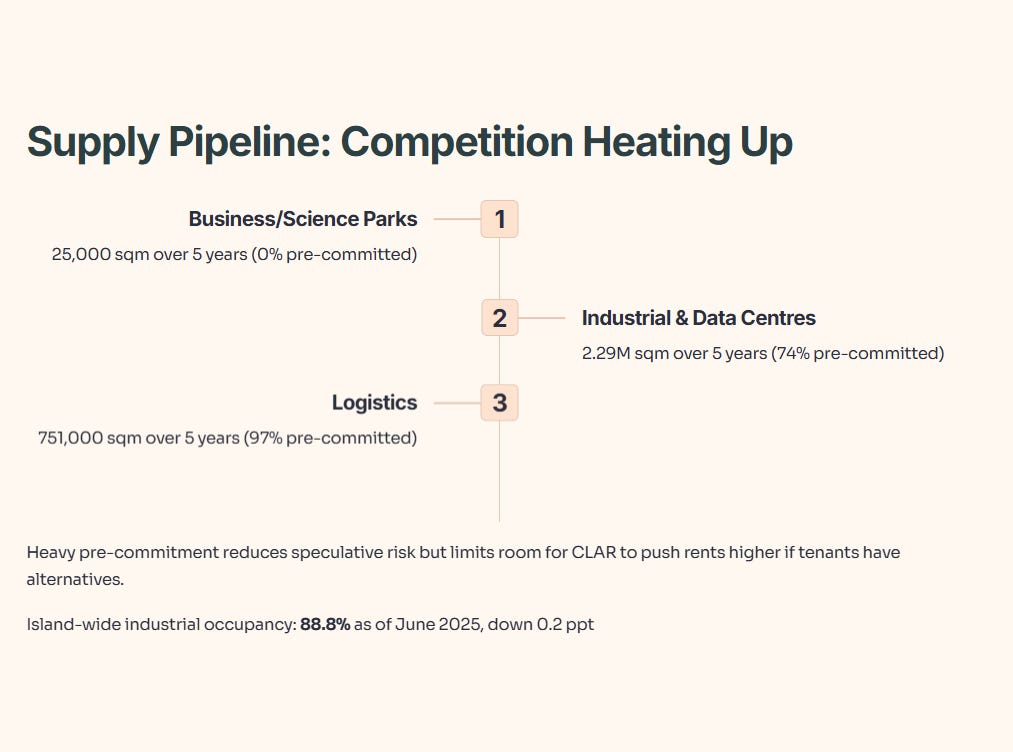
New supply in Singapore over the next five years: 25,000 sqm of business/science park space (0% pre-committed), 2.29 million sqm of industrial/data centres (74% pre-committed), and 751,000 sqm of logistics (97% pre-committed). The heavy pre-commitment in logistics and industrial suggests limited speculative risk, but it also means less room for CLAR to push rents higher if tenants have alternatives.
Iggy’s Assessment: Buy, Hold, or Sell?
