

CapitaLand Integrated Commercial Trust Q3 2025: Is This the Quiet Winner SGX Investors Are Sleeping On?
Can Singapore’s largest REIT sustain growth with 97% occupancy, while managing S$10.1 billion in debt and navigating a slowing economy?
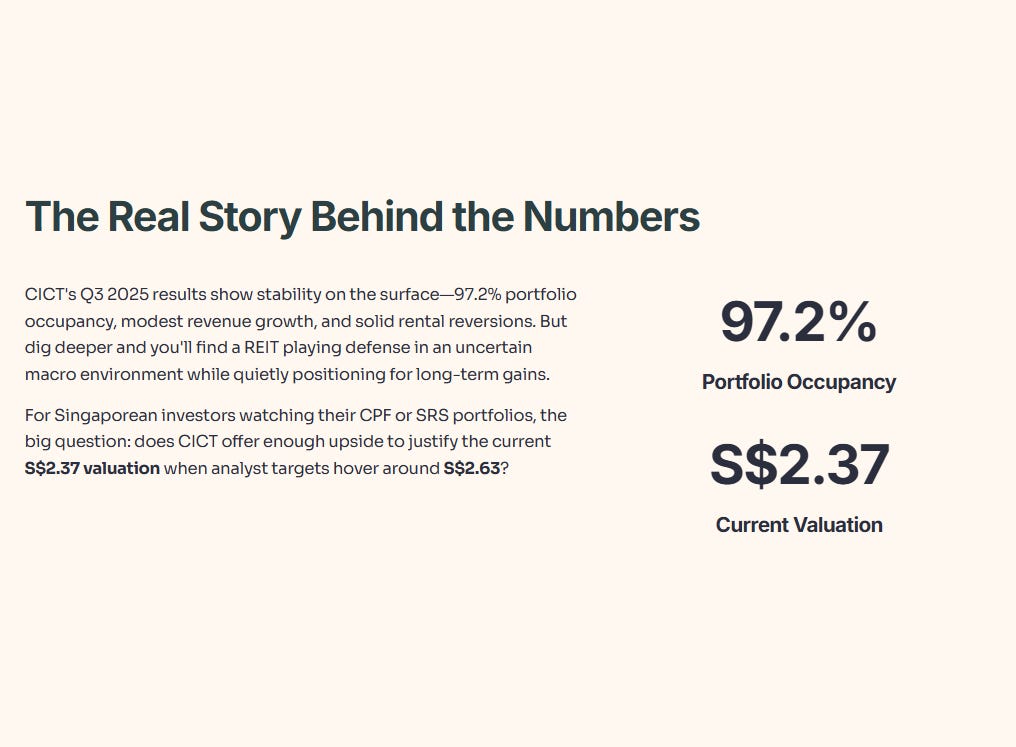
Here’s the truth about CICT’s Q3 2025 results. The numbers look stable on the surface—97.2% portfolio occupancy, modest revenue growth, and solid rental reversions. But when you dig deeper, you’ll spot the real story: this REIT is playing defense in an uncertain macro environment while quietly positioning for long-term gains through strategic acquisitions and asset upgrades.
For Singaporean investors watching their CPF or SRS portfolios, the big question isn’t whether CICT is safe (it is), but whether it offers enough upside to justify the current S$2.37 valuation when analyst targets hover around S$2.63.
In this deep dive, I’ll break down CICT’s Q3 2025 update, focusing on the core portfolio’s strength, the balance sheet’s constraints, the future growth levers, and what it all means for your investment decision.
In This Article:

• 1. The Core Portfolio: “Fortress Singapore” is Stable, But Slow
• Retail Portfolio
• Office Portfolio
• 2. The Balance Sheet: Prudent... or Constrained?
• 3. The Future Growth Levers: AEIs, Acquisitions & Overseas
• 1. Asset Enhancement Initiatives (AEIs) (Slide 5-6)
• 2. Full-Year Acquisition Impact (Slide 3-4, 21-23)
• 3. The Overseas Question (Slide 12, 17-20)
• Investment Verdict & “So What” for Your CPF/SRS
• What CICT Gets Right
• What Concerns Me
• My Stance: Hold / Selective Buy on Dips
• Portfolio Positioning for CPF and SRS Investors
• CPF-OA
• SRS
• Final Thoughts
1. The Core Portfolio: “Fortress Singapore” is Stable, But Slow
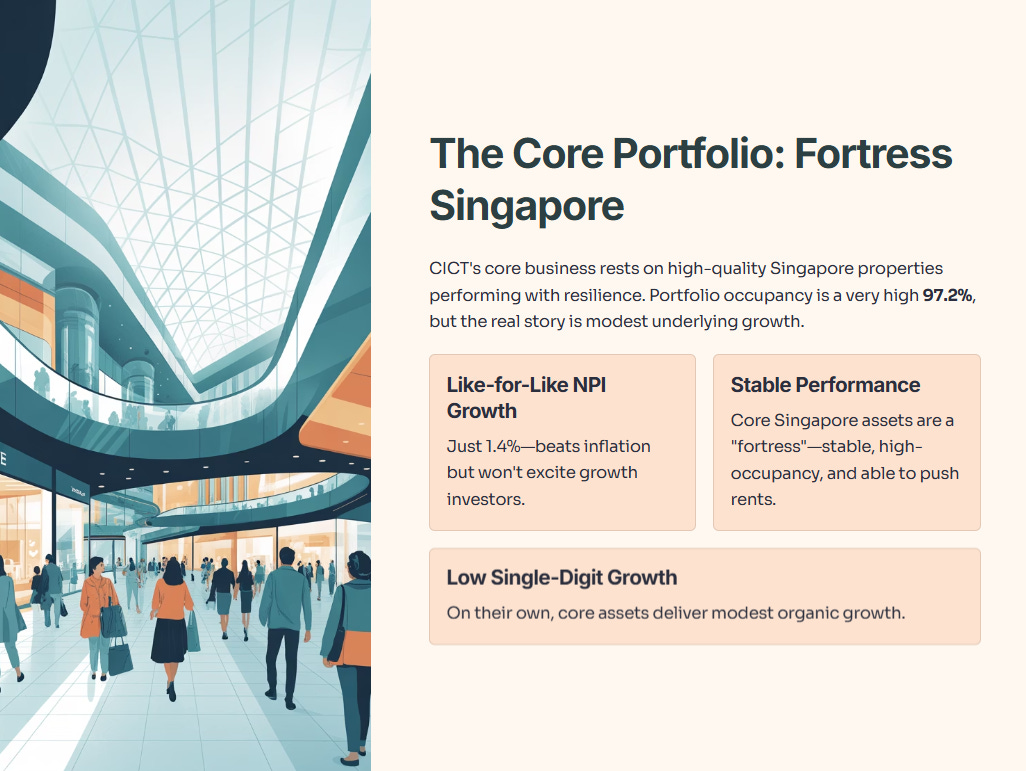
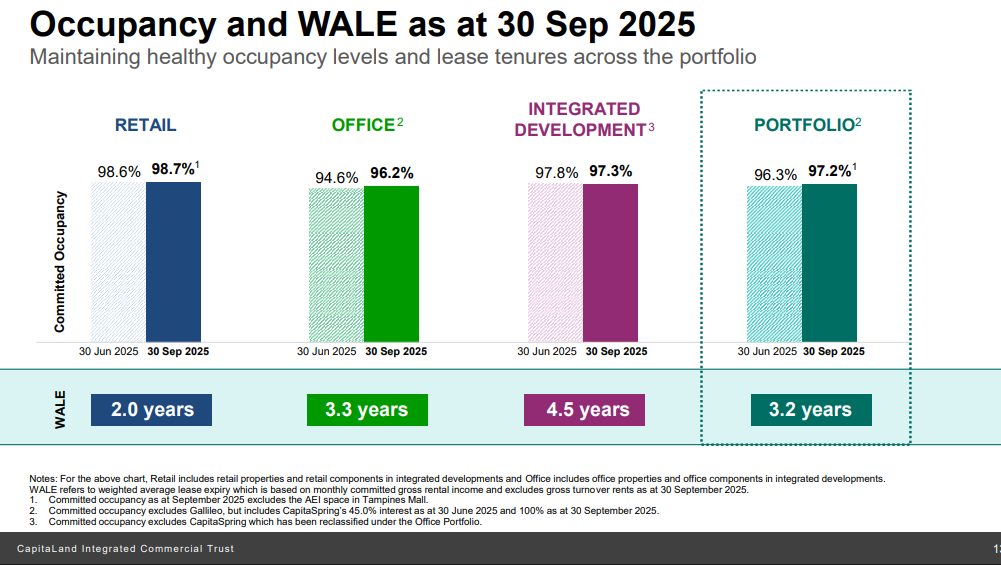
CICT’s core business rests on its high-quality Singapore properties, which are performing with resilience. The headline portfolio occupancy is a very high 97.2% (Slide 3-4), but the real story is the modest underlying growth.
Like-for-like Net Property Income (NPI) grew just 1.4% (Slide 3-4). This beats inflation but won’t excite growth investors.
Retail Portfolio:
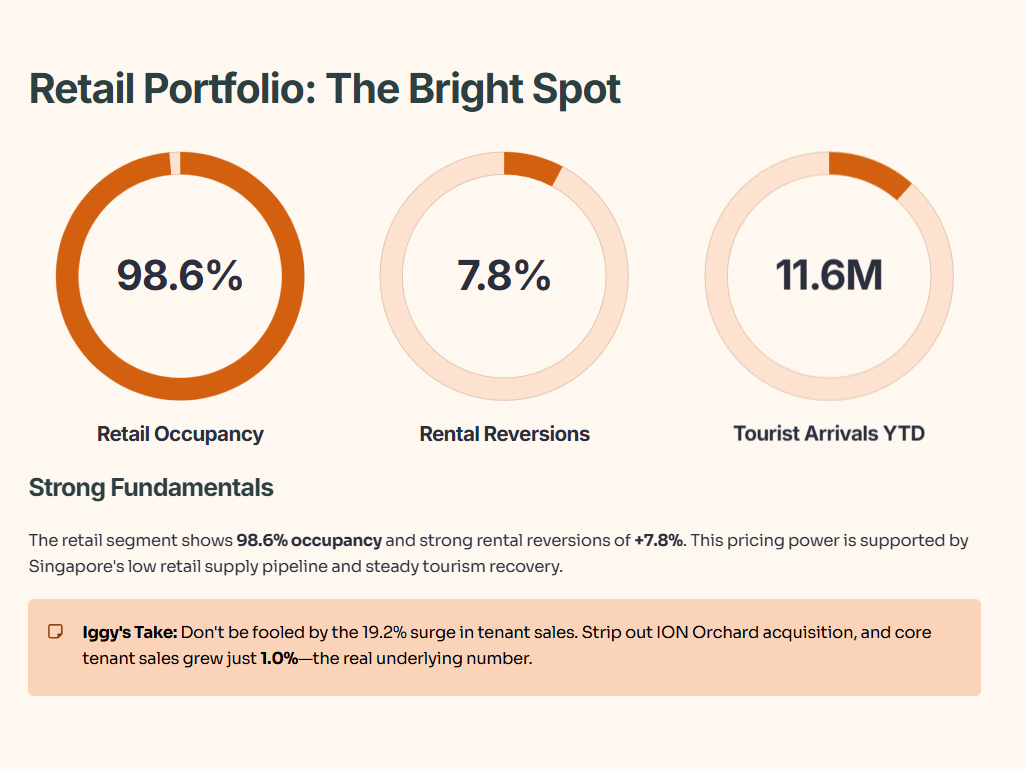
The retail segment is the clear bright spot, with 98.6% occupancy and strong rental reversions of +7.8% (Slide 12). This pricing power is supported by Singapore’s low retail supply pipeline and the steady recovery in tourism, which hit 11.6 million visitors YTD August 2025 (Slide 27-37).
But here’s the “Iggy’s Take”: don’t be fooled by the 19.2% surge in tenant sales (Slide 12). This figure is heavily skewed by the acquisition of ION Orchard. If you strip out ION, core tenant sales grew just 1.0% (Slide 12). This is the real, more modest, underlying number.
Office Portfolio:
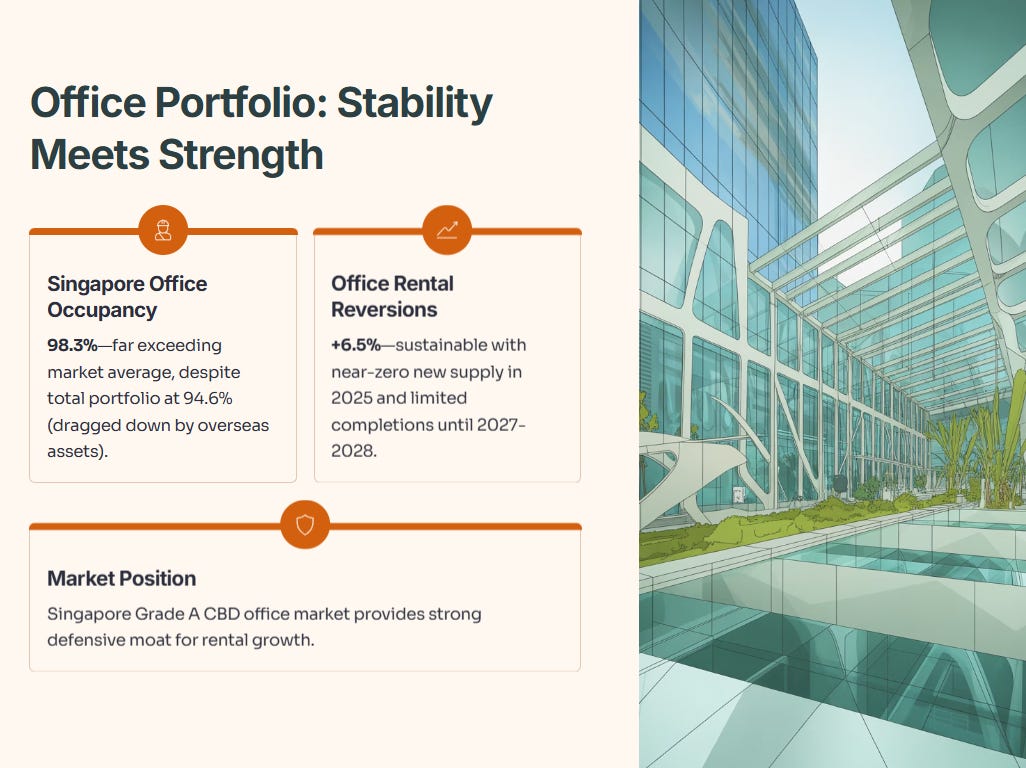
The office segment tells a similar story of stability. While the total office portfolio occupancy is 94.6%, this is dragged down by weaker overseas assets. The Singapore-only office portfolio is at a much stronger 98.3% occupancy (Slide 17), far exceeding the market average.
CICT achieved strong office rental reversions of +6.5% (Slide 12). This is sustainable for now, as the Singapore Grade A CBD office market has near-zero new supply in 2025 and limited new completions until 2027-2028 (Slide 17-20, 27-37).
The key takeaway is that the core Singapore assets are a “fortress”—stable, high-occupancy, and able to push rents. But on their own, they are delivering low single-digit organic growth.
2. The Balance Sheet: Prudent... or Constrained?
This stability is backed by a prudent, but increasingly tight, balance sheet.
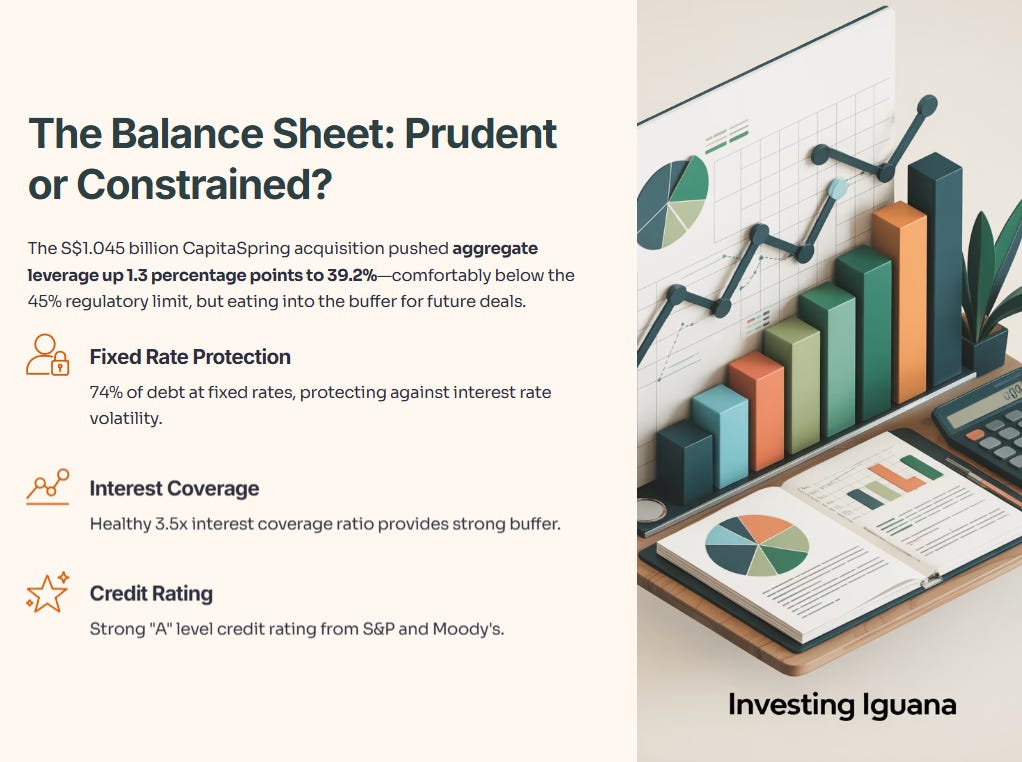
The S$1.045 billion acquisition of the remaining stake in CapitaSpring pushed CICT’s aggregate leverage up 1.3 percentage points to 39.2% (Slide 10). This is comfortably below the 45% regulatory limit, but it eats into the buffer for future large-scale deals.
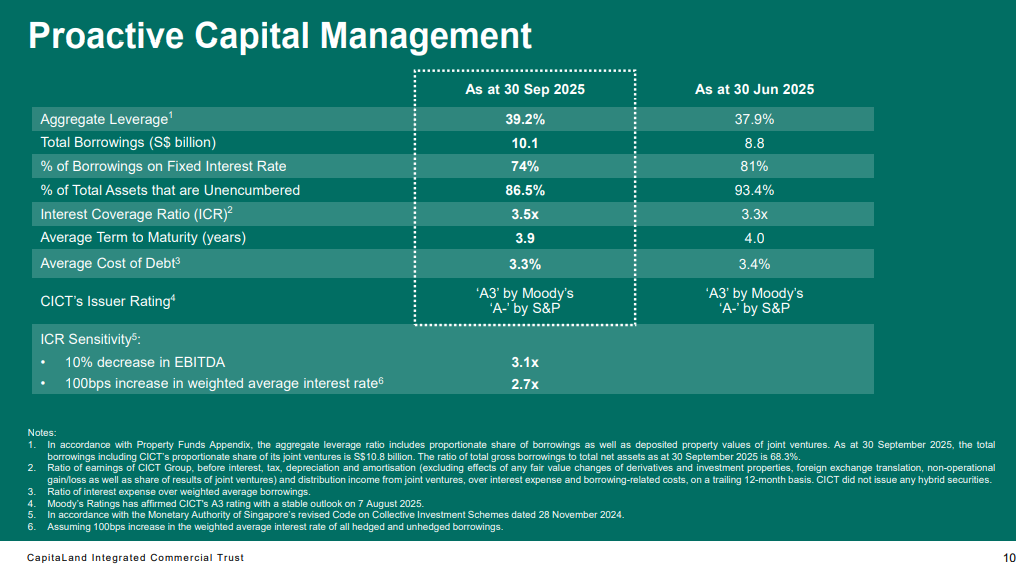
The good news is that management has been smart:
74% of debt is at fixed rates, protecting the REIT from interest rate volatility
(Slide 10).The interest coverage ratio is a healthy 3.5x
(Slide 10).They maintain a strong “A” level credit rating from S&P and Moody’s.
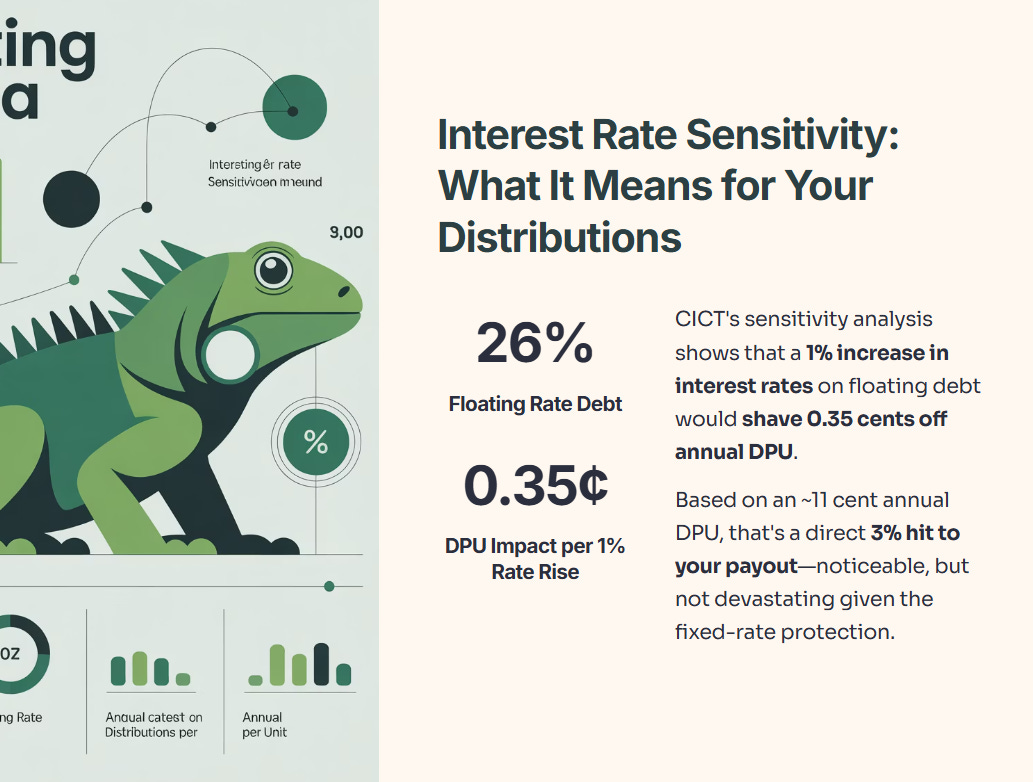
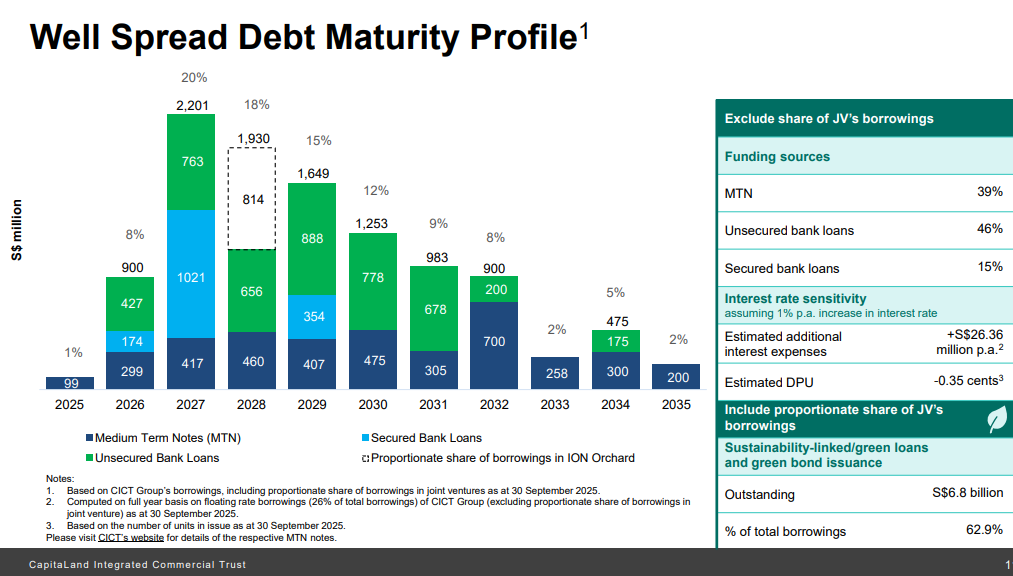
However, here is what matters for your distributions. CICT’s own sensitivity analysis (Slide 11) shows that a 1% increase in interest rates on their floating debt (26% of the total) would shave 0.35 cents off the annual distribution per unit (DPU). Based on an ~11 cent annual DPU, that’s a direct 3% hit to your payout—noticeable, but not devastating.
3. The Future Growth Levers: AEIs, Acquisitions & Overseas
If the core portfolio is stable but slow, where will future growth come from? CICT is pulling three main levers.
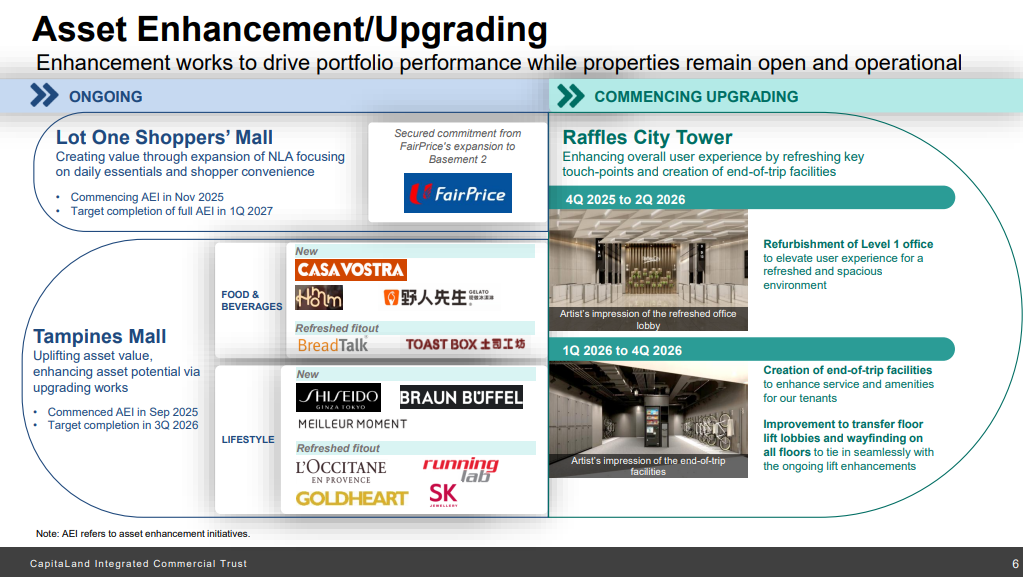
1. Asset Enhancement Initiatives (AEIs) (Slide 5-6)
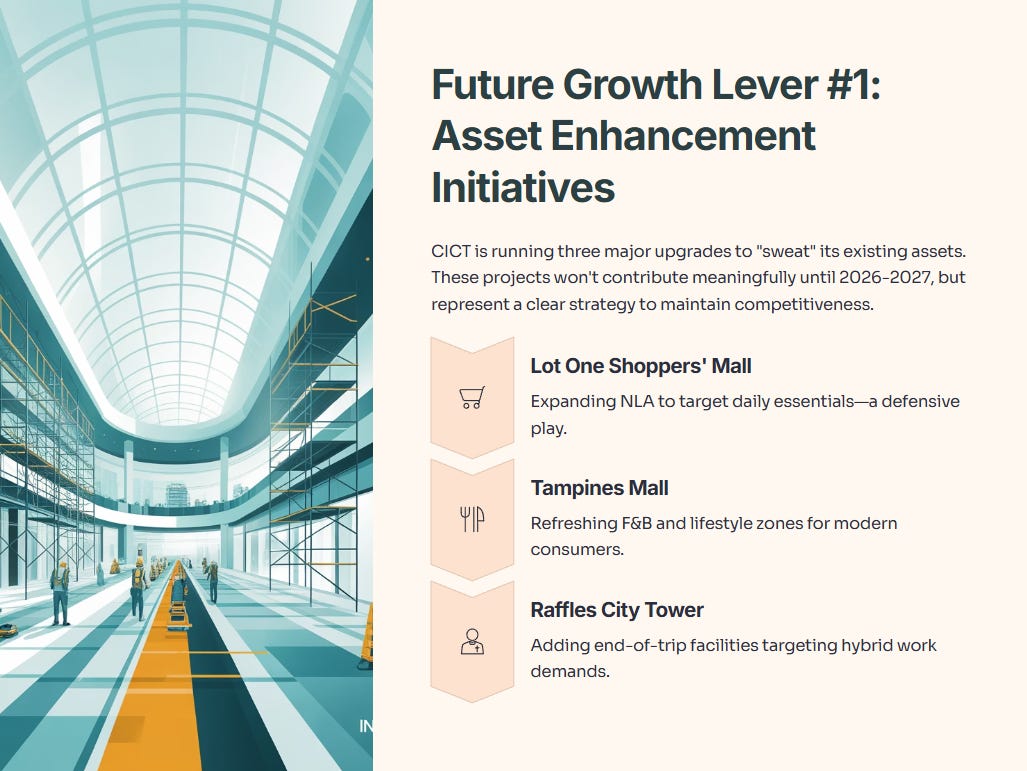
CICT is running three major upgrades to “sweat” its existing assets:
Lot One Shoppers’ Mall: Expanding NLA to target daily essentials (a defensive play).
Tampines Mall: Refreshing F&B and lifestyle zones.
Raffles City Tower: Adding end-of-trip facilities to target the new demands of hybrid work.
These projects won’t contribute meaningfully until 2026-2027, but they represent a clear strategy to maintain competitiveness and drive future rental growth.
2. Full-Year Acquisition Impact (Slide 3-4, 21-23)
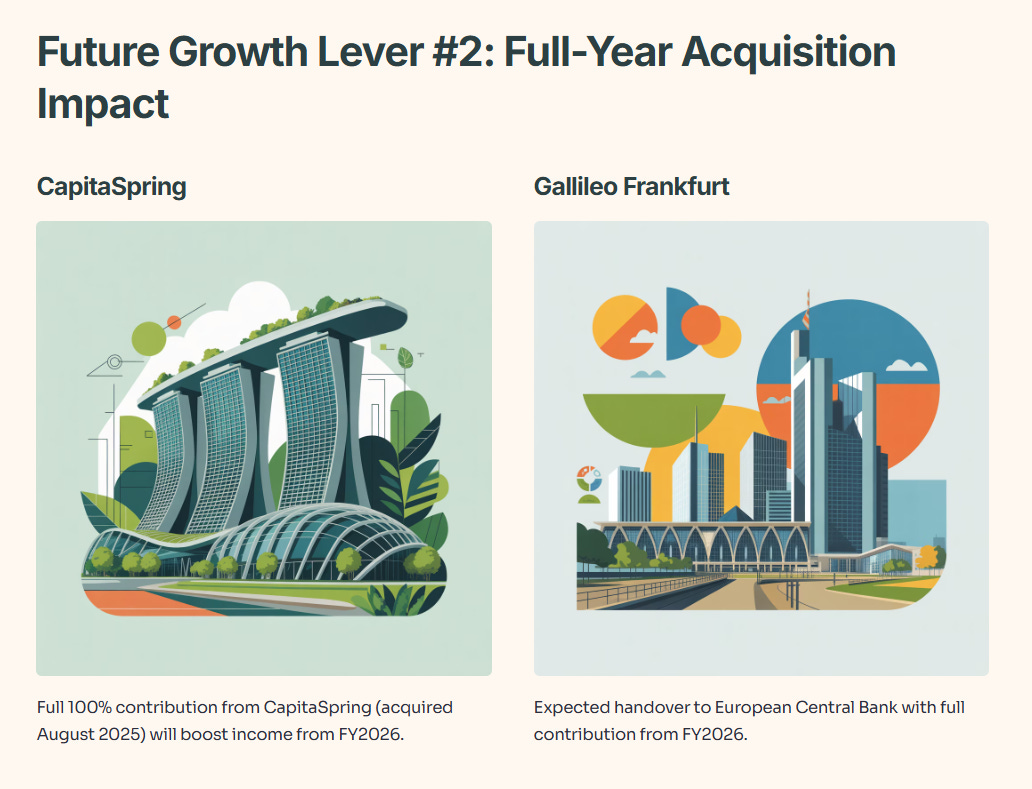
The two biggest income drivers will be the full 100% contribution from CapitaSpring (acquired in August 2025) and the expected handover of the Gallileo property in Frankfurt to the European Central Bank, with full contribution expected from FY2026.
3. The Overseas Question (Slide 12, 17-20)
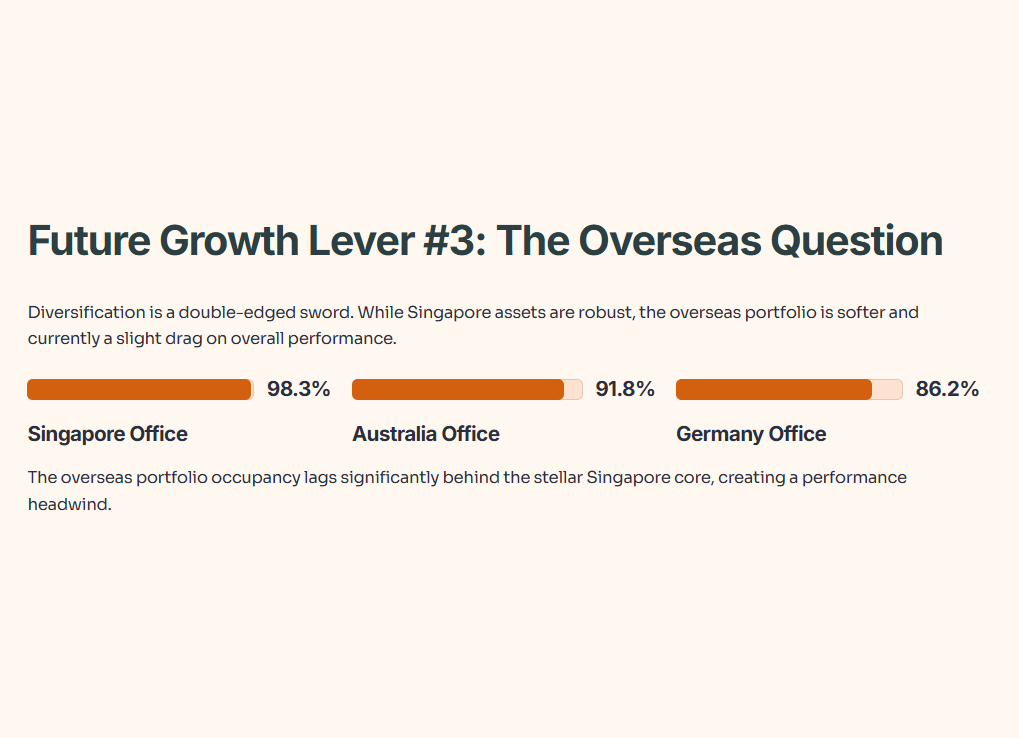
This diversification is a double-edged sword. While the Singapore assets are robust, the overseas portfolio is softer. Office occupancy in Germany sits at 86.2% and Australia at 91.8% (Slide 12). For now, these assets are a slight drag on the portfolio’s otherwise stellar occupancy rates.

Investment Verdict & “So What” for Your CPF/SRS
After dissecting the update, here’s my assessment.
