

Data Centres, Rising Rates, and a REIT at the Crossroads
Can NTT DC REIT ride the surging data wave, or will rising costs crimp its upside? Let’s unpack the real numbers—and what they mean for Singapore portfolios seeking growth and stability.

Setting the Stage for Singapore Investors
Data is growing, power is tight, and interest rates remain the elephant in the room. As a Singapore-based investor, you need clarity—not just on headline numbers, but on what they mean for your CPF, SRS, and long-term dividend goals.
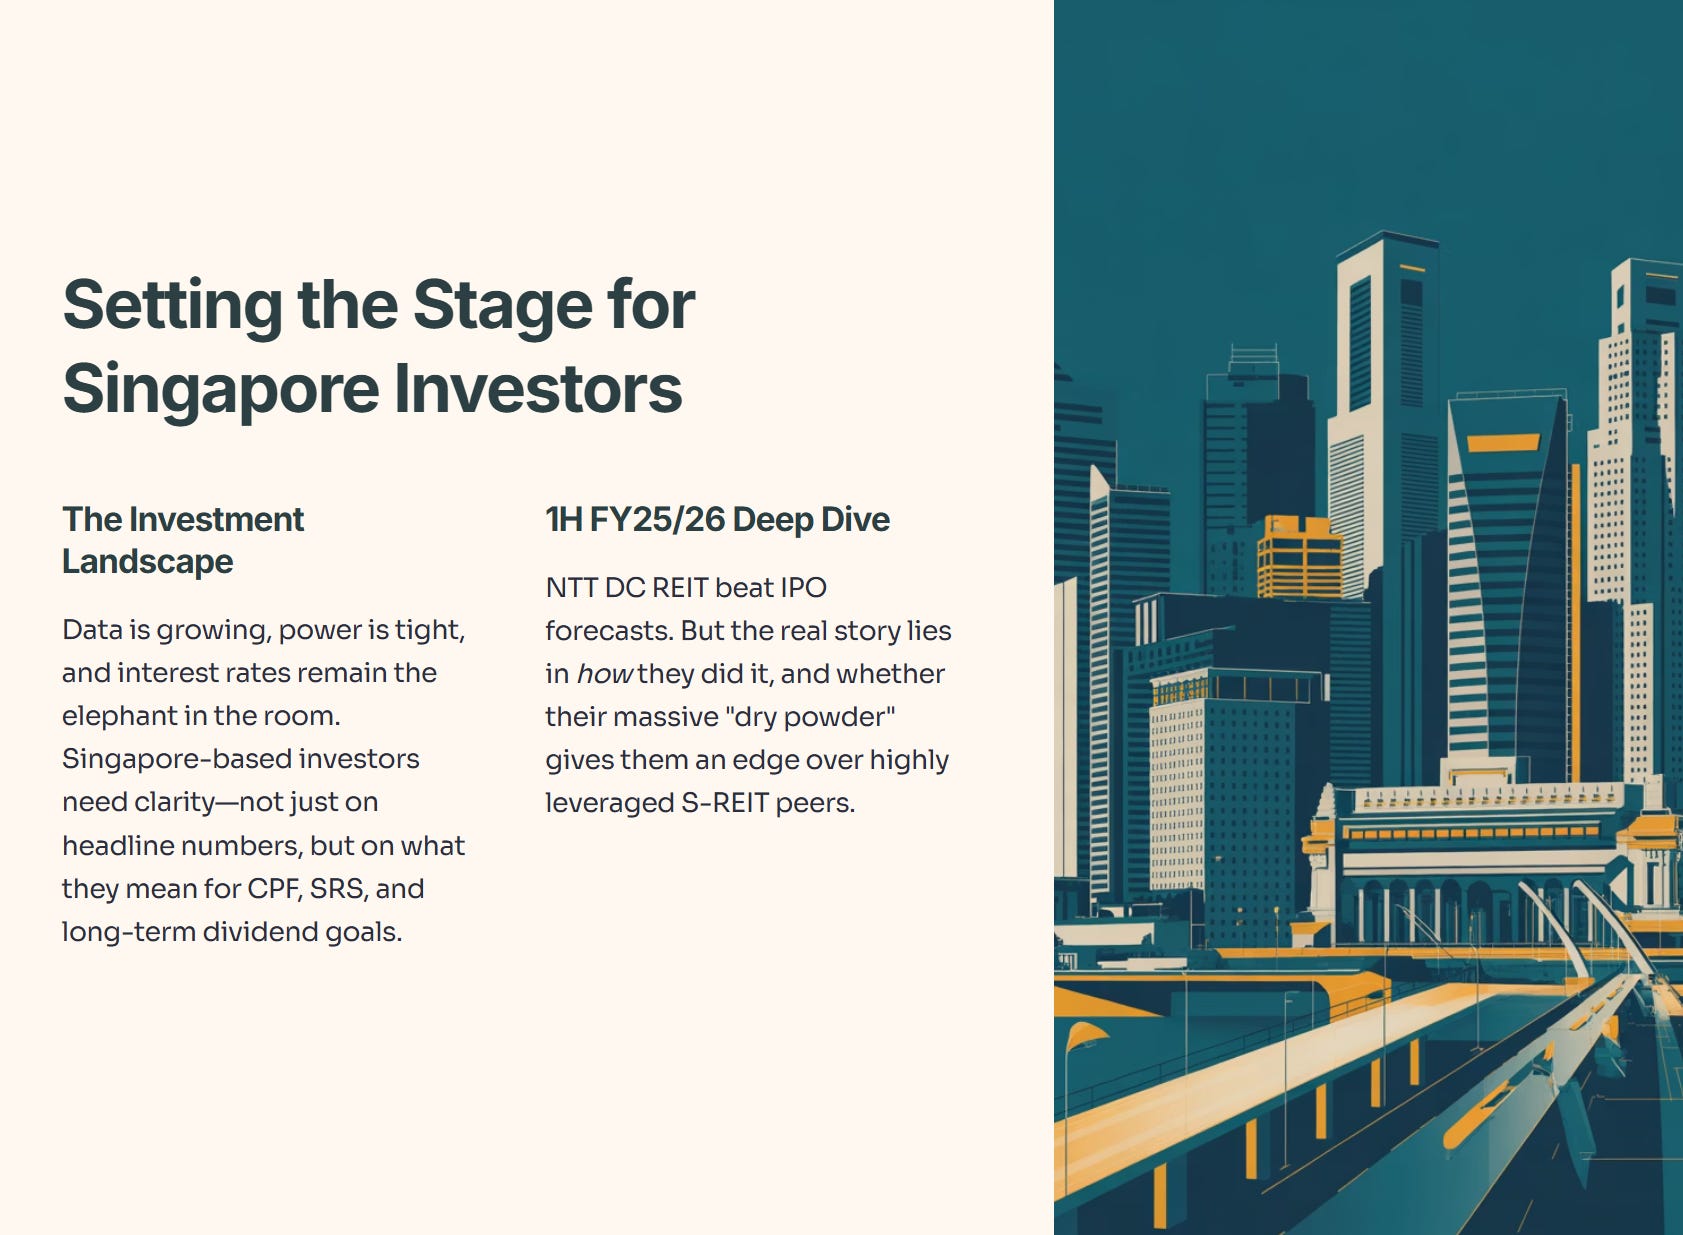
In this deep dive, we are looking at NTT DC REIT’s 1H FY25/26 financial report. The headline? They beat their IPO forecasts. But the real story lies in how they did it, and whether their massive “dry powder” gives them an edge over highly leveraged S-REIT peers.
In This Article:

• The Financial Health: Boring, But Beautiful
• The Portfolio & Risks: The “S” in Your SRS
• The Outlook: Power, Scarcity, and Spillover
• Iggy’s Verdict: Buy, Hold, or Sell?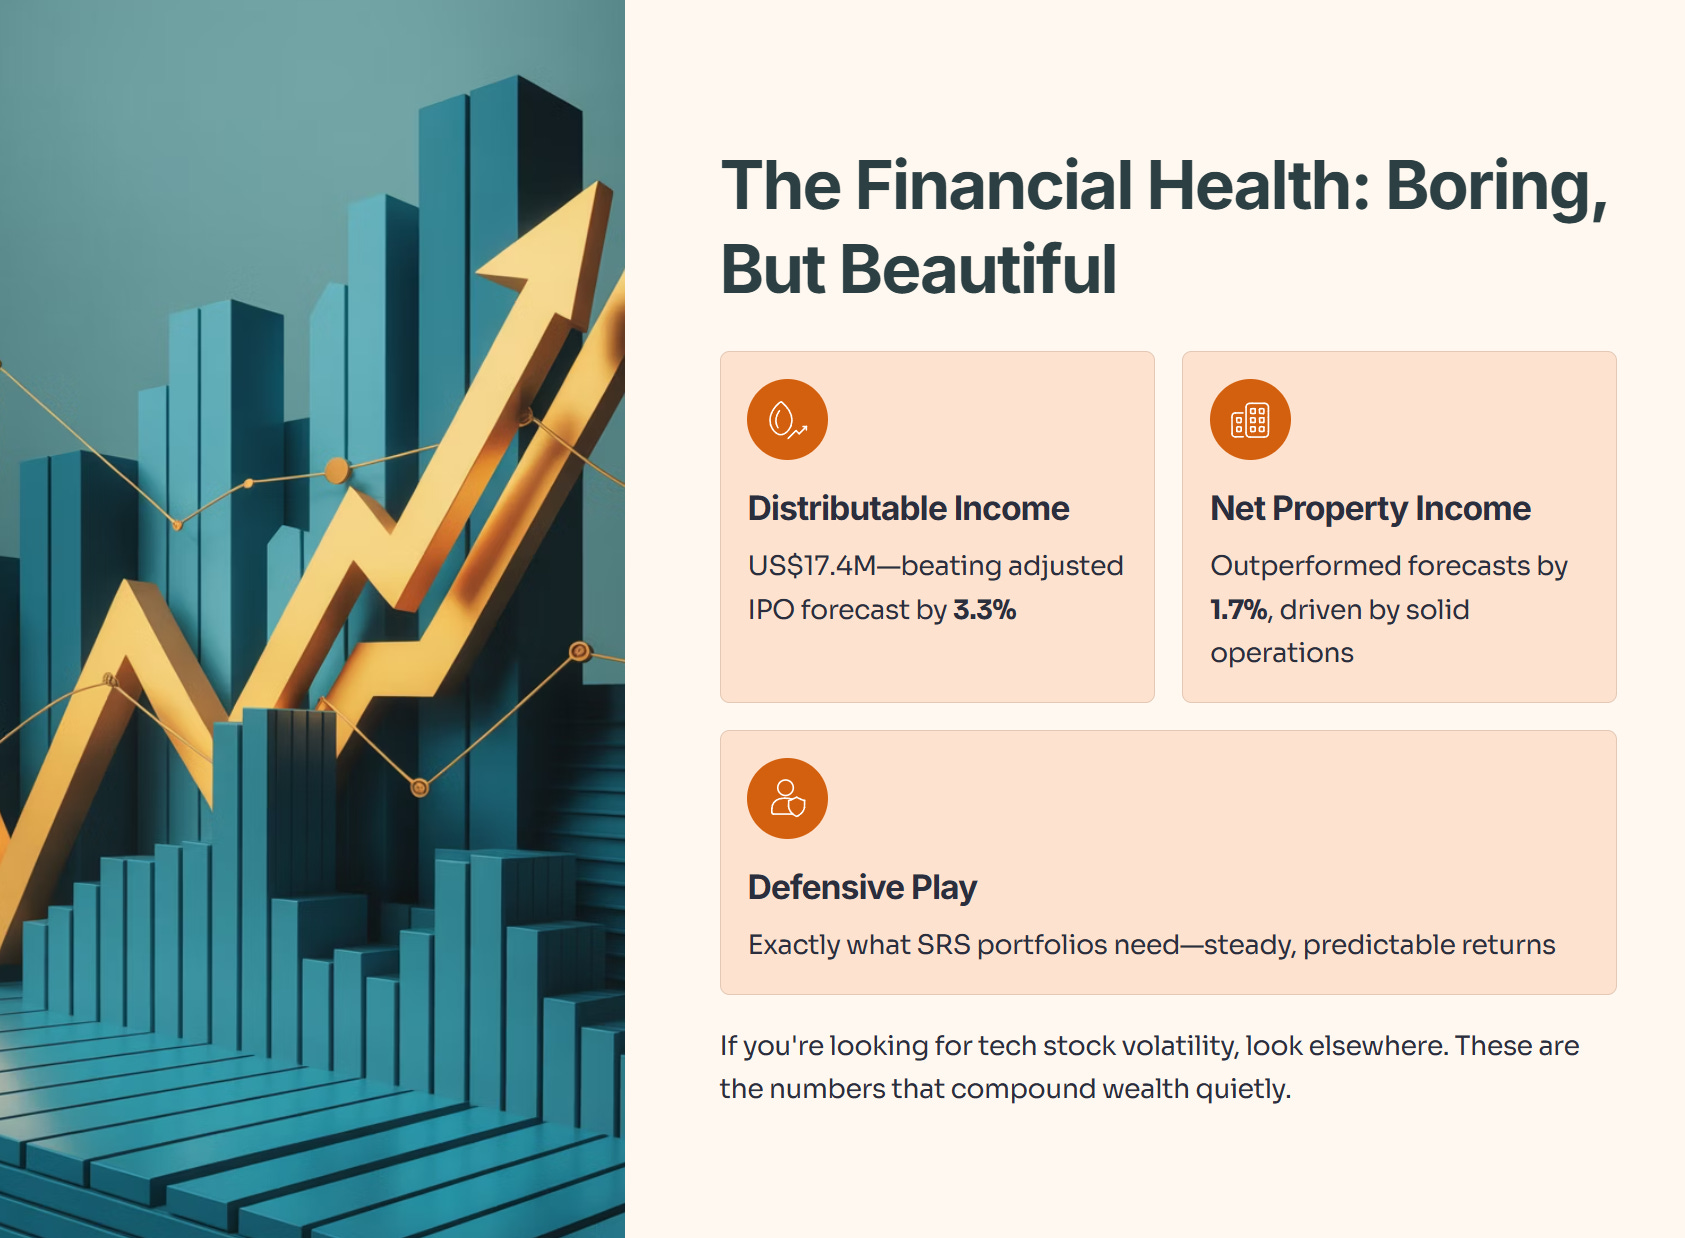
1. The Financial Health: Boring, But Beautiful
If you are looking for the volatility of a tech stock, look elsewhere. NTT DC REIT delivered a “boring but beautiful” set of numbers—exactly what we want for the defensive portion of an SRS portfolio.
The Headline Numbers:
Distributable income hit US$17.4 million, coming in 3.3% higher than their adjusted IPO forecast. This was driven by a solid operational performance where Net Property Income (NPI) edged out forecasts by 1.7%.
Here is the snapshot of how they performed against what they promised:
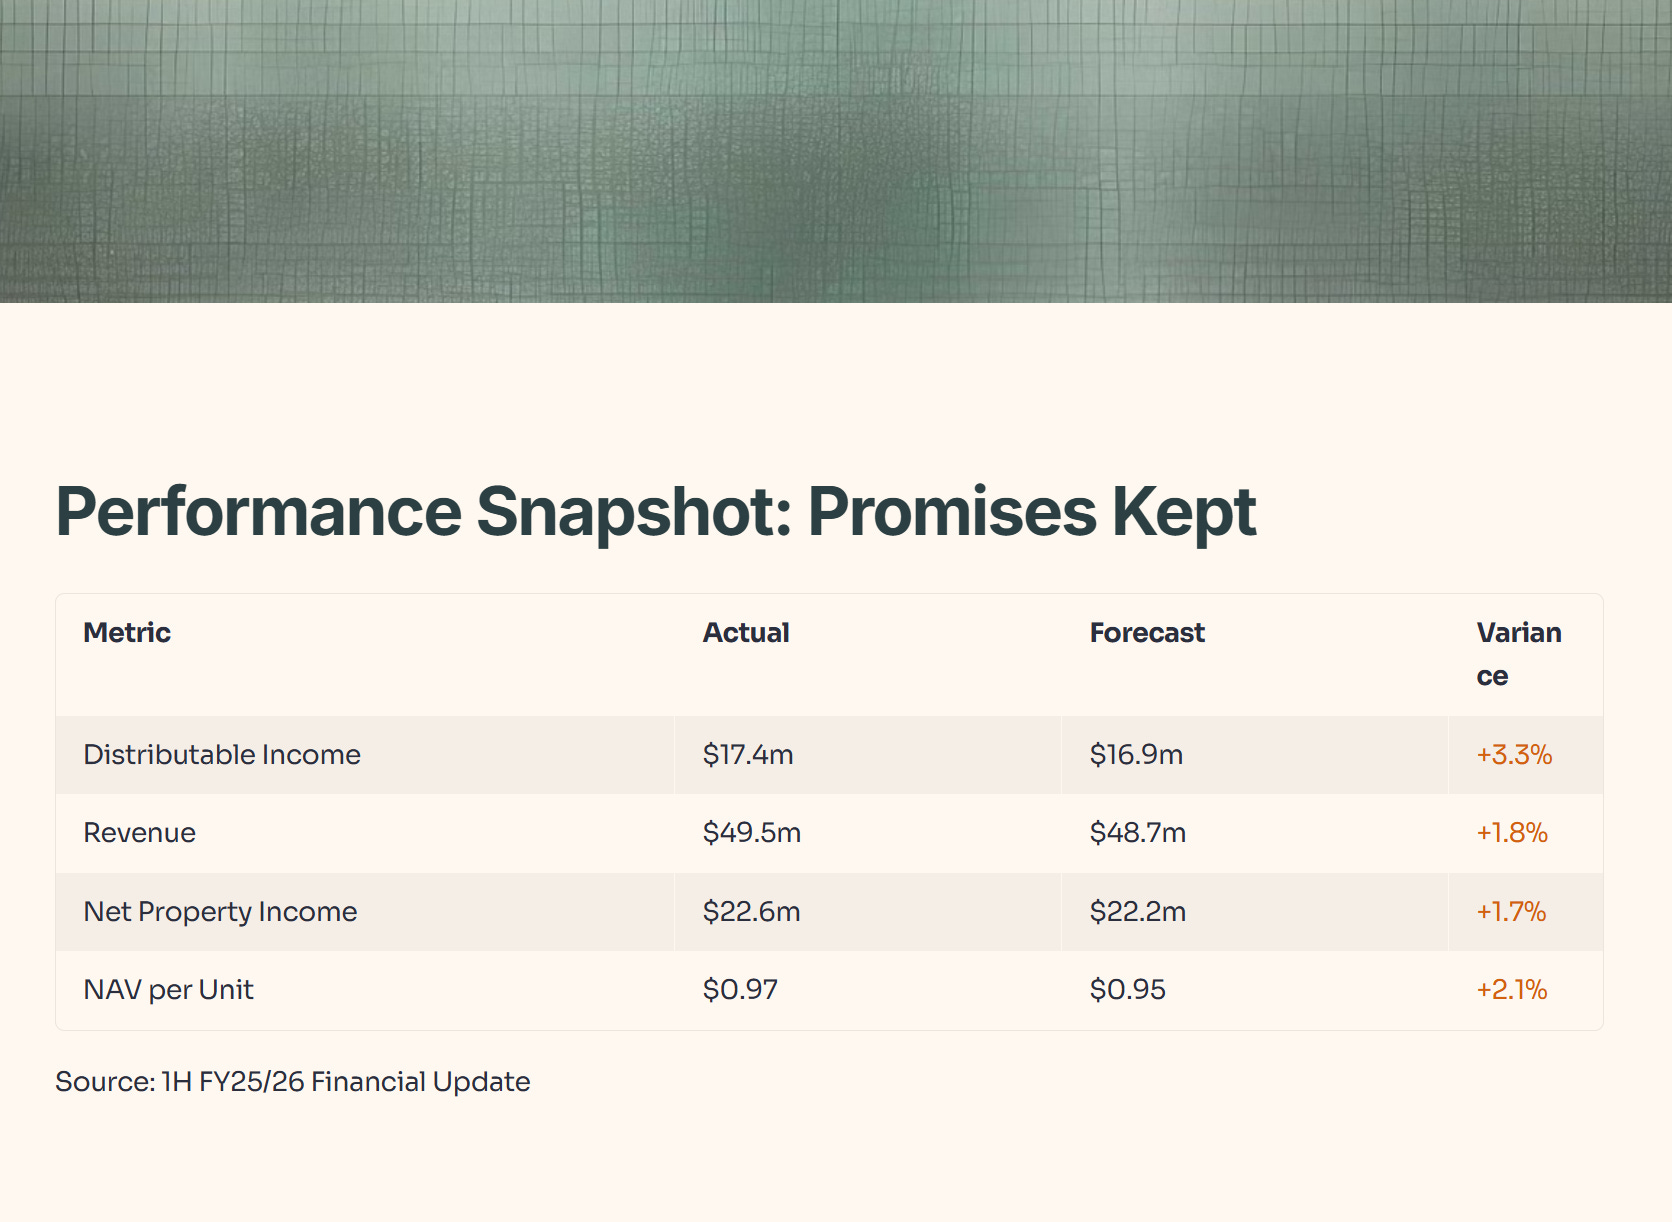
(Source: 1H FY25/26 Financial Update, Page 5)
The “Dry Powder” Advantage:
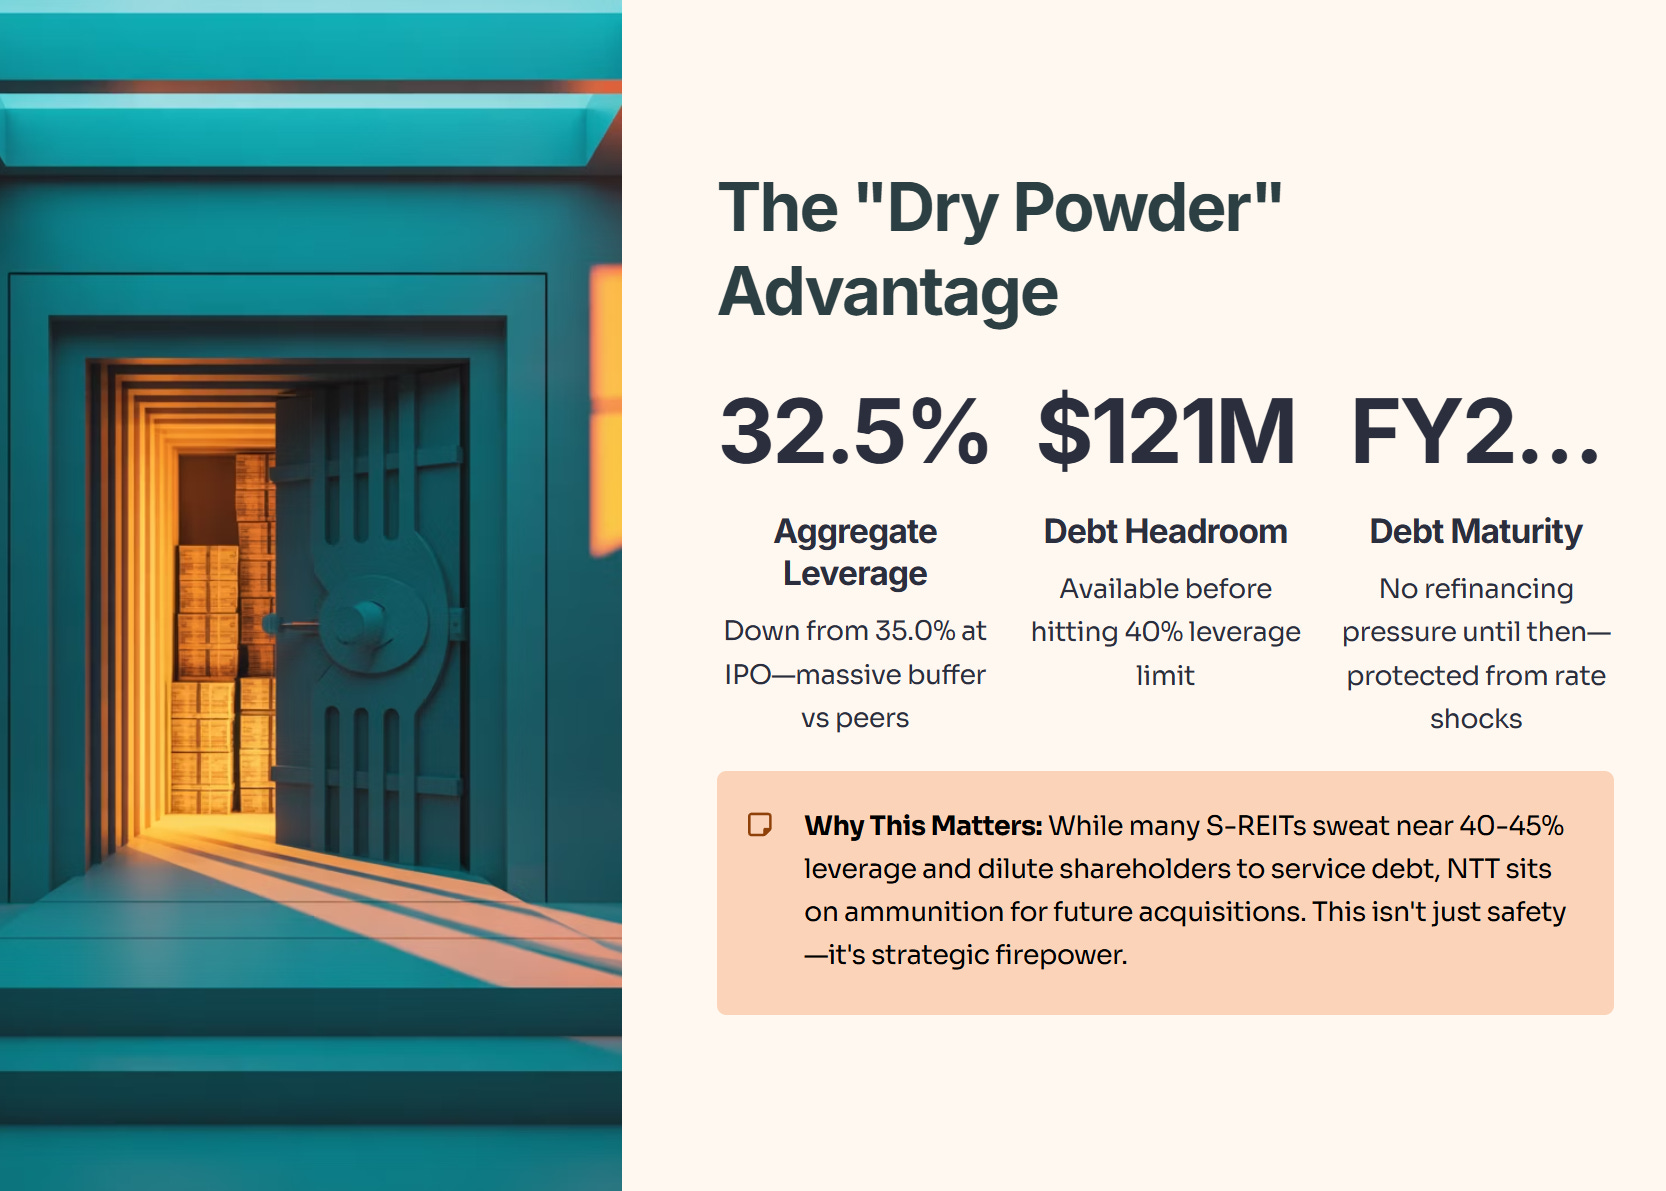
Here is the kicker for Singapore investors tired of seeing REITs dilute shareholders to pay off debt. NTT DC REIT’s aggregate leverage dropped to 32.5% (down from 35.0% at IPO).
In a market where many S-REITs are sweating near the 40-45% leverage limit, NTT sits on a massive buffer. They have US$121 million in debt headroom before they even hit 40% leverage. This isn’t just safety; it’s ammunition for future acquisitions. Furthermore, they have no debt maturing until FY28/29, insulating them from immediate refinancing risks.
2. The Portfolio & Risks: The “S” in Your SRS
The portfolio is stabilized, but it comes with a specific concentration risk you need to be aware of.
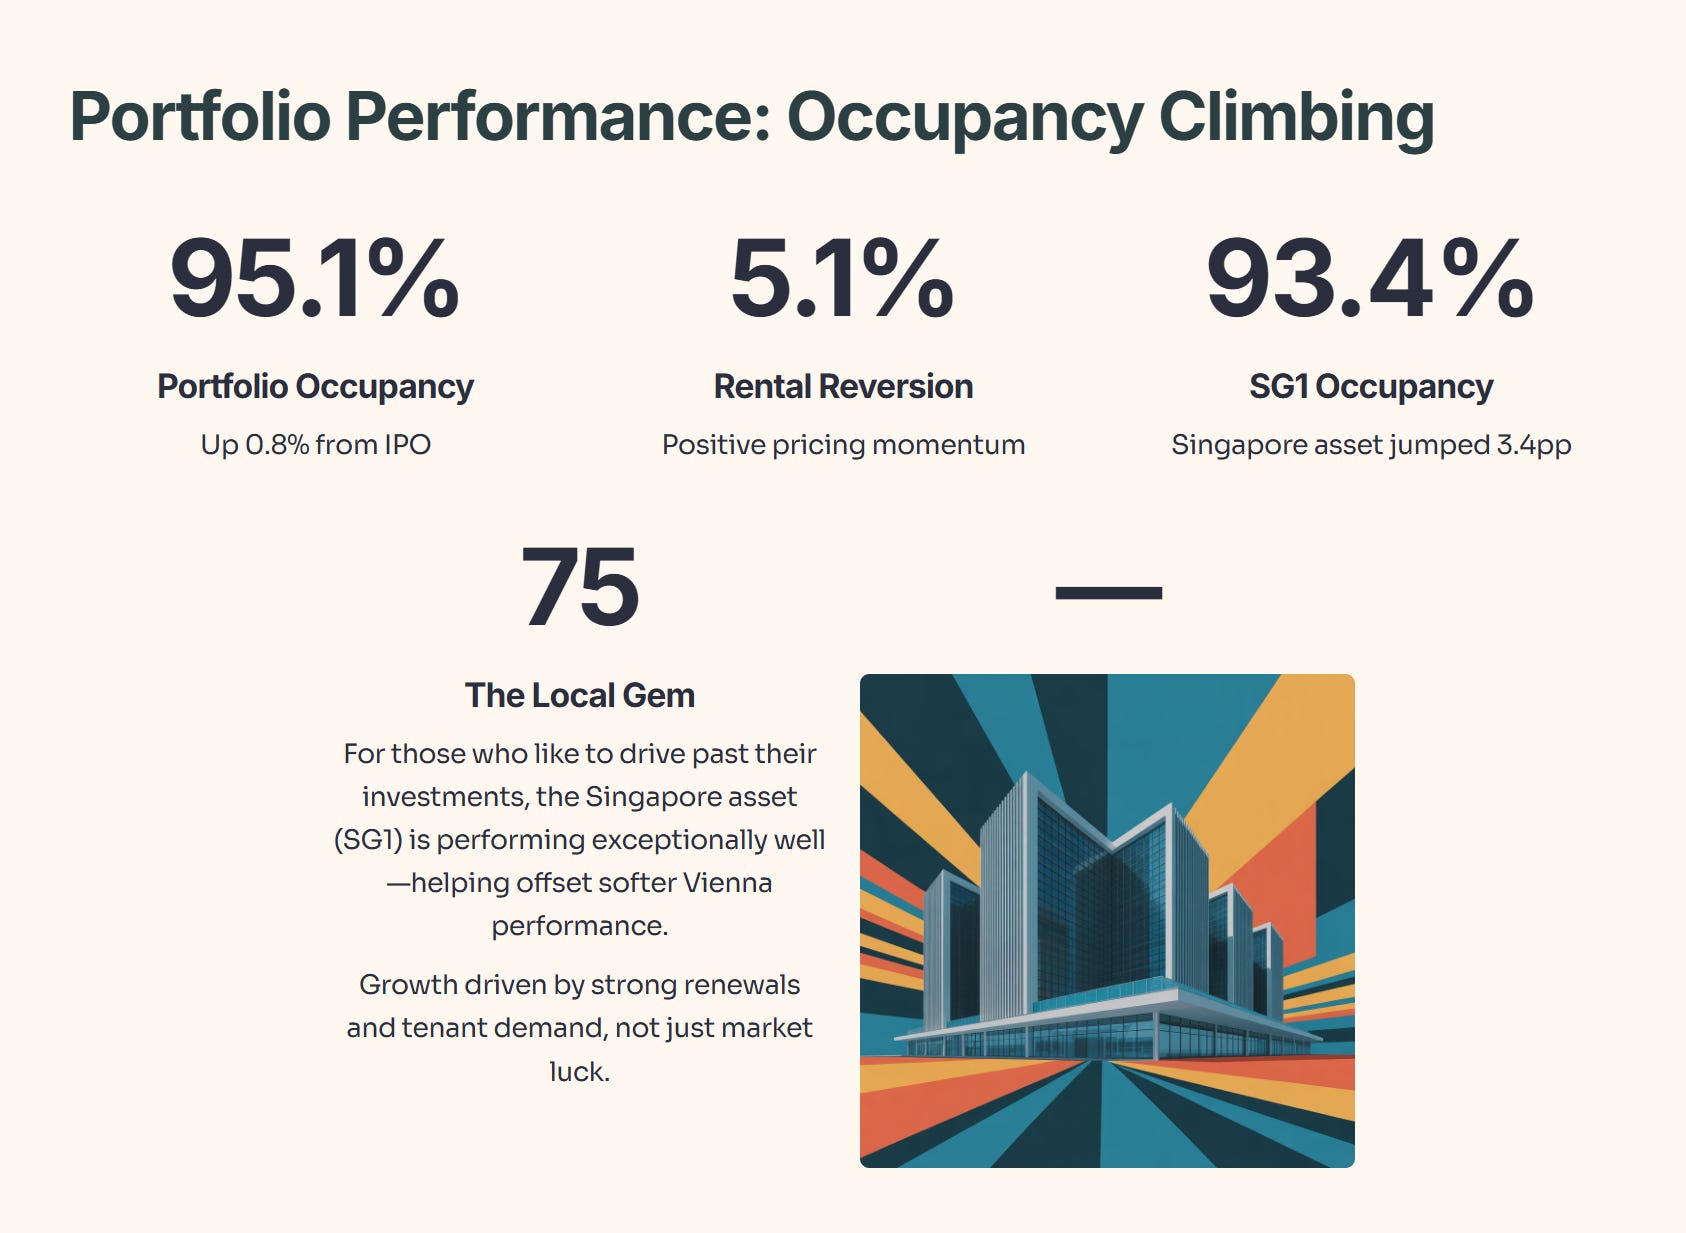
Occupancy is Climbing:
Portfolio occupancy rose to 95.1% (up 0.8% from IPO)7. This growth wasn’t just luck; it was driven by strong renewals and a positive rental reversion of 5.1%8.
The Local Gem (SG1):
For those of us who like to drive past our investments, the Singapore asset (SG1) is performing exceptionally well. Occupancy at SG1 jumped significantly by 3.4 percentage points to 93.4%9. This helps offset softer performance in Vienna (VIE1), which dipped slightly.
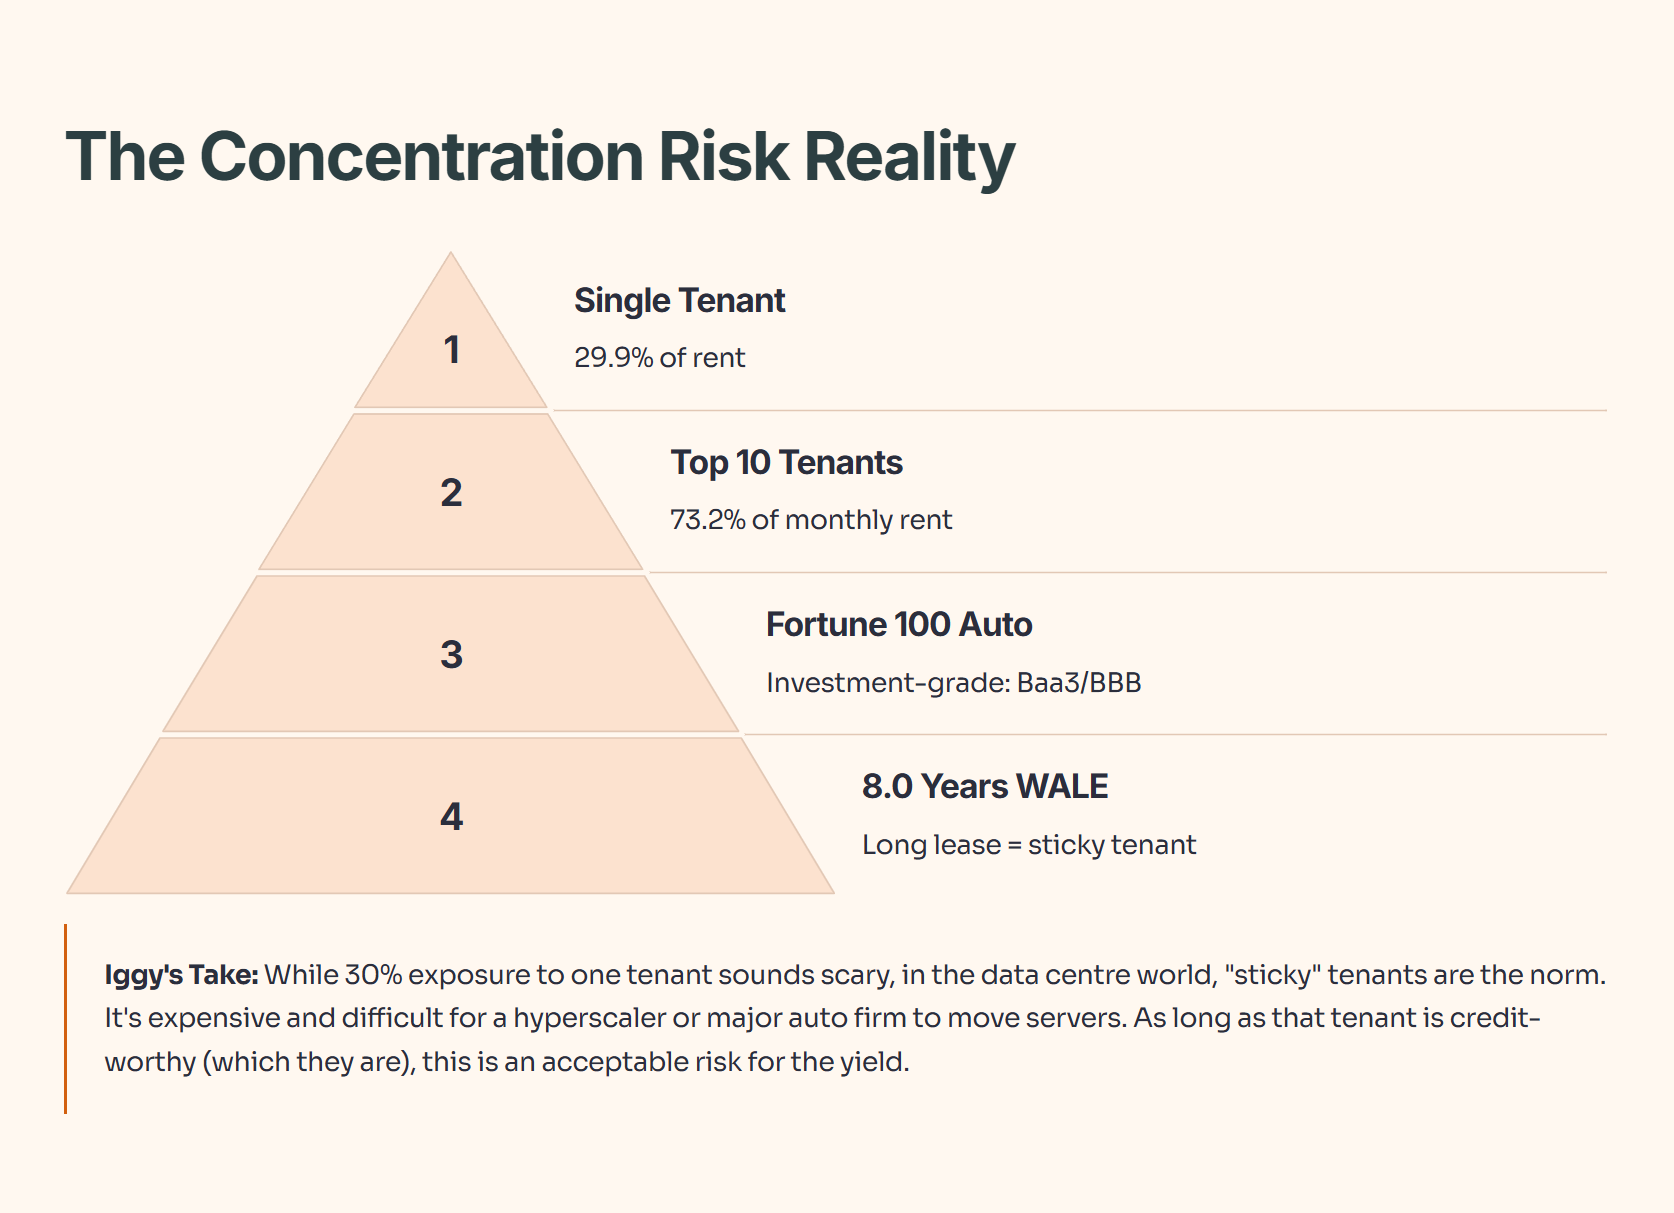
The “Elephant in the Room” Risk:
While the metrics are strong, there is a concentration risk. The top 10 customers account for 73.2% of the monthly rent.
The Big One: A single “Fortune 100 US Automotive Company” accounts for 29.9% of the rent.
The Offset: This tenant has a long WALE (Weighted Average Lease Expiry) of 8.0 years and an investment-grade credit rating (Baa3/BBB).
Iggy’s Analysis: While 30% exposure to one tenant sounds scary, in the data centre world, “sticky” tenants are the norm. It is expensive and difficult for a hyperscaler or major auto firm to move servers. As long as that tenant is credit-worthy (which they are), this is an acceptable risk for the yield.
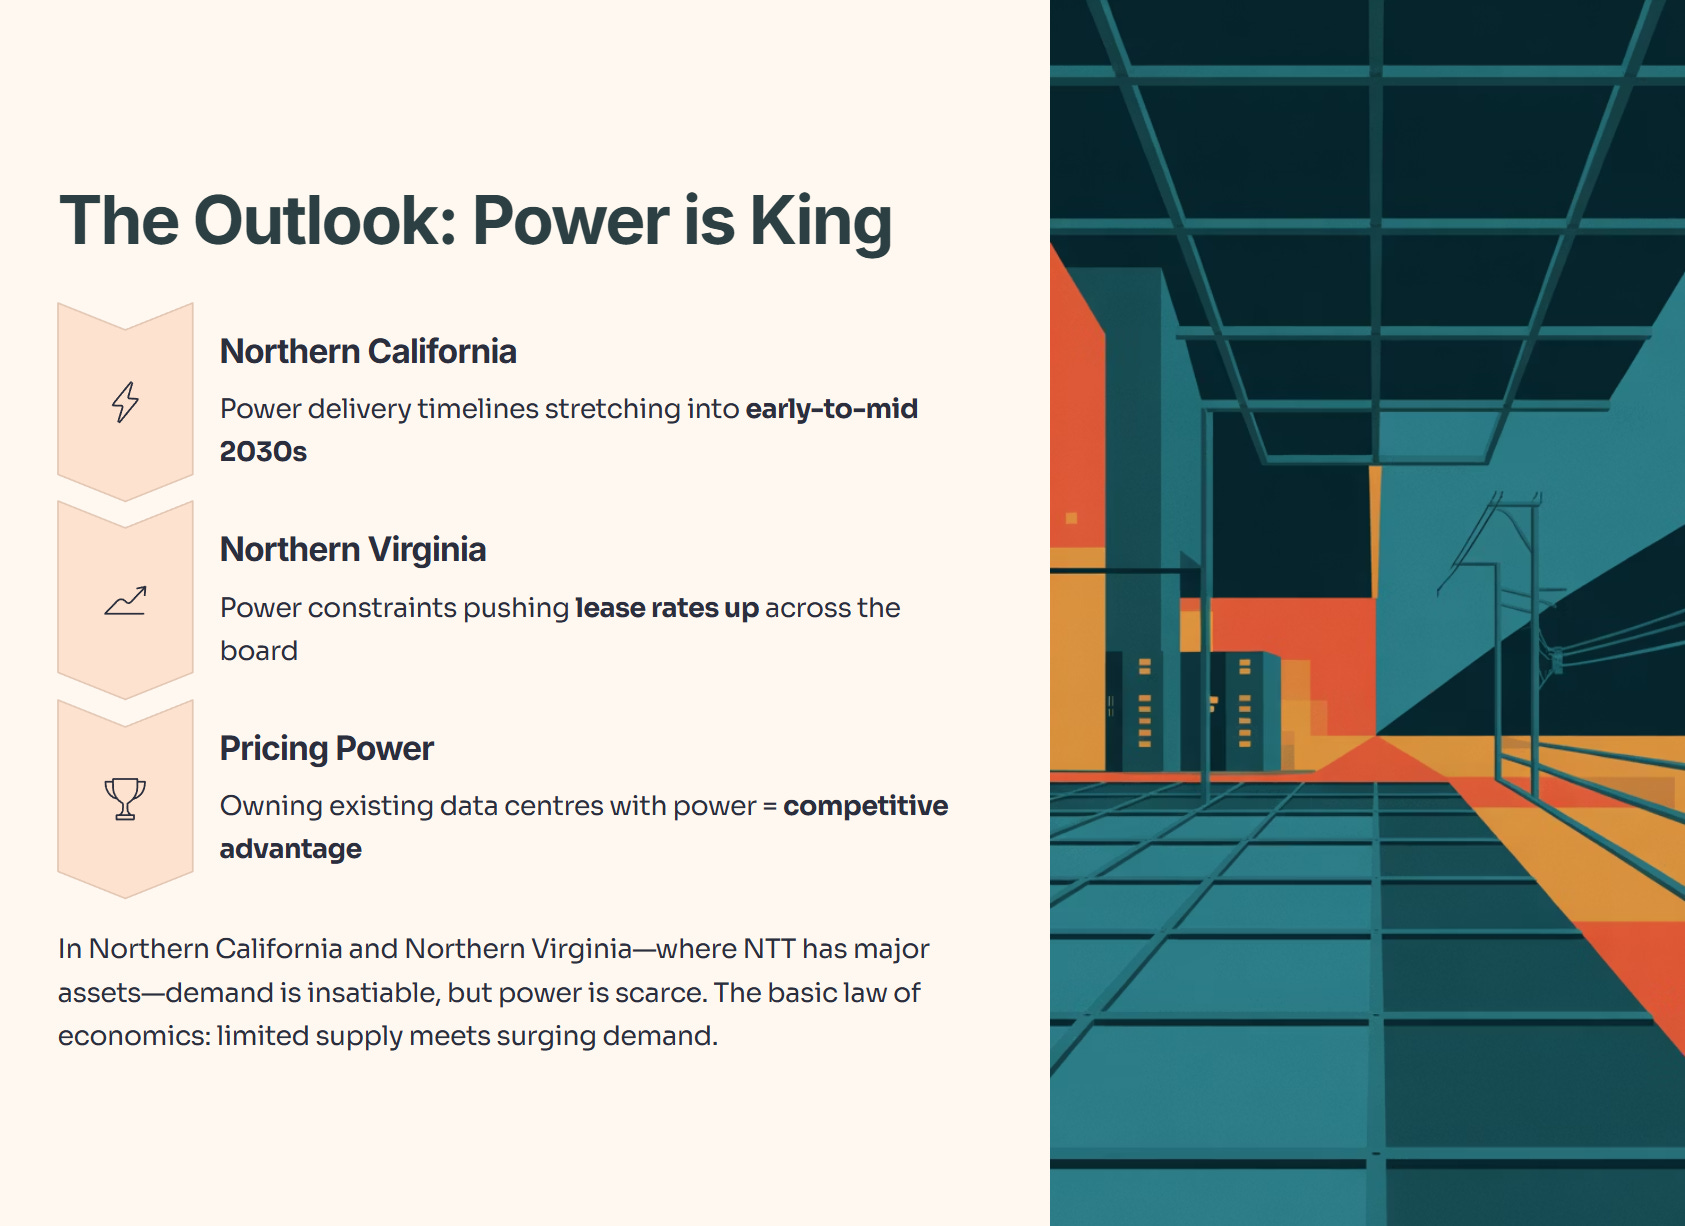
3. The Outlook: Power, Scarcity, and Spillover
Why should we remain bullish on this sector? The basic law of economics: Supply and Demand.
