

DBS 3Q25 Results: Can Singapore’s Banking Giant Weather the Rate Storm?
DBS just dropped record-breaking quarterly income, but 2026 guidance hints at profit pressure. With net interest margins shrinking and Fed cuts ahead, should SGX investors hold, add, or exit?

DBS just dropped record-breaking quarterly income, but 2026 guidance hints at profit pressure. With net interest margins shrinking and Fed cuts ahead, should SGX investors hold, add, or exit? Here’s the slide-by-slide breakdown you won’t find anywhere else.
Opening your SGX brokerage app to see DBS trading near all-time highs while management forecasts lower 2026 profits creates a confusing moment. You want clarity on whether this banking titan still deserves a spot in your CPF or SRS portfolio. That’s exactly what we’re unpacking today.
In This Article:

• CEO Presentation: Strategic Positioning and 2026 Outlook
• Slide 1: Another Record Quarter
• Slide 2: Macro Observations and DBS as a Differentiator Bank
• Slide 3: 2026 Outlook—Profit Pressure Ahead
• What This Means for You:
• CFO Presentation: Detailed Financial Performance
• Slide 1: Highlights Summary
• Slide 2: 3Q Net Profit Declines 2 Percent Year-Over-Year
• Slide 3: 3Q Net Profit Up 5 Percent Quarter-Over-Quarter
• Slide 4: 9M Total Income and Pre-Tax Profit Reach New Highs
• Slide 5: 3Q Group Net Interest Income Lower QoQ and Little Changed YoY
• Slide 6: Deposits Up 3 Percent QoQ, 9 Percent Over 9M
• Slide 7: Loans Little Changed QoQ, Surplus Deposits Deployed to HQLA
• Slide 8: 3Q and 9M Fee Income Rise to Record, Led by Wealth Management
• Slide 9: Record 9M Wealth Segment Income, AUM at New High
• Slide 10: 3Q Customer-Driven Non-Interest Income Rises 22 Percent YoY, 9M Up 17 Percent
• Slide 11: 9M Cost-Income Ratio Stable at 39 Percent
• Slide 12: NPL Ratio Stable at 1.0 Percent
• Slide 13: 3Q SP at 15bp, 9M at 13bp
• Slide 14: Allowance Coverage Ratio at 139 Percent
• Slide 15: Strong CET1 and Leverage Ratios
• Slide 16: 3Q Total Dividend of 75 Cents Per Share
• Slide 17: Summary—Delivered Record Third-Quarter and Nine-Month Performance
• Investor Guidance and Iggy’s Assessment
• Key Risks
• Key Opportunities
• Valuation and Target Price
• Iggy’s Verdict
• Actionable Steps:
• Premium Member Call to Action
A quick note on format: Instead of just pasting screenshots from the official corporate deck, I’ve synthesized the key data and created my own summary slides for this analysis. This allows us to cut through the noise, focus on the exact numbers that matter to us as SGX investors, and present the information more clearly.
For 100% transparency, the original, untouched presentations from both the CEO and CFO are the source for this analysis.
Opening your SGX brokerage app to see DBS trading near all-time highs while management forecasts lower 2026 profits creates a confusing moment. You want clarity on whether this banking titan still deserves a spot in your CPF or SRS portfolio. That’s exactly what we’re unpacking today.
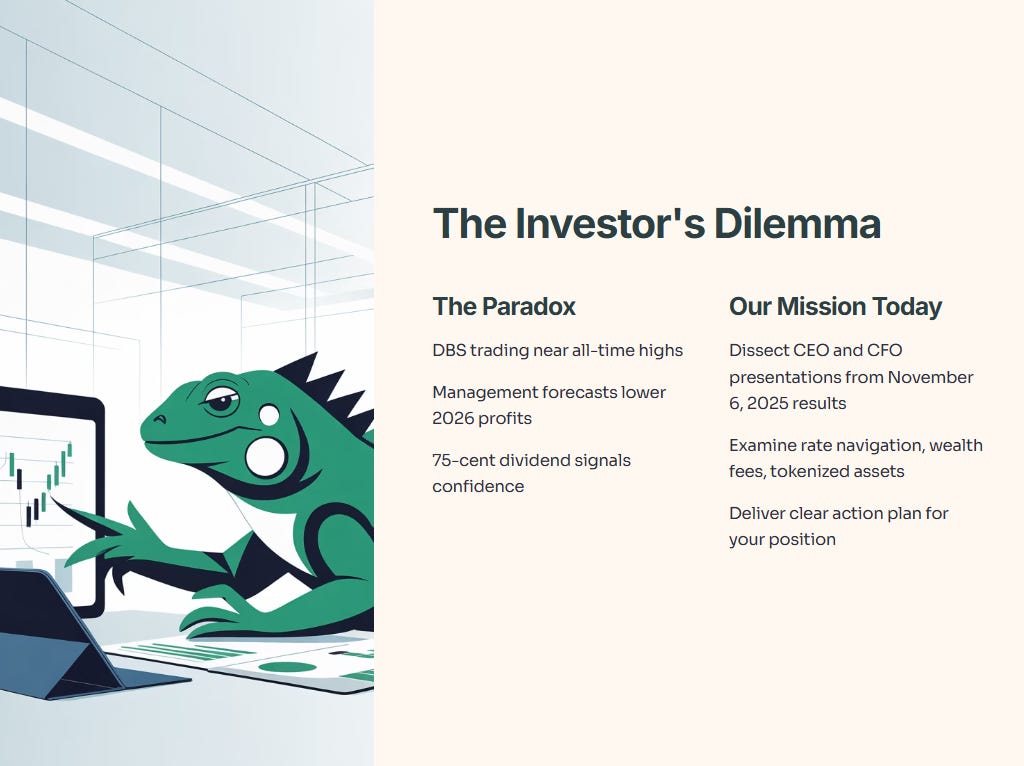
Today, we’re dissecting both the CEO and CFO presentations from DBS’s 3Q25 results released November 6, 2025. Over the next few sections, you’ll get the full financial picture—slide by slide. We’ll examine how DBS navigated falling interest rates, what’s driving their record wealth management fees, why they’re betting big on tokenized assets, and whether the 75-cent dividend (60 cents ordinary plus 15 cents capital return) signals confidence or concern. By the end, you’ll have a clear action plan for your DBS position.
Let’s start with the CEO’s strategic view, then move into the CFO’s detailed numbers.
CEO Presentation: Strategic Positioning and 2026 Outlook
Slide 1: Another Record Quarter
DBS CEO Tan Su Shan opened with confidence. The bank delivered another record quarter, supported by three key pillars.
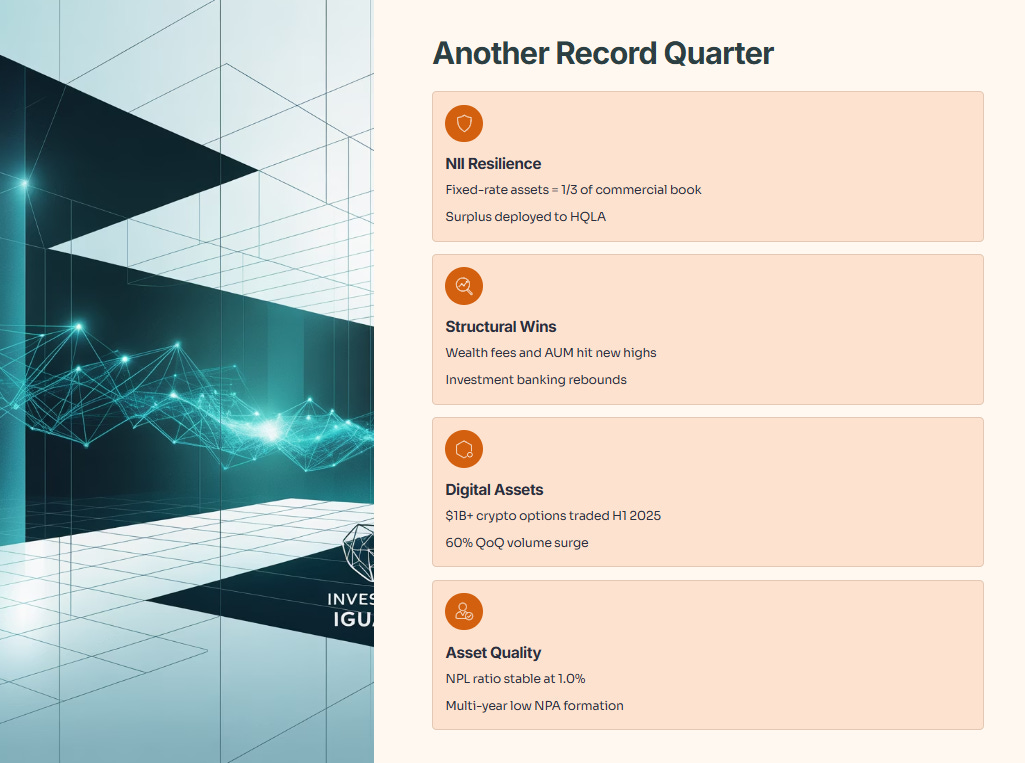
Group Net Interest Income Resilience: Management highlighted that fixed-rate assets now represent around one-third of the commercial book. This proactive hedging strategy cushions the blow from falling Singapore Overnight Rate Average (SORA) rates. Surplus deposits were deployed into High Quality Liquid Assets (HQLA), which are accretive to both net interest income and return on equity. Think of it like locking in higher yields before rates dropped—a smart insurance policy.
Capturing Structural and Market Opportunities: DBS saw strong momentum in wealth management, with both fees and assets under management hitting new highs. Loan-related fees maintained solid momentum, and investment banking fees rebounded. Markets trading income was particularly strong, underpinned by equity derivatives—a reflection of increased client activity during volatile periods.
Digital Asset Capability: DBS strengthened its blockchain and tokenization push. The bank issued a tokenized structured note on a public blockchain and listed a tokenized money market fund on DDEX for potential repo and collateral use cases. In the first half of 2025, clients traded over one billion USD in crypto options and structured notes, with trade volumes surging nearly 60 percent quarter-over-quarter between 1Q and 2Q 2025.
Asset Quality: Non-performing loan ratio remained stable at 1.0 percent, and Institutional Banking Group NPA formation hit a multi-year low. This suggests the credit environment remains benign despite macro uncertainties.
Slide 2: Macro Observations and DBS as a Differentiator Bank
DBS positioned itself to benefit from three macro trends:
Key Macro Trends:
Shift in trade and investment flows (driven by tariffs, supply chain reconfiguration)
Capital market revival (benefiting investment banking and equity capital markets)
Internationalization of the renminbi (RMB)
Structural Growth Drivers:
Wealth and institutional asset growth
Accelerated tech adoption (GenAI, Agentic AI)
Growing interest in tokenization and stablecoins
DBS framed itself as a “Differentiator Bank” with four characteristics:
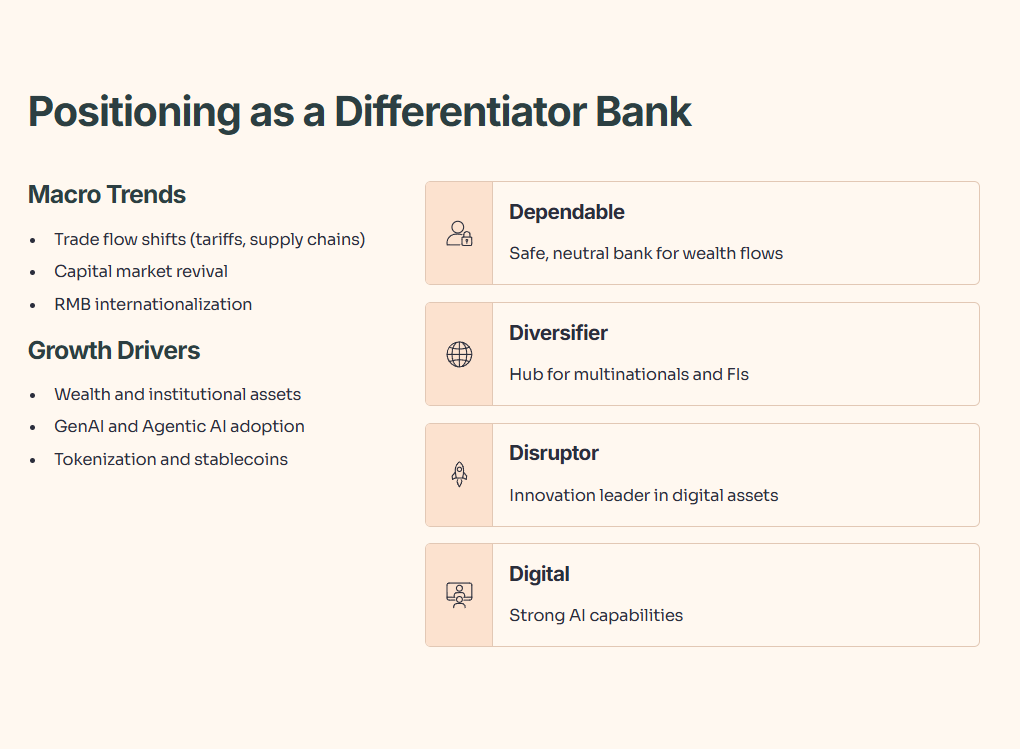
This table shows DBS is betting that its digital infrastructure and regional presence will attract flows from clients seeking alternatives amid geopolitical shifts. For SGX investors, this means DBS is positioning itself as a wealth hub and regional custodian—an important competitive moat in a world where trust and neutrality matter.
Slide 3: 2026 Outlook—Profit Pressure Ahead
Here’s where the rubber meets the road. DBS guided for 2026 outcomes that suggest a slight step backward:
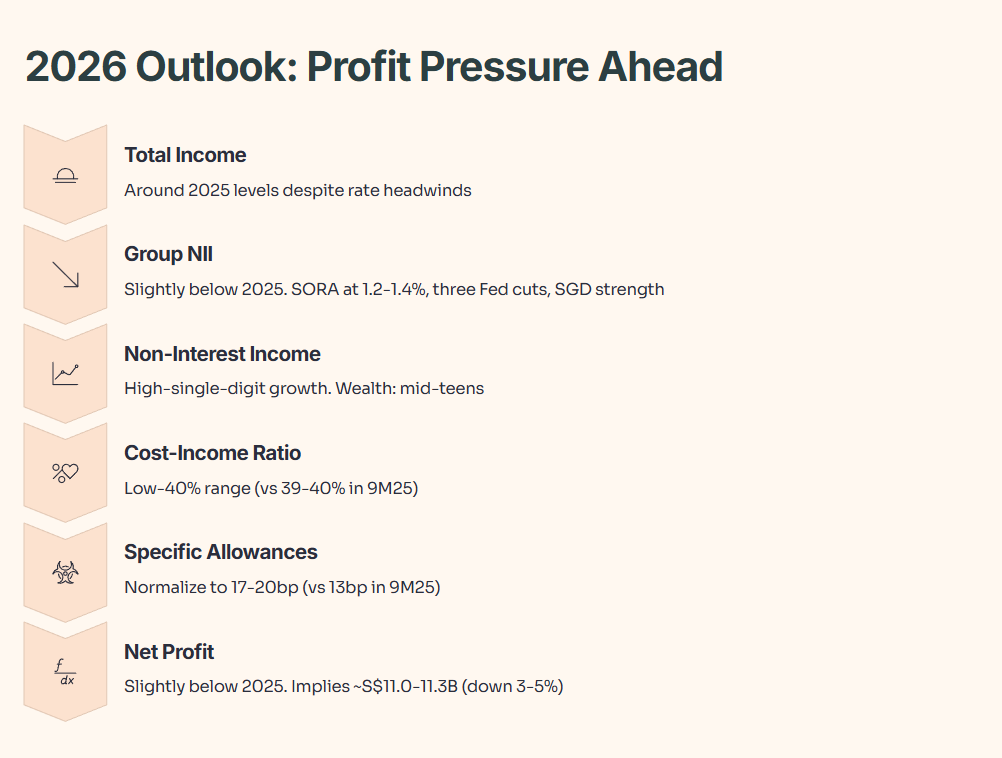
Total Income: Around 2025 levels despite rate headwinds. This implies flat to slightly lower total income.
Group Net Interest Income: Slightly below 2025 levels. The assumption is SORA stays around current levels (approximately 1.2 to 1.4 percent as of late 2025), three Fed rate cuts occur, and the Singapore dollar strengthens. The full-year impact of lower rates will be mitigated by deposit growth and hedging.
Commercial Book Non-Interest Income: High-single-digit growth, with mid-teens growth expected in wealth management. This is a bright spot—fee momentum remains strong.
Cost-Income Ratio: Expected in the low-40 percent range. This is a slight uptick from the 39 to 40 percent range seen in 9M25, suggesting modest expense pressure.
Specific Allowances (SP): Assumed to normalize to 17 to 20 basis points. Management noted they’re not seeing signs of stress yet, and there’s potential for general provision (GP) write-backs. For 3Q25, SP was 15 basis points and 9M25 was 13 basis points, so normalization implies modest uptick.
Net Profit: Slightly below 2025 levels. Given 9M25 net profit was S$8.675 billion, full-year 2025 is tracking around S$11.5 to S$11.6 billion. Slightly below would imply 2026 net profit around S$11.0 to S$11.3 billion—a decline of roughly 3 to 5 percent.
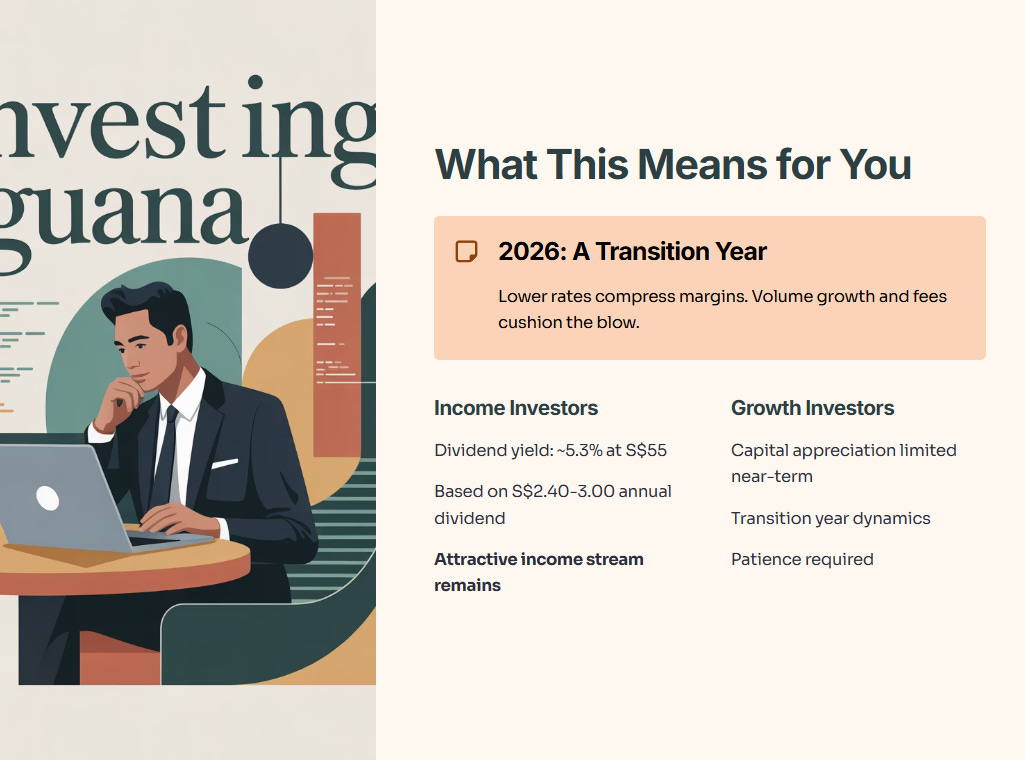
What This Means for You: DBS is signaling that 2026 will be a transition year. Lower rates will compress margins, but volume growth and fee momentum will cushion the blow. If you’re holding DBS for income, the dividend yield (approximately 5.3 percent at current prices around S$55, based on S$2.40 to S$3.00 annual dividend) remains attractive. But capital appreciation may be limited in the near term.
CFO Presentation: Detailed Financial Performance
Now let’s dive into the CFO’s slides to understand the numbers behind the narrative.
Slide 1: Highlights Summary
The CFO presentation opened with the headline numbers:
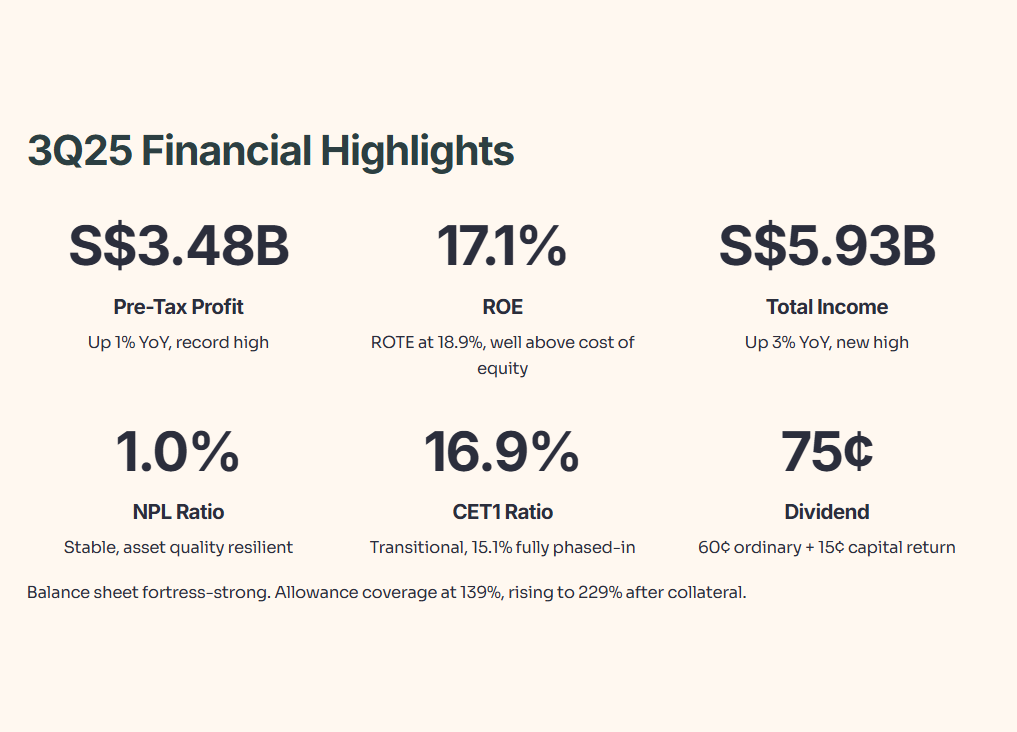
3Q25 Pre-Tax Profit: Up 1 percent year-over-year to a record S$3.48 billion. Return on equity (ROE) at 17.1 percent and return on tangible equity (ROTE) at 18.9 percent. These are strong profitability metrics, well above cost of equity.
Total Income: Up 3 percent year-over-year to a new high of S$5.93 billion. Group net interest income was little changed due to strong deposit growth and proactive balance sheet hedging. Fee income and treasury customer sales both reached new highs. Markets trading income rose due to lower funding costs and a more conducive trading environment.
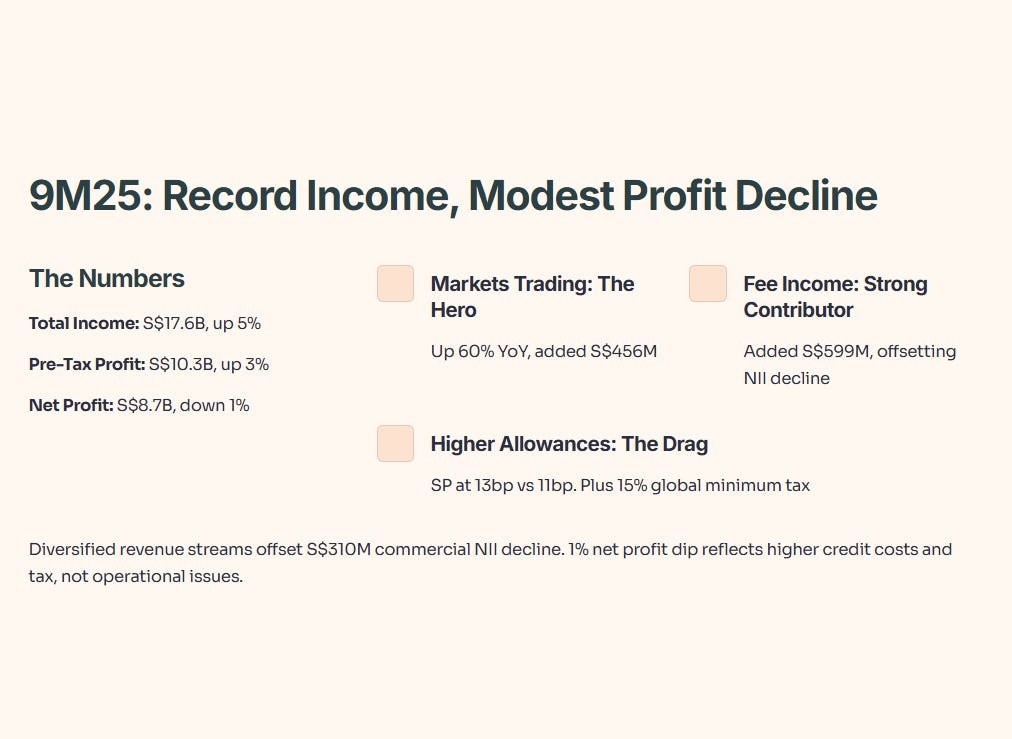
9M25 Pre-Tax Profit: Up 3 percent to a record S$10.3 billion. Total income up 5 percent to a new high of S$17.6 billion, driven by growth in the commercial book and markets trading.
Balance Sheet: Remains strong. Asset quality resilient with NPL ratio stable at 1.0 percent. Specific allowances at 15 basis points for 3Q and 13 basis points for 9M. Allowance coverage at 139 percent, rising to 229 percent after considering collateral. Transitional CET1 ratio at 16.9 percent, fully phased-in at 15.1 percent—both well above regulatory minimums.
Dividend: 3Q total dividend of 75 cents per share, comprising 60 cents ordinary dividend and 15 cents capital return dividend.
Key Takeaway: DBS delivered record income and profit in 3Q, driven by diversified revenue streams. The balance sheet is fortress-strong, and capital ratios provide a comfortable buffer. The dividend payout signals management’s confidence.
Slide 2: 3Q Net Profit Declines 2 Percent Year-Over-Year
The CFO broke down the year-over-year earnings bridge:
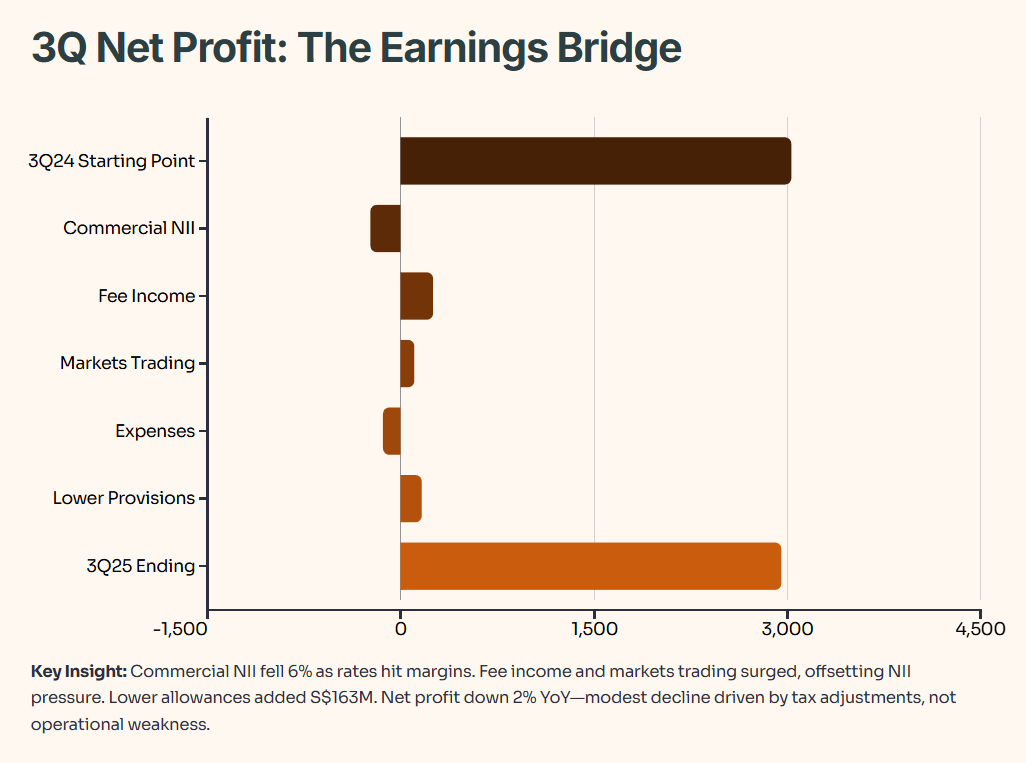
Earnings Bridge (3Q24 to 3Q25):
Starting from 3Q24 net profit of S$3,027 million:
Commercial book net interest income fell 6 percent, reducing earnings by S$238 million (negative impact)
Fee income added S$248 million (positive)
Treasury customer sales and other income added S$61 million (positive)
Markets trading income added S$108 million (positive)
Expenses rose, reducing earnings by S$144 million (negative)
Lower general provision charges added S$49 million (positive)
Lower specific provision charges added S$114 million (positive)
Tax and others reduced earnings by S$55 million (negative)
Arriving at 3Q25 net profit of S$2,954 million
What’s Going On Here: Commercial book net interest income fell 6 percent as lower rates hit lending margins. However, hedging and deposit growth mitigated the decline. Fee income and markets trading surged, offsetting much of the NII pressure. Expenses rose 6 percent, led by higher staff costs—likely reflecting bonus accruals and headcount growth in wealth management and digital banking. The cost-income ratio was 40 percent, slightly higher than the 39 percent for 9M25.
Lower allowances (both GP and SP) added S$163 million to the bottom line, reflecting benign credit conditions. The 2 percent net profit decline is modest and driven by tax and other adjustments, not operational weakness.
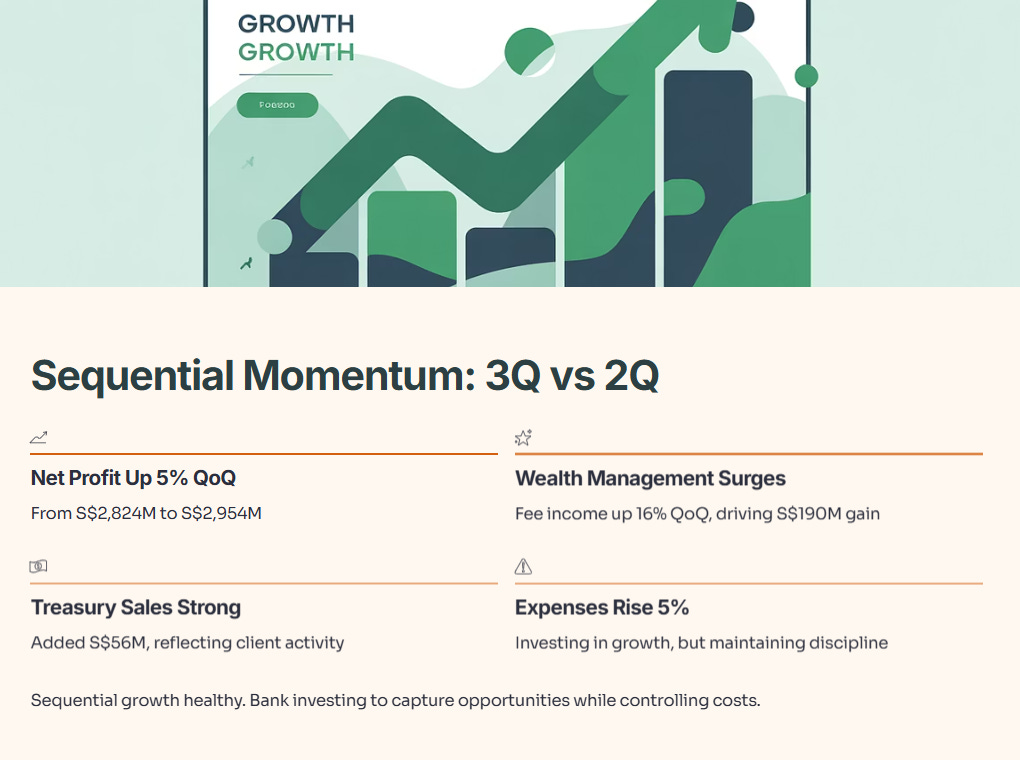
Slide 3: 3Q Net Profit Up 5 Percent Quarter-Over-Quarter
The quarter-over-quarter bridge shows better sequential momentum:
Line Item3Q25 (S$m)QoQ Change (%)Impact
Earnings Bridge (2Q25 to 3Q25):
Starting from 2Q25 net profit of S$2,824 million:
Commercial book and Group net interest income fell 2 percent from lower SORA, reducing earnings by S$67 million (negative)
Fee income (led by wealth management) added S$190 million (positive)
Treasury customer sales and other income added S$56 million (positive)
Markets trading added S$21 million (positive)
Expenses rose, reducing earnings by S$123 million (negative)
GP write-back added S$19 million (positive)
SP stable, adding S$44 million (positive)
Tax and others reduced earnings by S$28 million (negative)
Arriving at 3Q25 net profit of S$2,954 million
Key Insight: Sequential growth was driven by fee income and treasury customer sales. Wealth management fees surged (up 16 percent quarter-over-quarter), reflecting buoyant markets and client activity. The 5 percent sequential net profit growth is healthy, but expenses also rose 5 percent, suggesting the bank is investing to capture growth opportunities.
Slide 4: 9M Total Income and Pre-Tax Profit Reach New Highs
For the nine-month period:
Earnings Bridge (9M24 to 9M25):
Starting from 9M24 net profit of S$8,786 million, adjusted for one-time items to S$8,767 million:
Commercial book net interest income fell 3 percent, reducing earnings by S$310 million (negative)
Fee income added S$599 million (positive)
Treasury customer sales and other income added S$32 million (positive)
Markets trading added S$456 million (positive)
Expenses rose, reducing earnings by S$377 million (negative)
Higher general provision charges reduced earnings by S$109 million (negative)
Higher specific provision charges reduced earnings by S$342 million (negative)
Tax and others added S$19 million (positive)
Arriving at 9M25 net profit of S$8,675 million
What This Tells You: Markets trading income surged 60 percent year-over-year, adding S$456 million. Fee income contributed S$599 million. These two sources more than offset the S$310 million decline in commercial book NII. However, higher allowances (SP at 13 basis points for 9M25 versus 11 basis points for 9M24) weighed on profit. The 1 percent net profit decline for 9M is largely due to higher credit costs and the 15 percent global minimum tax implementation.
Slide 5: 3Q Group Net Interest Income Lower QoQ and Little Changed YoY
This slide shows the net interest margin and income trends:
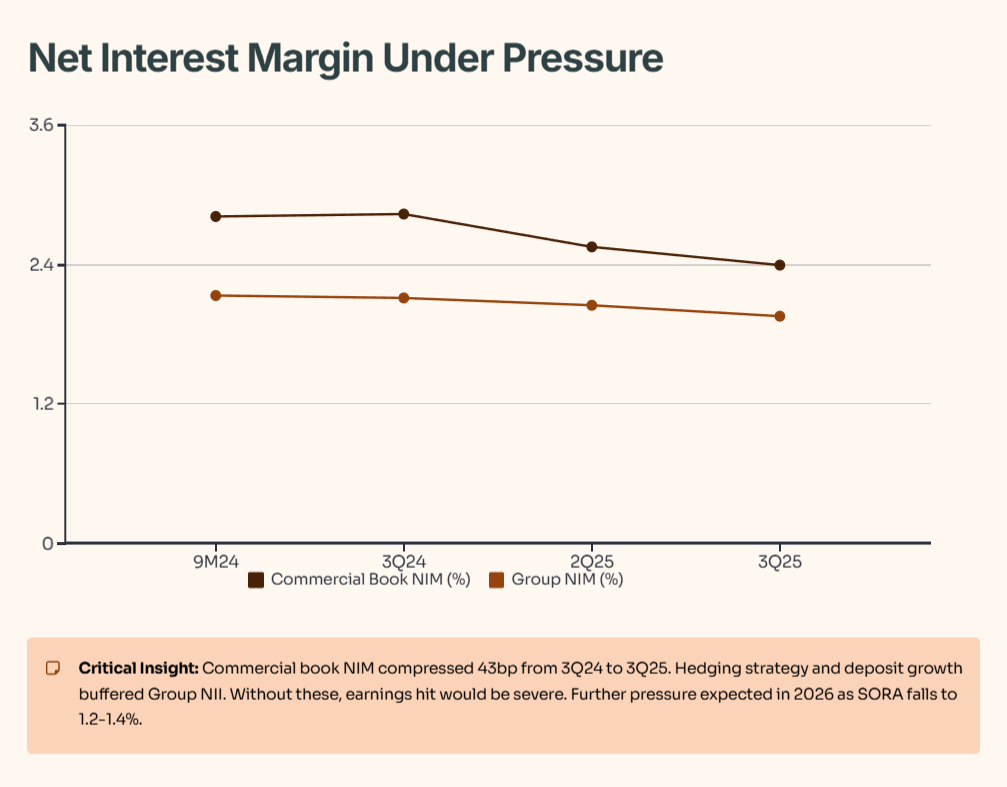
Commercial Book NII: Fell S$199 million from 3Q24 to 3Q25. The commercial book NIM compressed from 2.83 percent to 2.40 percent (43 basis points), reflecting lower lending rates. However, Group NII was little changed year-over-year due to hedging and deposit growth.
Markets Trading NII: Contributed S$20 million in 3Q25, down from S$23 million in 9M25. The negative S$516 million shown for 9M24 to 9M25 represents the drag from funding costs, which improved in 2025.
Why This Matters: DBS’s hedging strategy and deposit growth buffered the NII decline. Without these, the 43-basis-point NIM compression would have translated to a much larger earnings hit. As SORA continues to fall (currently around 1.2 to 1.4 percent, down from 3.0 percent plus in 2023), further NIM pressure is expected in 2026.
Slide 6: Deposits Up 3 Percent QoQ, 9 Percent Over 9M
DBS’s deposit franchise showed robust growth:
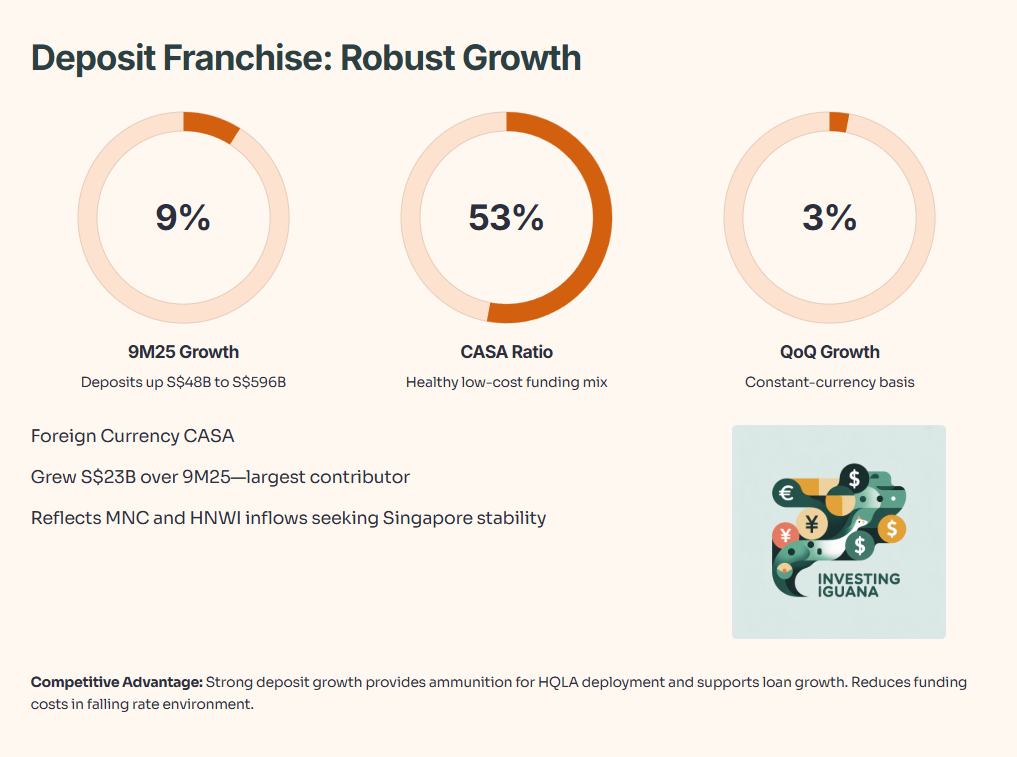
Constant-Currency Growth: Deposits grew 3 percent quarter-over-quarter and 9 percent over 9M25, both led by current and savings account (CASA) inflows. The CASA ratio stood at 53 percent, a healthy mix indicating low-cost funding.
Foreign Currency CASA: Grew S$23 billion over 9M, the largest contributor. This reflects inflows from multinational corporations and high-net-worth individuals seeking Singapore’s stable banking environment.
What This Means: Strong deposit growth gives DBS ammunition to deploy into higher-yielding assets (HQLA) and supports loan growth. It also reduces funding costs, which is critical in a falling rate environment. For investors, this deposit strength is a key competitive advantage over regional peers.
Slide 7: Loans Little Changed QoQ, Surplus Deposits Deployed to HQLA
Loan growth was muted in 3Q25:
CategoryAs at Sep 25 (S
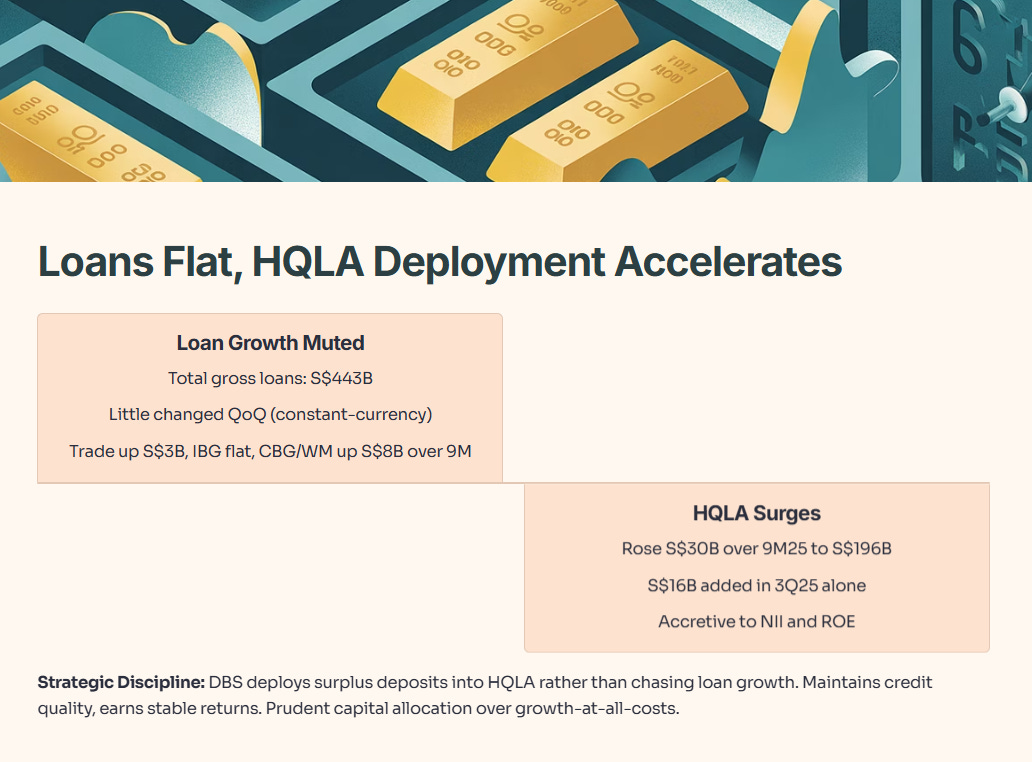
HQLA Deployment: High Quality Liquid Assets rose S$30 billion over 9M25 to S$196 billion, with S$16 billion added in 3Q25 alone. DBS deployed surplus deposits into HQLA, which is accretive to NII and ROE.
Loan Growth: Loans were little changed quarter-over-quarter in constant-currency terms. Growth in trade and wealth management loans was moderated by lower non-trade corporate loans. This suggests corporate credit demand remains tepid, likely due to uncertainty around tariffs and global growth.
Strategic Implication: By deploying surplus deposits into HQLA rather than chasing loan growth, DBS maintains discipline on credit quality and earns stable returns. For SGX investors, this reflects prudent capital allocation rather than growth-at-all-costs mentality.
Slide 8: 3Q and 9M Fee Income Rise to Record, Led by Wealth Management
Fee income delivered strong growth:
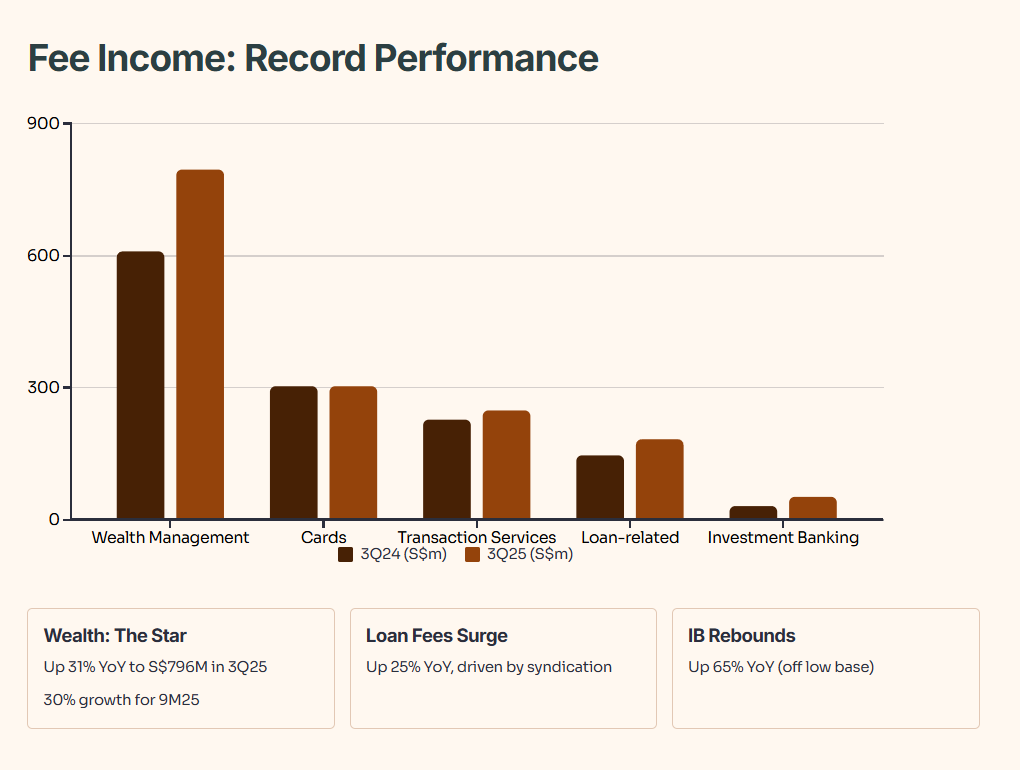
Wealth Management: Surged 31 percent year-over-year in 3Q25 to S$796 million, and 30 percent for 9M25 to S$2,169 million. This reflects buoyant equity markets, active client trading, and net new money inflows.
Loan-Related Fees: Rose 25 percent year-over-year in 3Q25, driven by higher loan volumes and syndication activity.
Investment Banking: Jumped 65 percent year-over-year in 3Q25, off a low base in 3Q24. This reflects the capital markets revival mentioned in the CEO’s presentation.
Cards and Transaction Services: Grew modestly, reflecting steady consumer and corporate activity.
Bottom Line: Wealth management is the star performer. DBS’s ability to capture client flows and generate fee income is a key differentiator. For investors focused on recurring revenue, this is a bright spot.
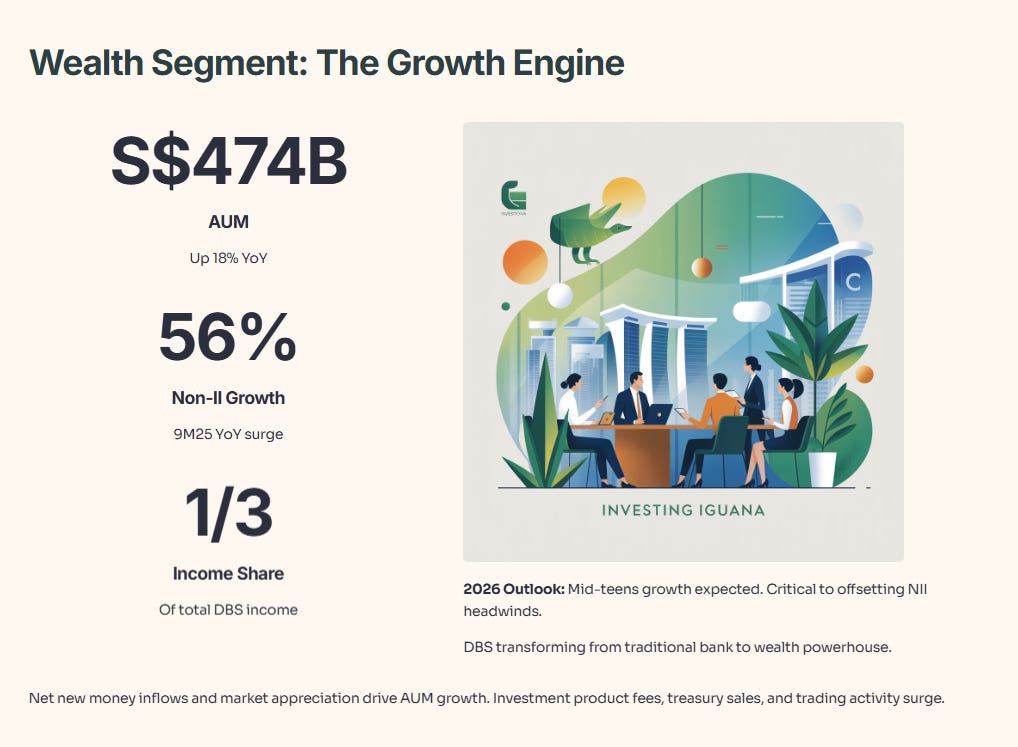
Slide 9: Record 9M Wealth Segment Income, AUM at New High
The wealth segment delivered record performance:
A quick note on the table: The 9M25 ‘Total Income’ figure appears to be a formatting quirk in the original deck. The line items (NII of S$1,982m and Non-II of S$3,978m) sum to approximately S$5.96 billion. Regardless of this, the key point is clear.
AUM Growth: Assets under management rose 18 percent year-over-year to S$474 billion as of September 2025 (excluding transitory flows). This reflects net new money inflows and market appreciation.
Non-Interest Income: Surged 56 percent for 9M25, driven by higher investment product fees, treasury customer sales, and trading activity.
Why This Matters: The wealth segment now generates nearly one-third of DBS’s total income. With mid-teens growth expected in 2026, this segment will be critical to offsetting NII headwinds. For SGX investors, this underscores DBS’s transformation from a traditional bank to a wealth powerhouse.
Slide 10: 3Q Customer-Driven Non-Interest Income Rises 22 Percent YoY, 9M Up 17 Percent
The CFO broke out customer-driven non-interest income:
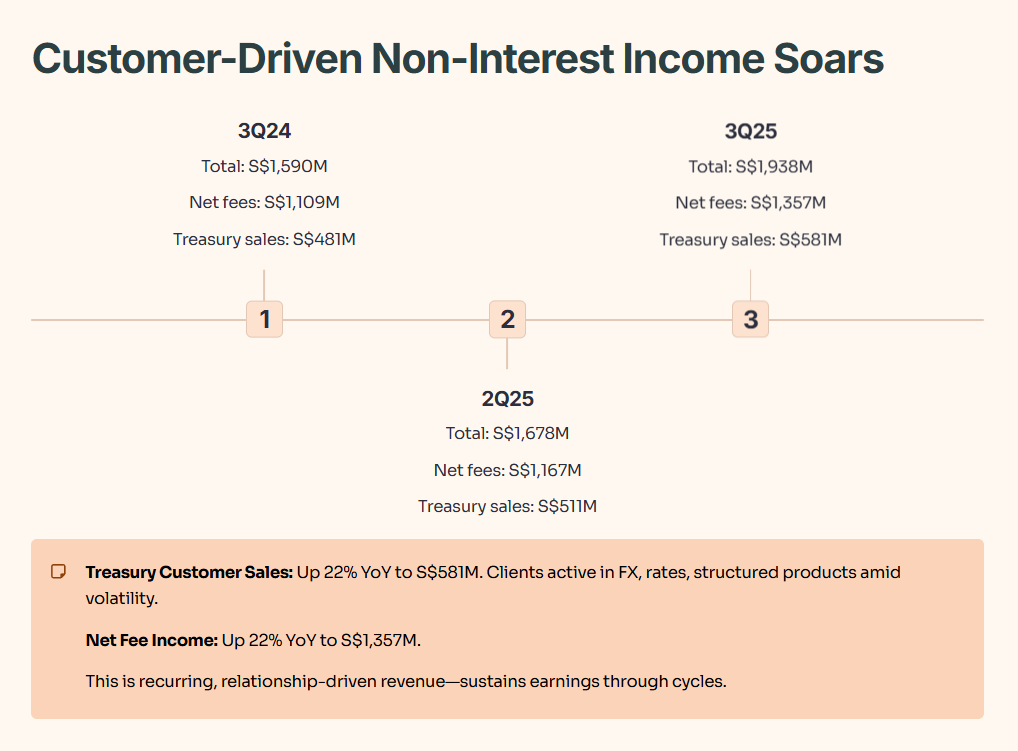
Treasury Customer Sales: Rose 22 percent year-over-year in 3Q25 to S$581 million, reflecting higher foreign exchange, rates, and structured product volumes. Clients were active repositioning portfolios amid rate volatility.
Net Fee Income: Grew 22 percent year-over-year in 3Q25 to S$1,357 million.
Interpretation: Customer-driven non-interest income (which excludes markets trading) is growing at a healthy clip. This is recurring, relationship-driven revenue—the kind that sustains earnings through cycles.
Slide 11: 9M Cost-Income Ratio Stable at 39 Percent
Expense discipline remained intact:
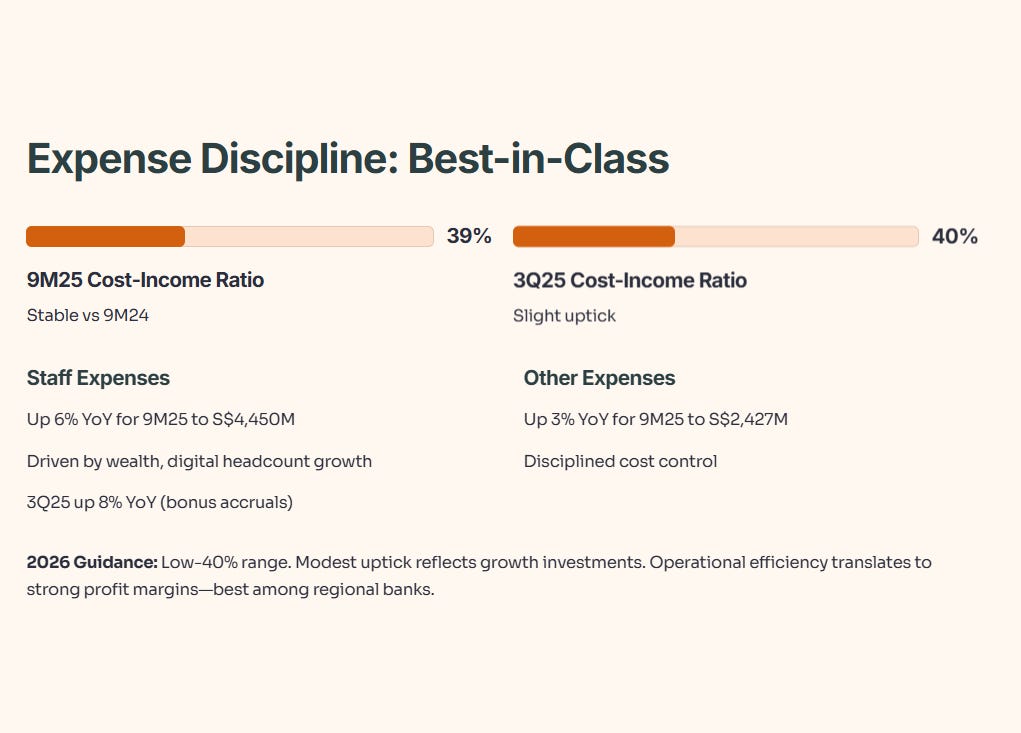
Staff Expenses: Rose 6 percent year-over-year for 9M25 to S$4,450 million, driven by headcount growth in wealth management, digital banking, and normal salary increments. Staff expenses in 3Q25 rose 8 percent year-over-year, likely reflecting bonus accruals.
Other Expenses: Grew 3 percent year-over-year for 9M25 to S$2,427 million, suggesting disciplined cost control.
Cost-Income Ratio: Stable at 39 percent for 9M25 and 40 percent for 3Q25. DBS’s guidance for 2026 is low-40 percent range, implying a modest uptick.
What This Means: DBS is investing in growth (wealth, digital), but maintaining expense discipline. The cost-income ratio is best-in-class among regional banks. For investors, this operational efficiency translates to strong profit margins.
Slide 12: NPL Ratio Stable at 1.0 Percent
Asset quality remained resilient:
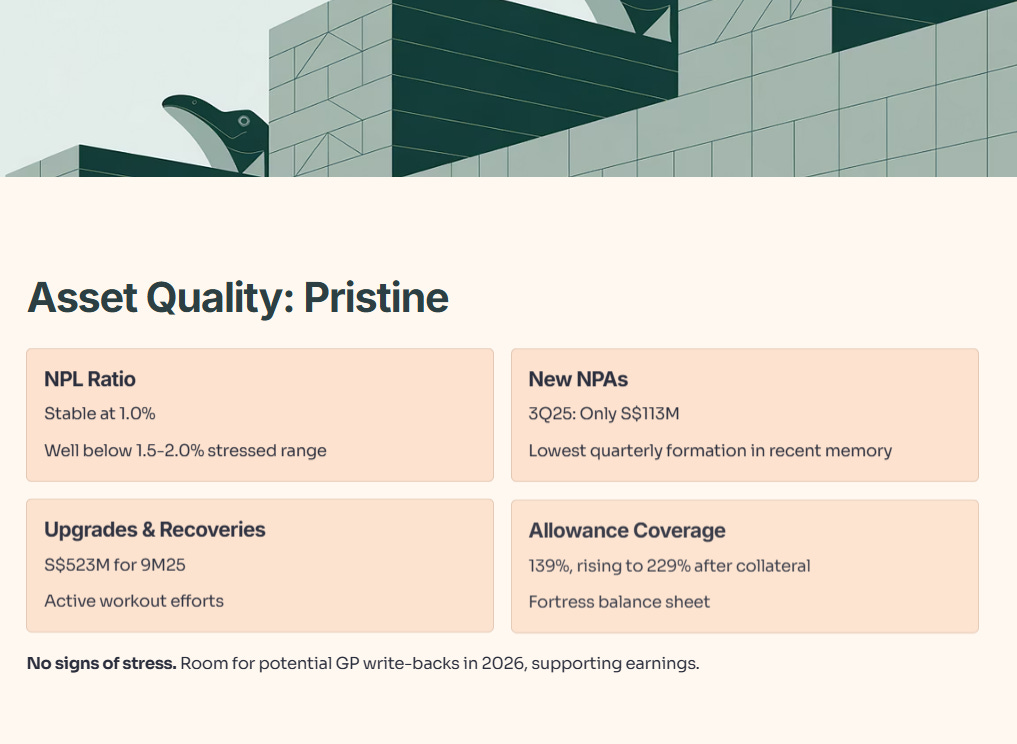
New NPAs: For Institutional Banking Group (IBG) and others, new NPAs totaled S$449 million for 9M25, down from S$739 million in 9M24. In 3Q25, new NPAs were only S$113 million—the lowest quarterly formation in recent memory. This suggests credit quality is benign.
Upgrades and Recoveries: Totaled S$523 million for 9M25, indicating active workout efforts.
NPL Ratio: Stable at 1.0 percent, well below the 1.5 to 2.0 percent range seen in stressed periods.
Bottom Line: Asset quality is pristine. No signs of stress. This gives DBS room to potentially write back general provisions in 2026, which would support earnings.
Slide 13: 3Q SP at 15bp, 9M at 13bp
Specific provision charges remained low:
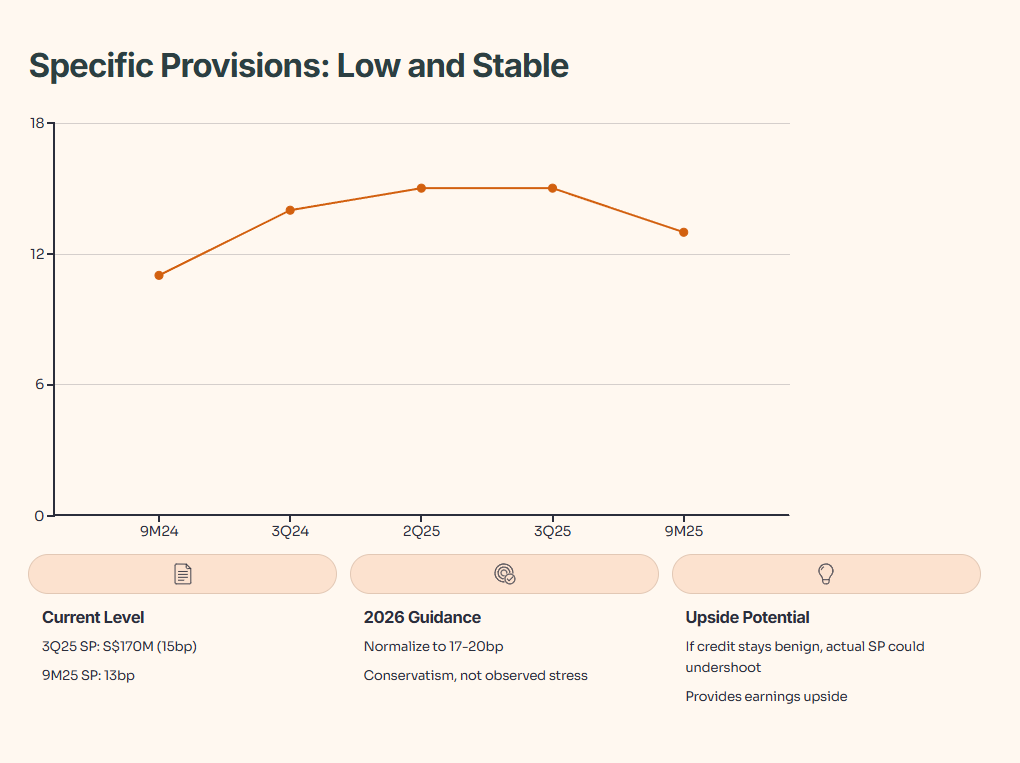
3Q25 SP: Specific provisions were S$170 million, or 15 basis points of loans. For 9M25, SP was 13 basis points.
Normalization Expected: Management guided for SP to normalize to 17 to 20 basis points in 2026. This implies an uptick from current levels, but still below the long-term average of 20 to 25 basis points. The guidance reflects conservatism rather than observed stress.
What to Watch: If credit conditions remain benign, actual SP could come in below guidance, providing earnings upside.
Slide 14: Allowance Coverage Ratio at 139 Percent
DBS’s provisioning buffers are robust:
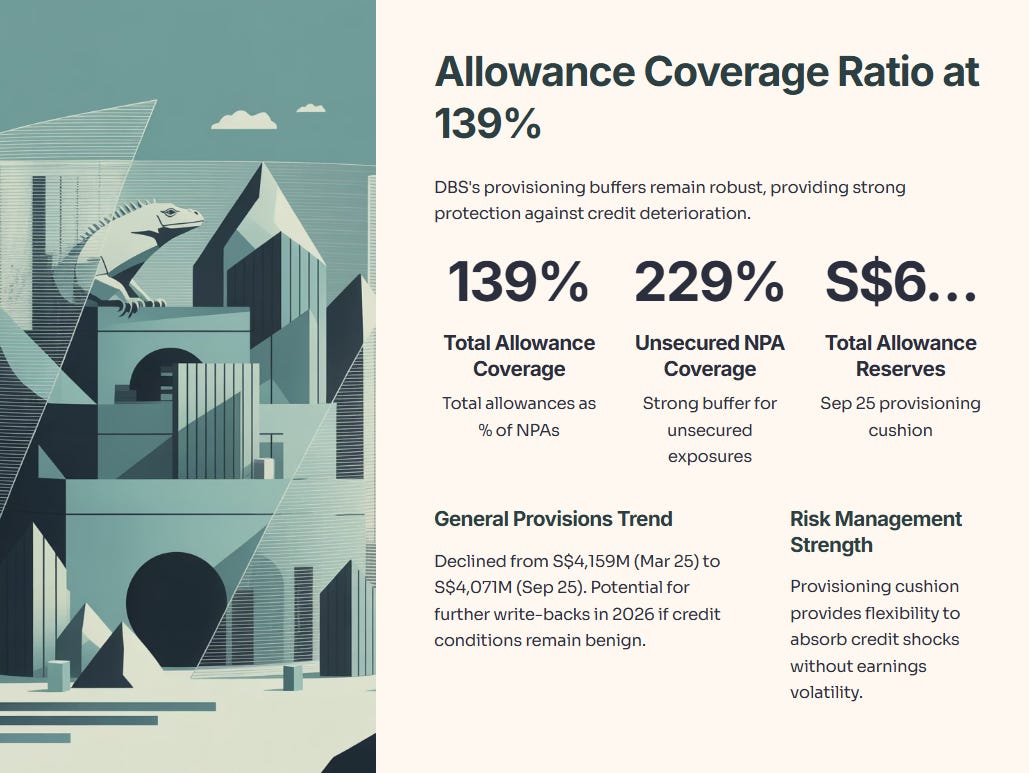
Coverage Ratios: Total allowances cover 139 percent of NPAs and 229 percent of unsecured NPAs. These are healthy buffers, suggesting DBS is well-prepared for any credit deterioration.
General Provisions: Declined slightly from S$4,159 million in Mar 25 to S$4,071 million in Sep 25, reflecting modest GP write-backs. Management noted potential for further GP write-backs in 2026 if credit conditions remain benign.
Implication: The provisioning cushion gives DBS flexibility to absorb credit shocks without earnings volatility. For investors, this is a risk management strength.
Slide 15: Strong CET1 and Leverage Ratios
Capital ratios remained strong:
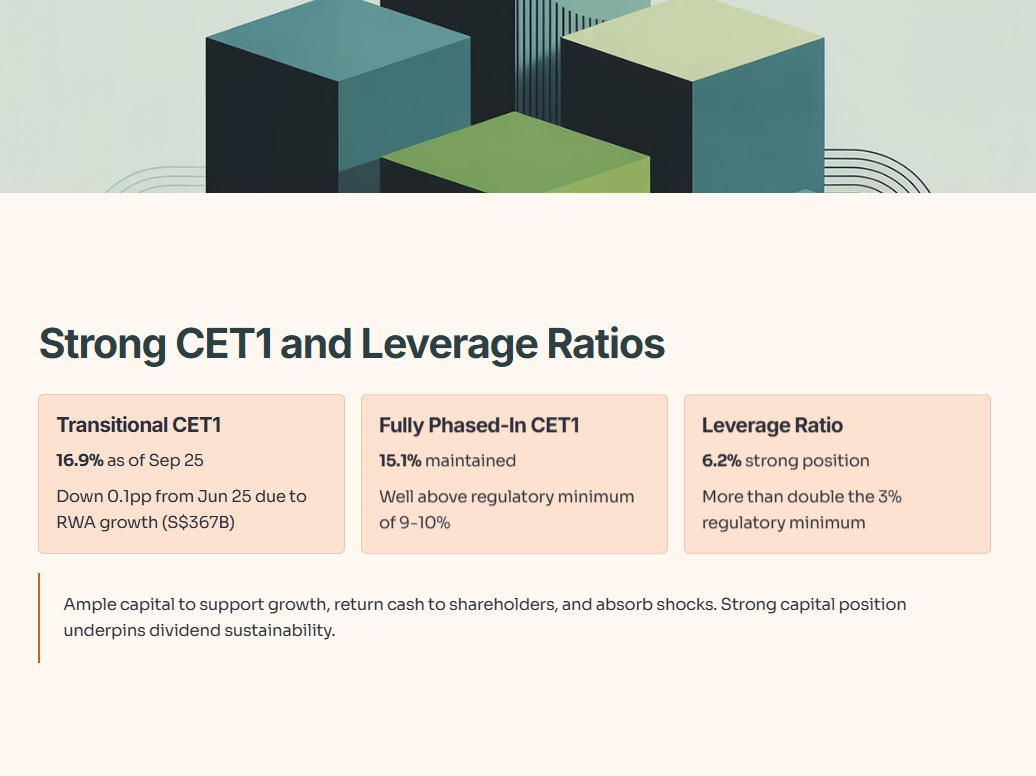
Transitional CET1: Stood at 16.9 percent as of Sep 25, down 0.1 percentage point from Jun 25. The decline was due to RWA growth (up from S$355 billion to S$367 billion) as Basel III reforms phased in.
Fully Phased-In CET1: At 15.1 percent, well above the regulatory minimum of around 9 to 10 percent (including buffers). This provides a comfortable buffer for dividends and capital deployment.
Leverage Ratio: At 6.2 percent, more than double the regulatory minimum of 3 percent.
What This Means: DBS has ample capital to support growth, return cash to shareholders, and absorb shocks. The strong capital position underpins the dividend sustainability.
Slide 16: 3Q Total Dividend of 75 Cents Per Share
DBS declared a generous dividend:
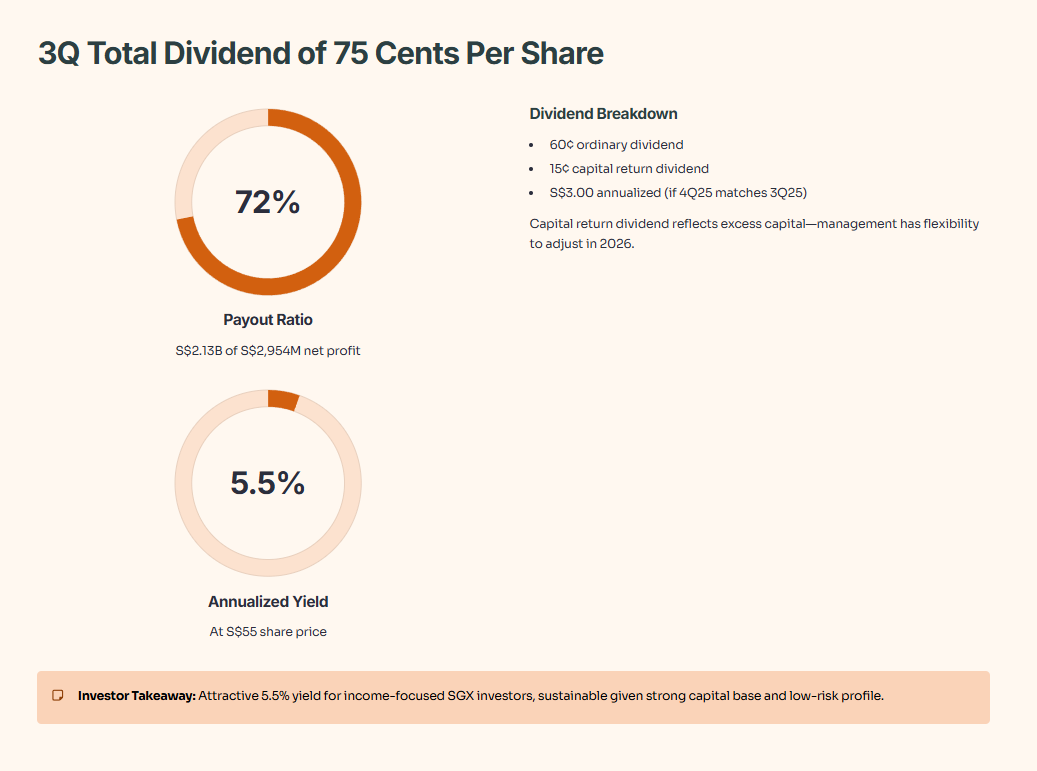
Total Dividend: For 3Q25, DBS declared 75 cents per share, comprising 60 cents ordinary dividend and 15 cents capital return dividend. Annualized, this implies S$3.00 per share in dividends for 2025 (if 4Q25 matches 3Q25).
Dividend Payout: The S$2.13 billion payout for 3Q25 represents approximately 72 percent of net profit (S$2,954 million). This is a healthy payout ratio, sustainable given the strong capital base.
Capital Return Dividend: The 15 cents capital return dividend reflects excess capital. Management has flexibility to increase or maintain this in 2026, depending on capital deployment opportunities.
Investor Takeaway: At a share price around S$55, the 75-cent quarterly dividend implies a yield of approximately 5.5 percent annualized (S$3.00 / S$55). This is attractive for income-focused SGX investors, especially given the low-risk profile.
Slide 17: Summary—Delivered Record Third-Quarter and Nine-Month Performance
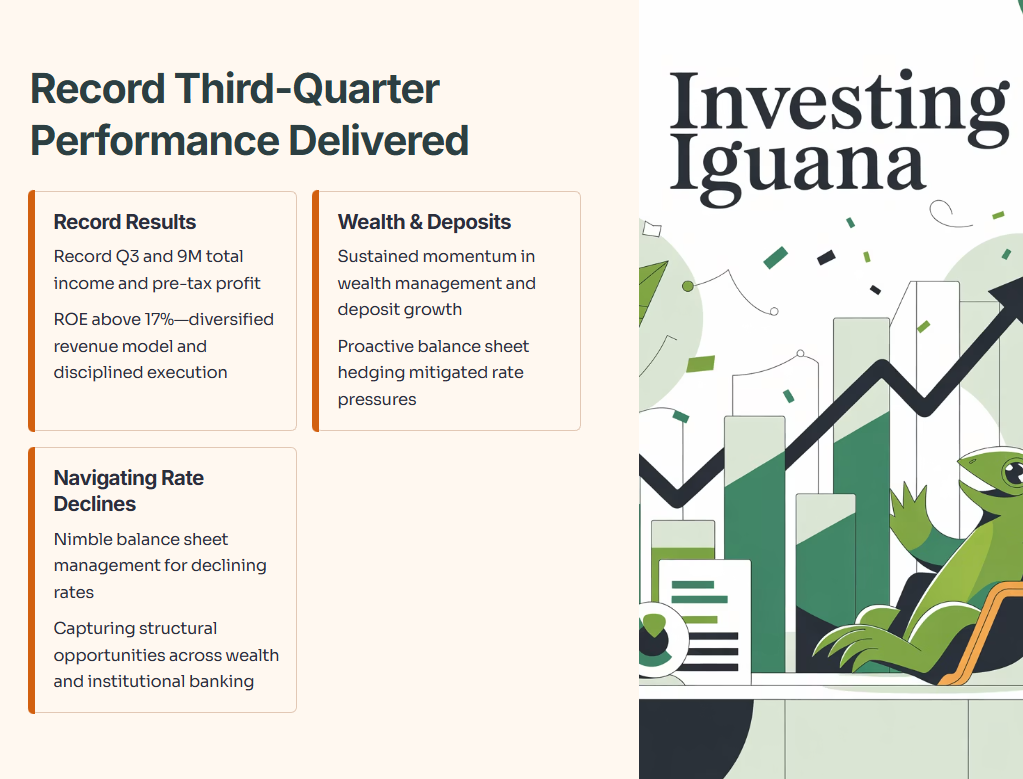
The CFO summarized the quarter:
Record Performance: DBS delivered record third-quarter and nine-month total income and pre-tax profit, with ROE above 17 percent. This reflects the bank’s diversified revenue model and disciplined execution.
Wealth Management and Deposit Growth: Sustained strong momentum in wealth management and deposit growth. Proactive balance sheet hedging mitigated external rate pressures.
Navigating Rate Declines: DBS will continue to navigate declining rates in the coming year with nimble balance sheet management and the ability to capture structural opportunities across wealth management and institutional banking.

Investor Guidance and Iggy’s Assessment
Now let’s synthesize everything and deliver clear guidance for SGX investors.
