


🔍 The Deep Dive: Analyzing the FY2025 Results
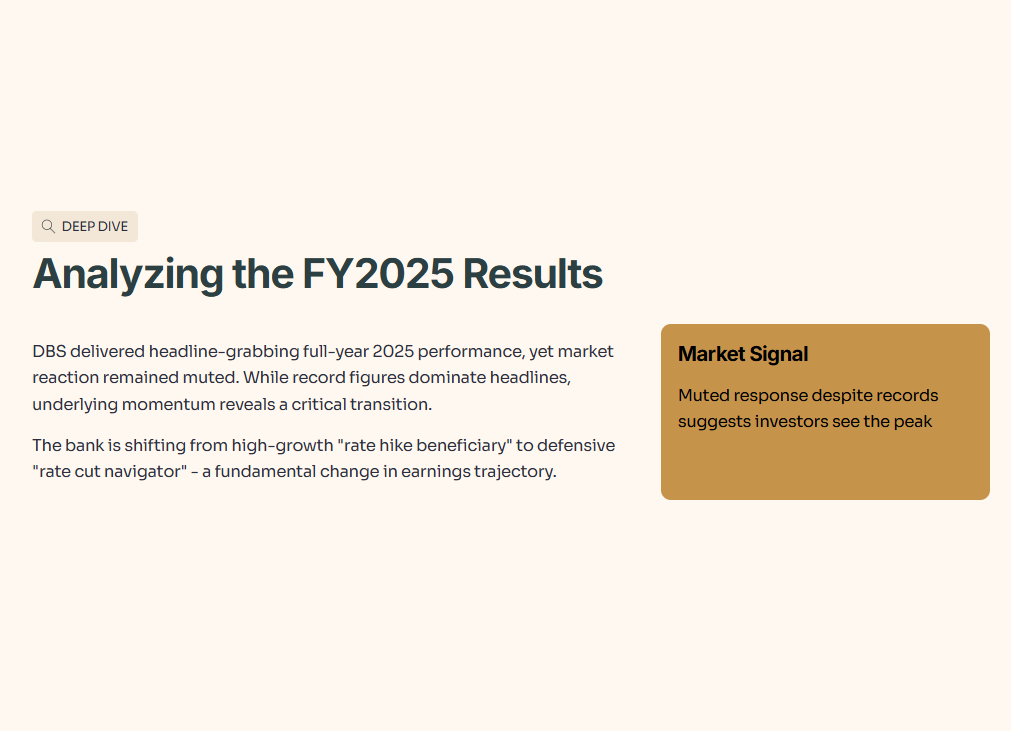

DBS Group Holdings delivered a headline-grabbing performance for the full year 2025, yet the market’s reaction was tellingly muted. While the bank trumpeted record figures, the underlying momentum suggests a transition from a high-growth “rate hike beneficiary” to a more defensive “rate cut navigator.”
In This Article:
The “Record” Headline vs. The Q4 Reality
The NIM Squeeze & The Deposit Fortress
Wealth Management to the Rescue
The Real Estate “Hiccup”
Reality Check: The Institutional View
Performance Scorecard
The Bottom Line
InvestingPro Reality Check
Iggy's Verdict
About Iggy & the Elite 150
🦎 Join the Inner Circle: Secure Your Zero-Day Advantage
In the Singapore market, the gap between a winning entry and “holding the bag” is often just 48 hours. While 5,800+ readers wait two weeks for the “Old News” version, my Inner Circle gets the data while the opportunity is still live.
🚨 Stop Trading on a Delay
Free subscribers wait 14 days to see my analysis. In this jungle, if you aren’t first, you’re lunch. Get the data while it’s fresh.
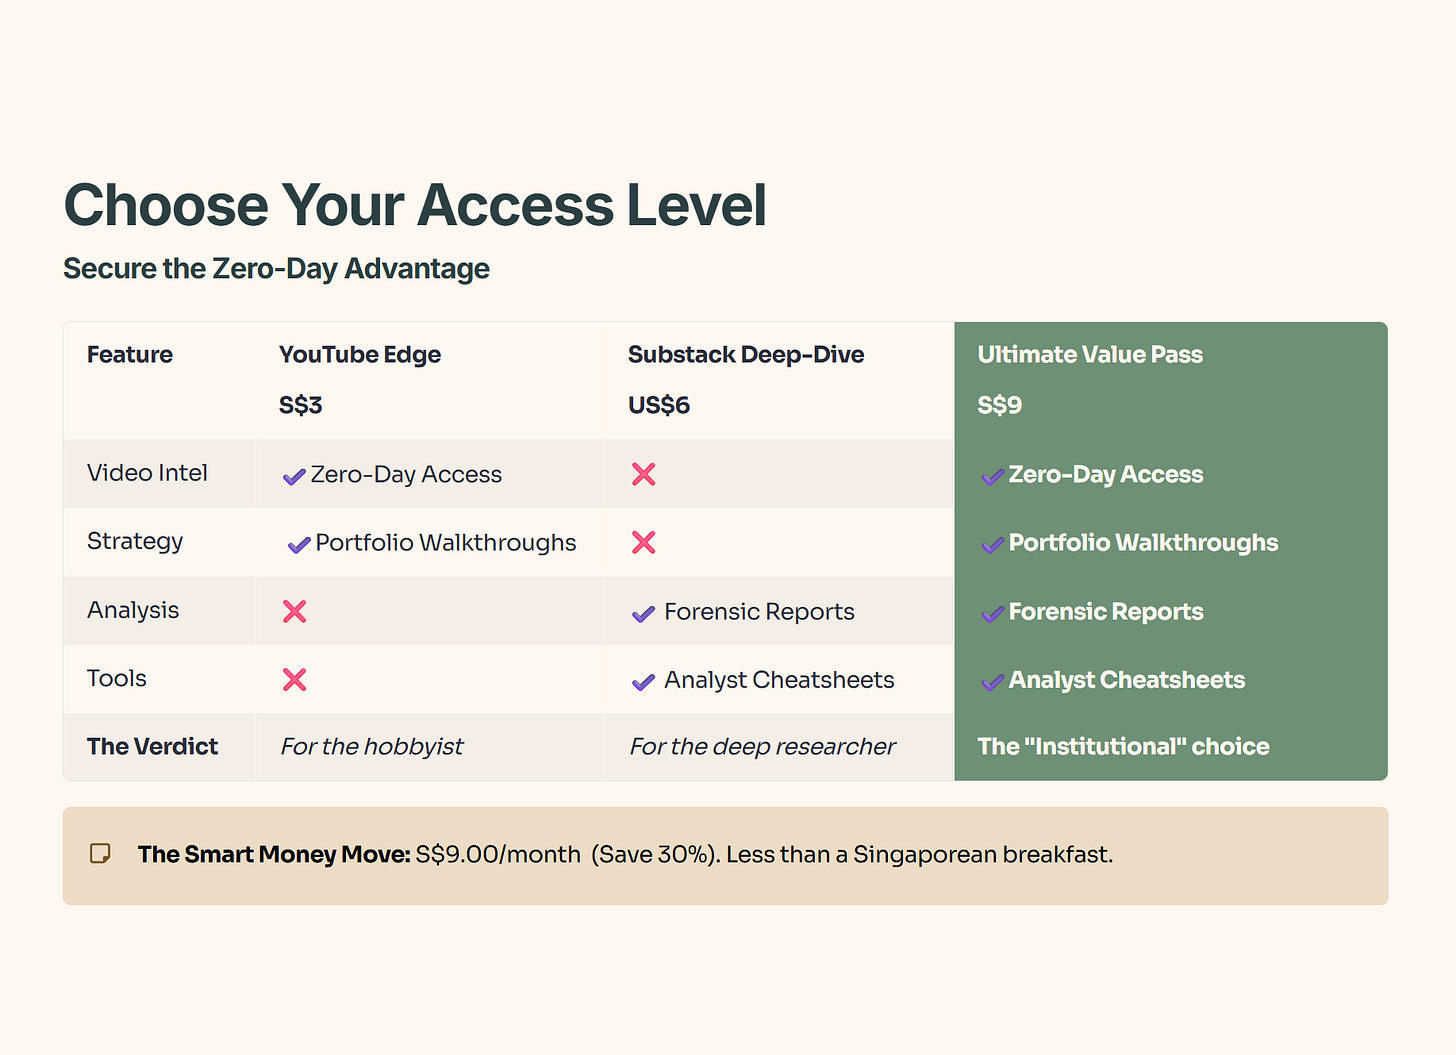
Choose Your Edge:
⚡ Zero-Day Access: Watch every deep-dive video the second it’s rendered. No delays, no missed entries.
📂 The Forensic Vault: Get the full forensic reports and portfolio walkthroughs where I strip away the corporate hype to reveal the hard math behind every Singapore blue chip.
💎 The “Smart Money” Bundle: Get the full S$9/mo Pass (YouTube + Substack). It’s less than the cost of two coffees at Toast Box to trade with the same data as the pros.
[👉Join 150+ Investors in the Inner Circle Here]
The “Record” Headline vs. The Q4 Reality
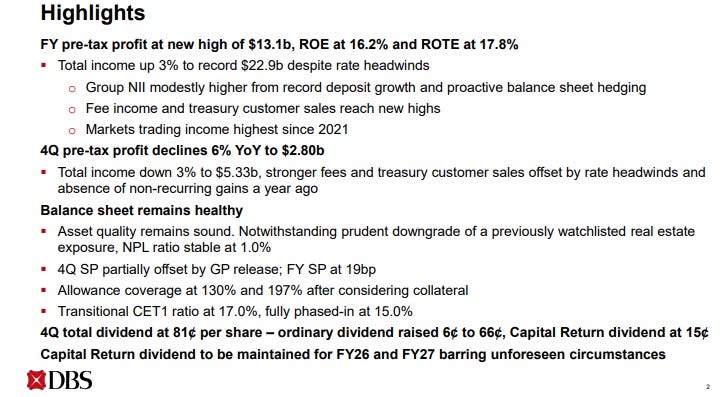
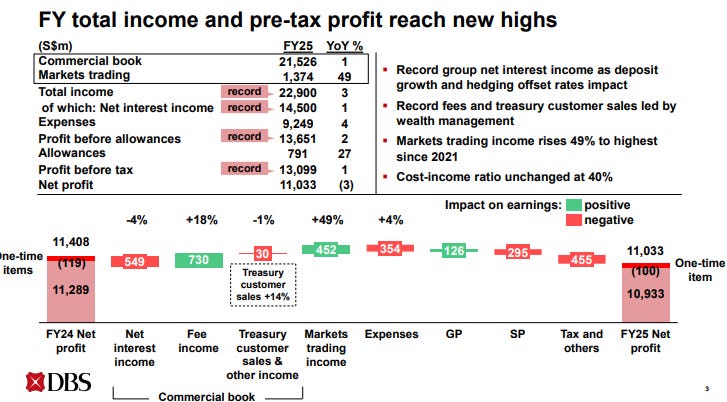
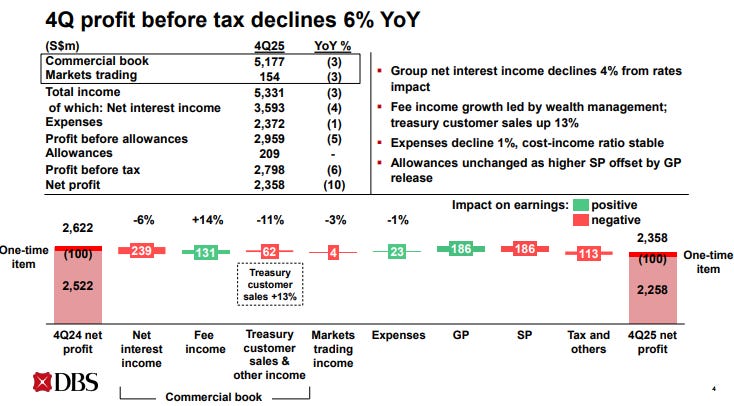
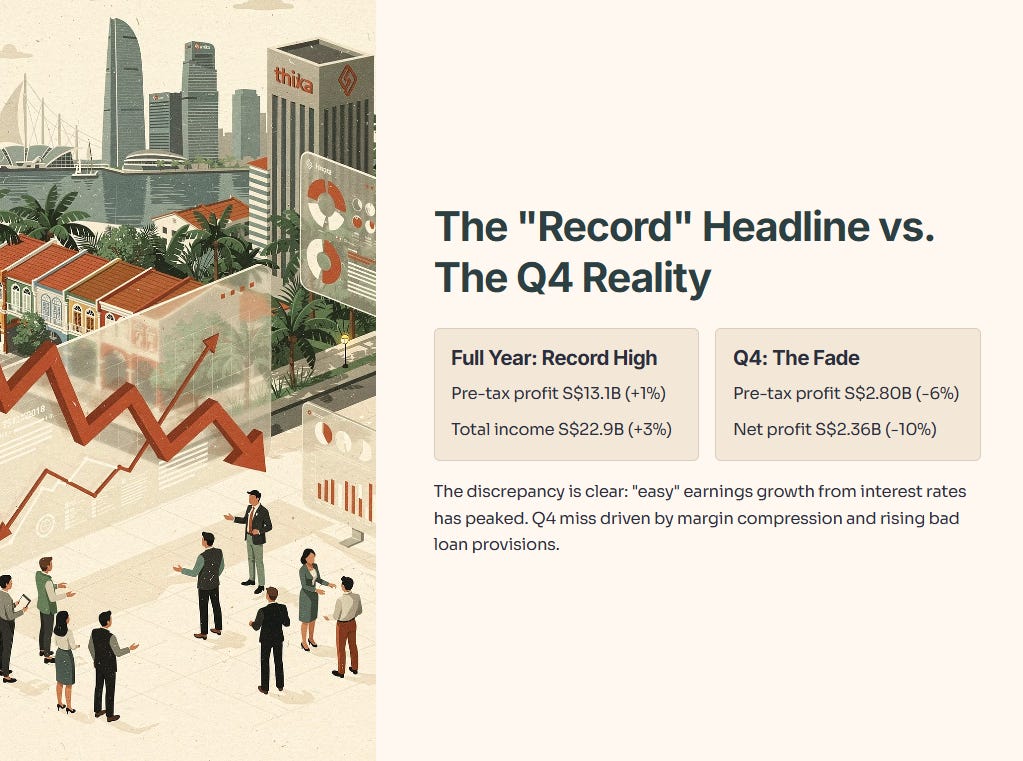
DBS reported a record full-year pre-tax profit of S$13.1 billion, representing a 1% increase. Total income also reached a new high of S$22.9 billion, up 3% despite significant rate headwinds. However, the luster fades when looking at the fourth quarter specifically. Pre-tax profit for the quarter declined 6% to S$2.80 billion, and net profit fell 10% to S$2.36 billion.
This discrepancy highlights a clear trend: the “easy” earnings growth driven by interest rates has peaked. The Q4 miss was driven by tightening margins and a jump in specific provisions for bad loans.
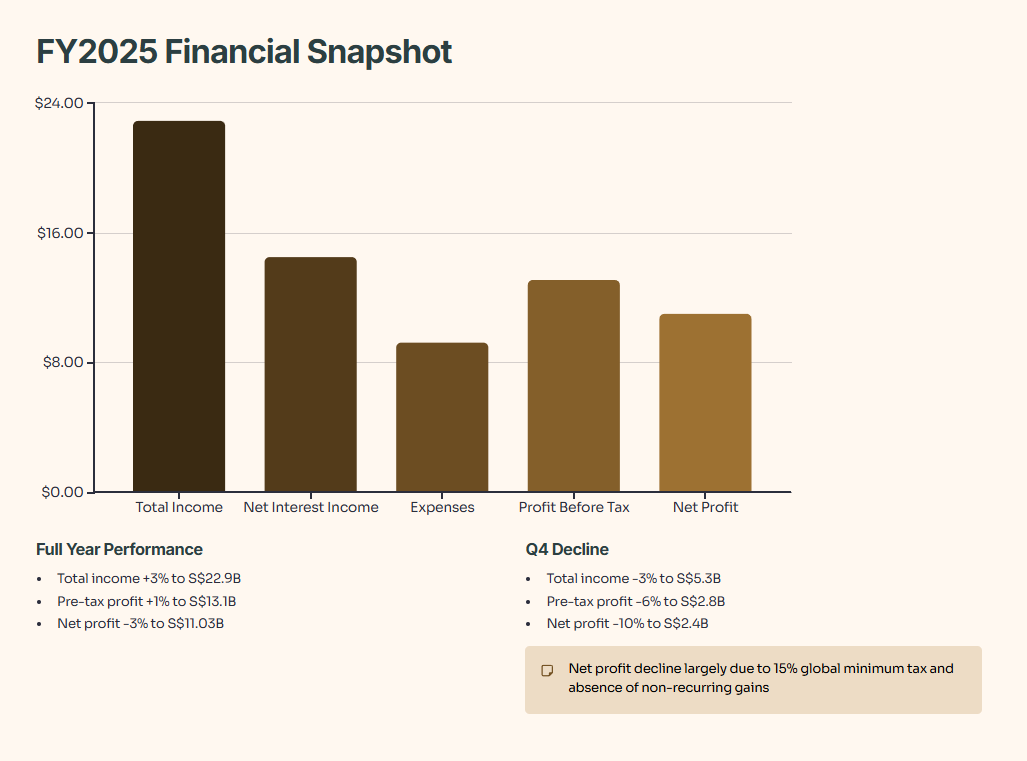
Note: The 3% decline in full-year net profit to S$11.03 billion is largely due to the impact of the global 15% minimum tax and the absence of non-recurring gains from the previous year.
The NIM Squeeze & The Deposit Fortress
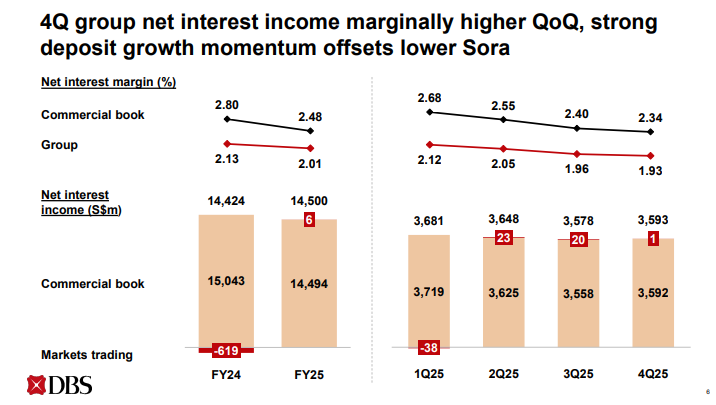
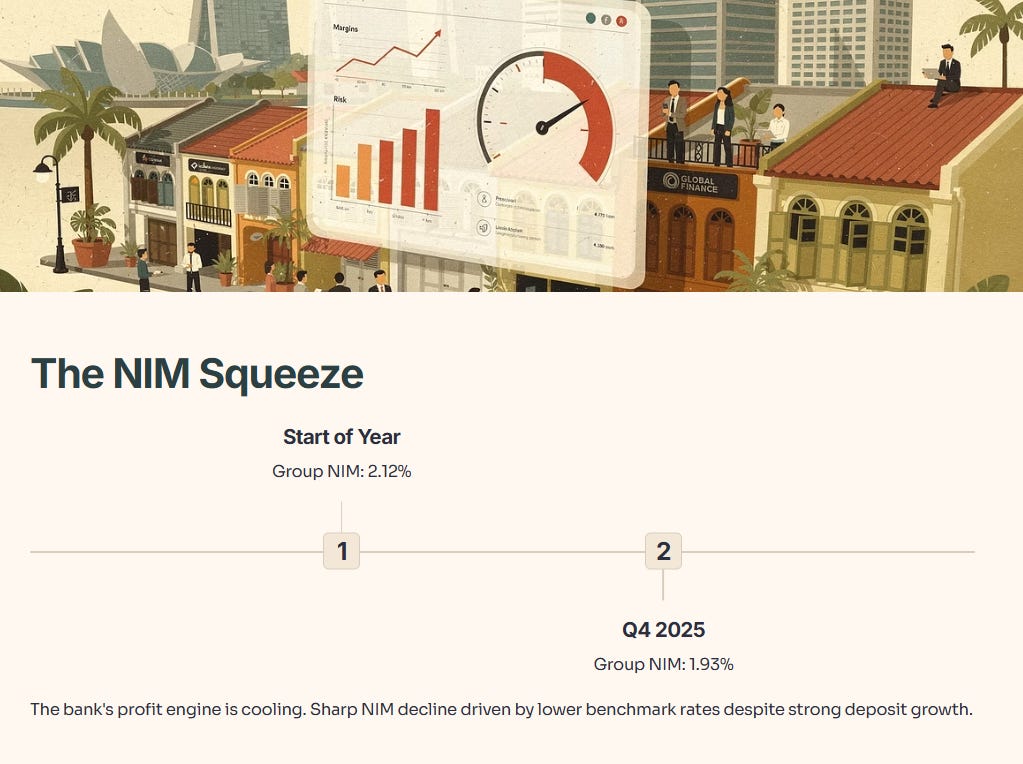
The engine of a bank’s profit is its Net Interest Margin (NIM). For DBS, this engine is cooling. The Group NIM dropped to 1.93% in the fourth quarter, a sharp decline from the 2.12% seen at the start of the year. Management noted that while deposit growth was strong, it was offset by lower benchmark rates.
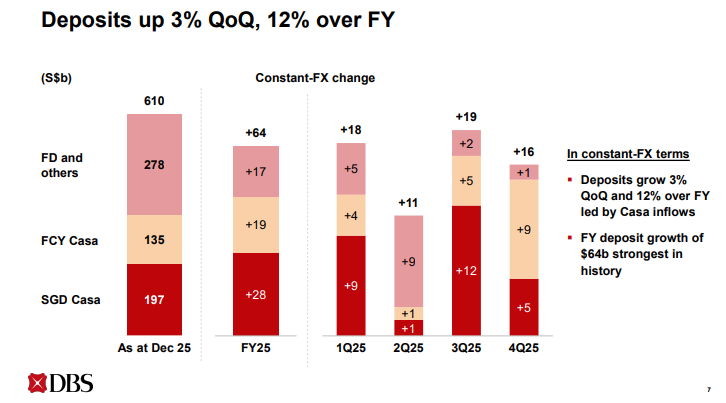
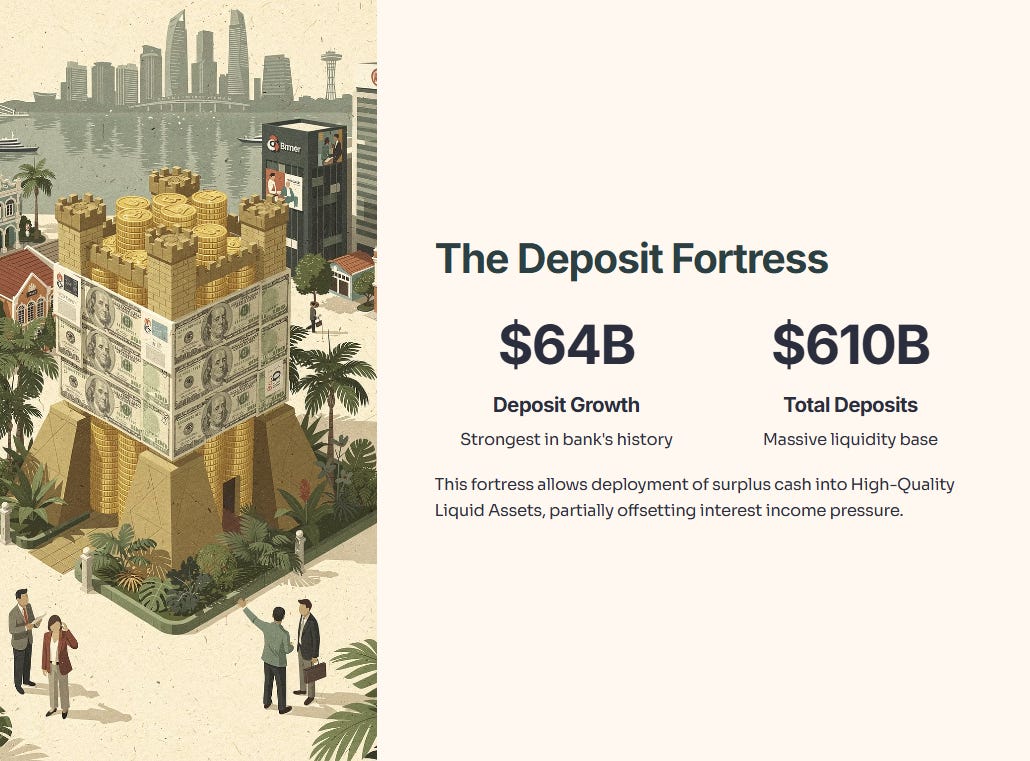
On the bright side, DBS’s deposit franchise remains a “fortress.” Full-year deposit growth of S$64 billion was the strongest in the bank’s history, bringing total deposits to S$610 billion. This massive liquidity allows the bank to deploy surplus cash into High-Quality Liquid Assets, partially offsetting the pressure on interest income.
Wealth Management to the Rescue
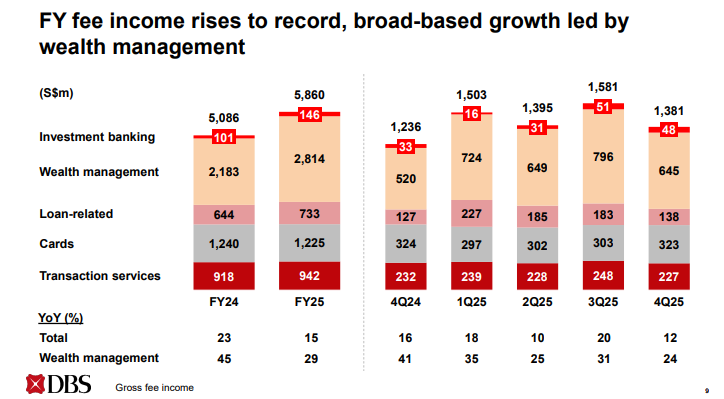
As interest income plateaus, DBS is leaning heavily on its fee-based businesses. Wealth Management remains the star performer, with segment income hitting a new high of S$5.68 billion for the year, up 9%.
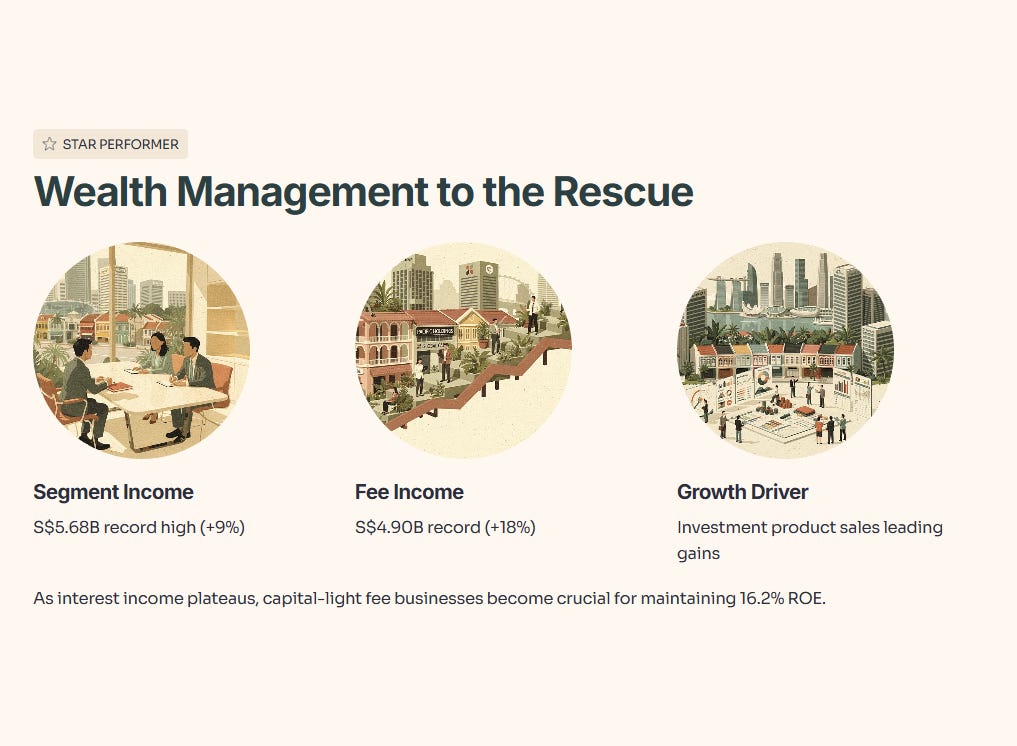
Total fee income rose to a record S$4.90 billion, a broad-based 18% increase led by investment product sales. This “capital-light” income is crucial for maintaining a high Return on Equity, which stood at a healthy 16.2% for the full year.
The Real Estate “Hiccup”
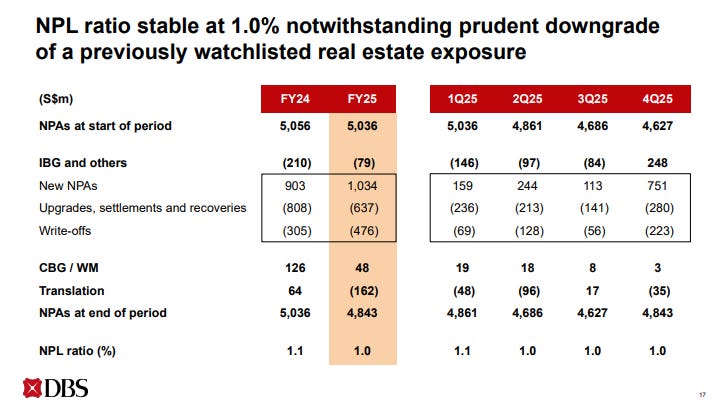
Asset quality remains generally sound, with a non-performing loan (NPL) ratio of 1.0%. However, specific allowances for credit losses surged in the final quarter. The bank prudently downgraded a previously watchlisted real estate exposure, causing specific allowances for loans to jump to 36 basis points in the final quarter, compared to an average of 19 basis points for the full year.
🛡️ Reality Check: The Institutional View
The slides say one thing, but what do the institutional models say?
I pulled the institutional fair value model and it spits out a number most DBS holders won’t like—plus one red flag that changes how I’d size this position
