DBS Is About 14% Away From My Dividend Hurdle. UOB Is 27% Away. OCBC Is 67% Away. 🦖
How Far Each of Singapore’s Three Banks Sits From a 4.7% Income Hurdle, Measured in Dividend Per Share at the 2 October 2026 Close
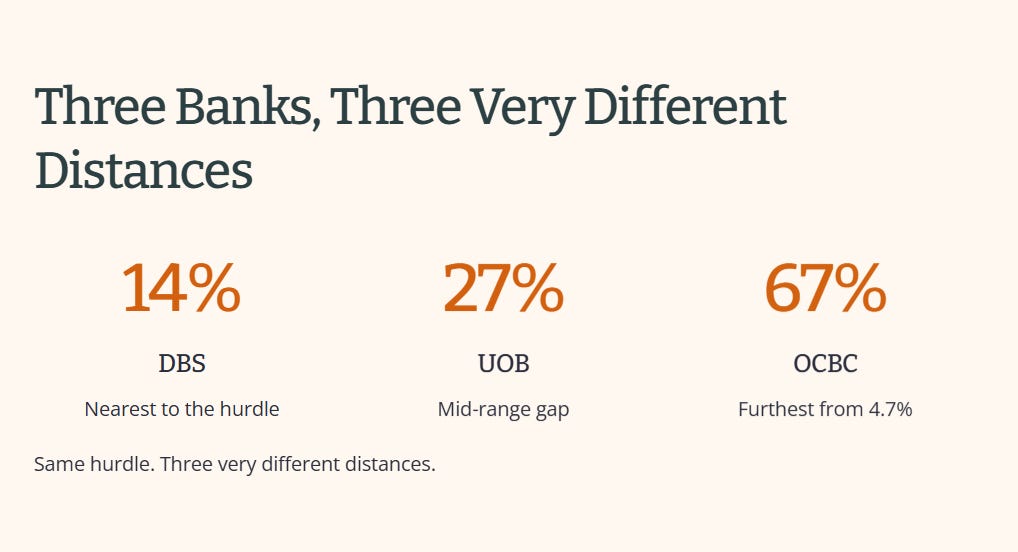
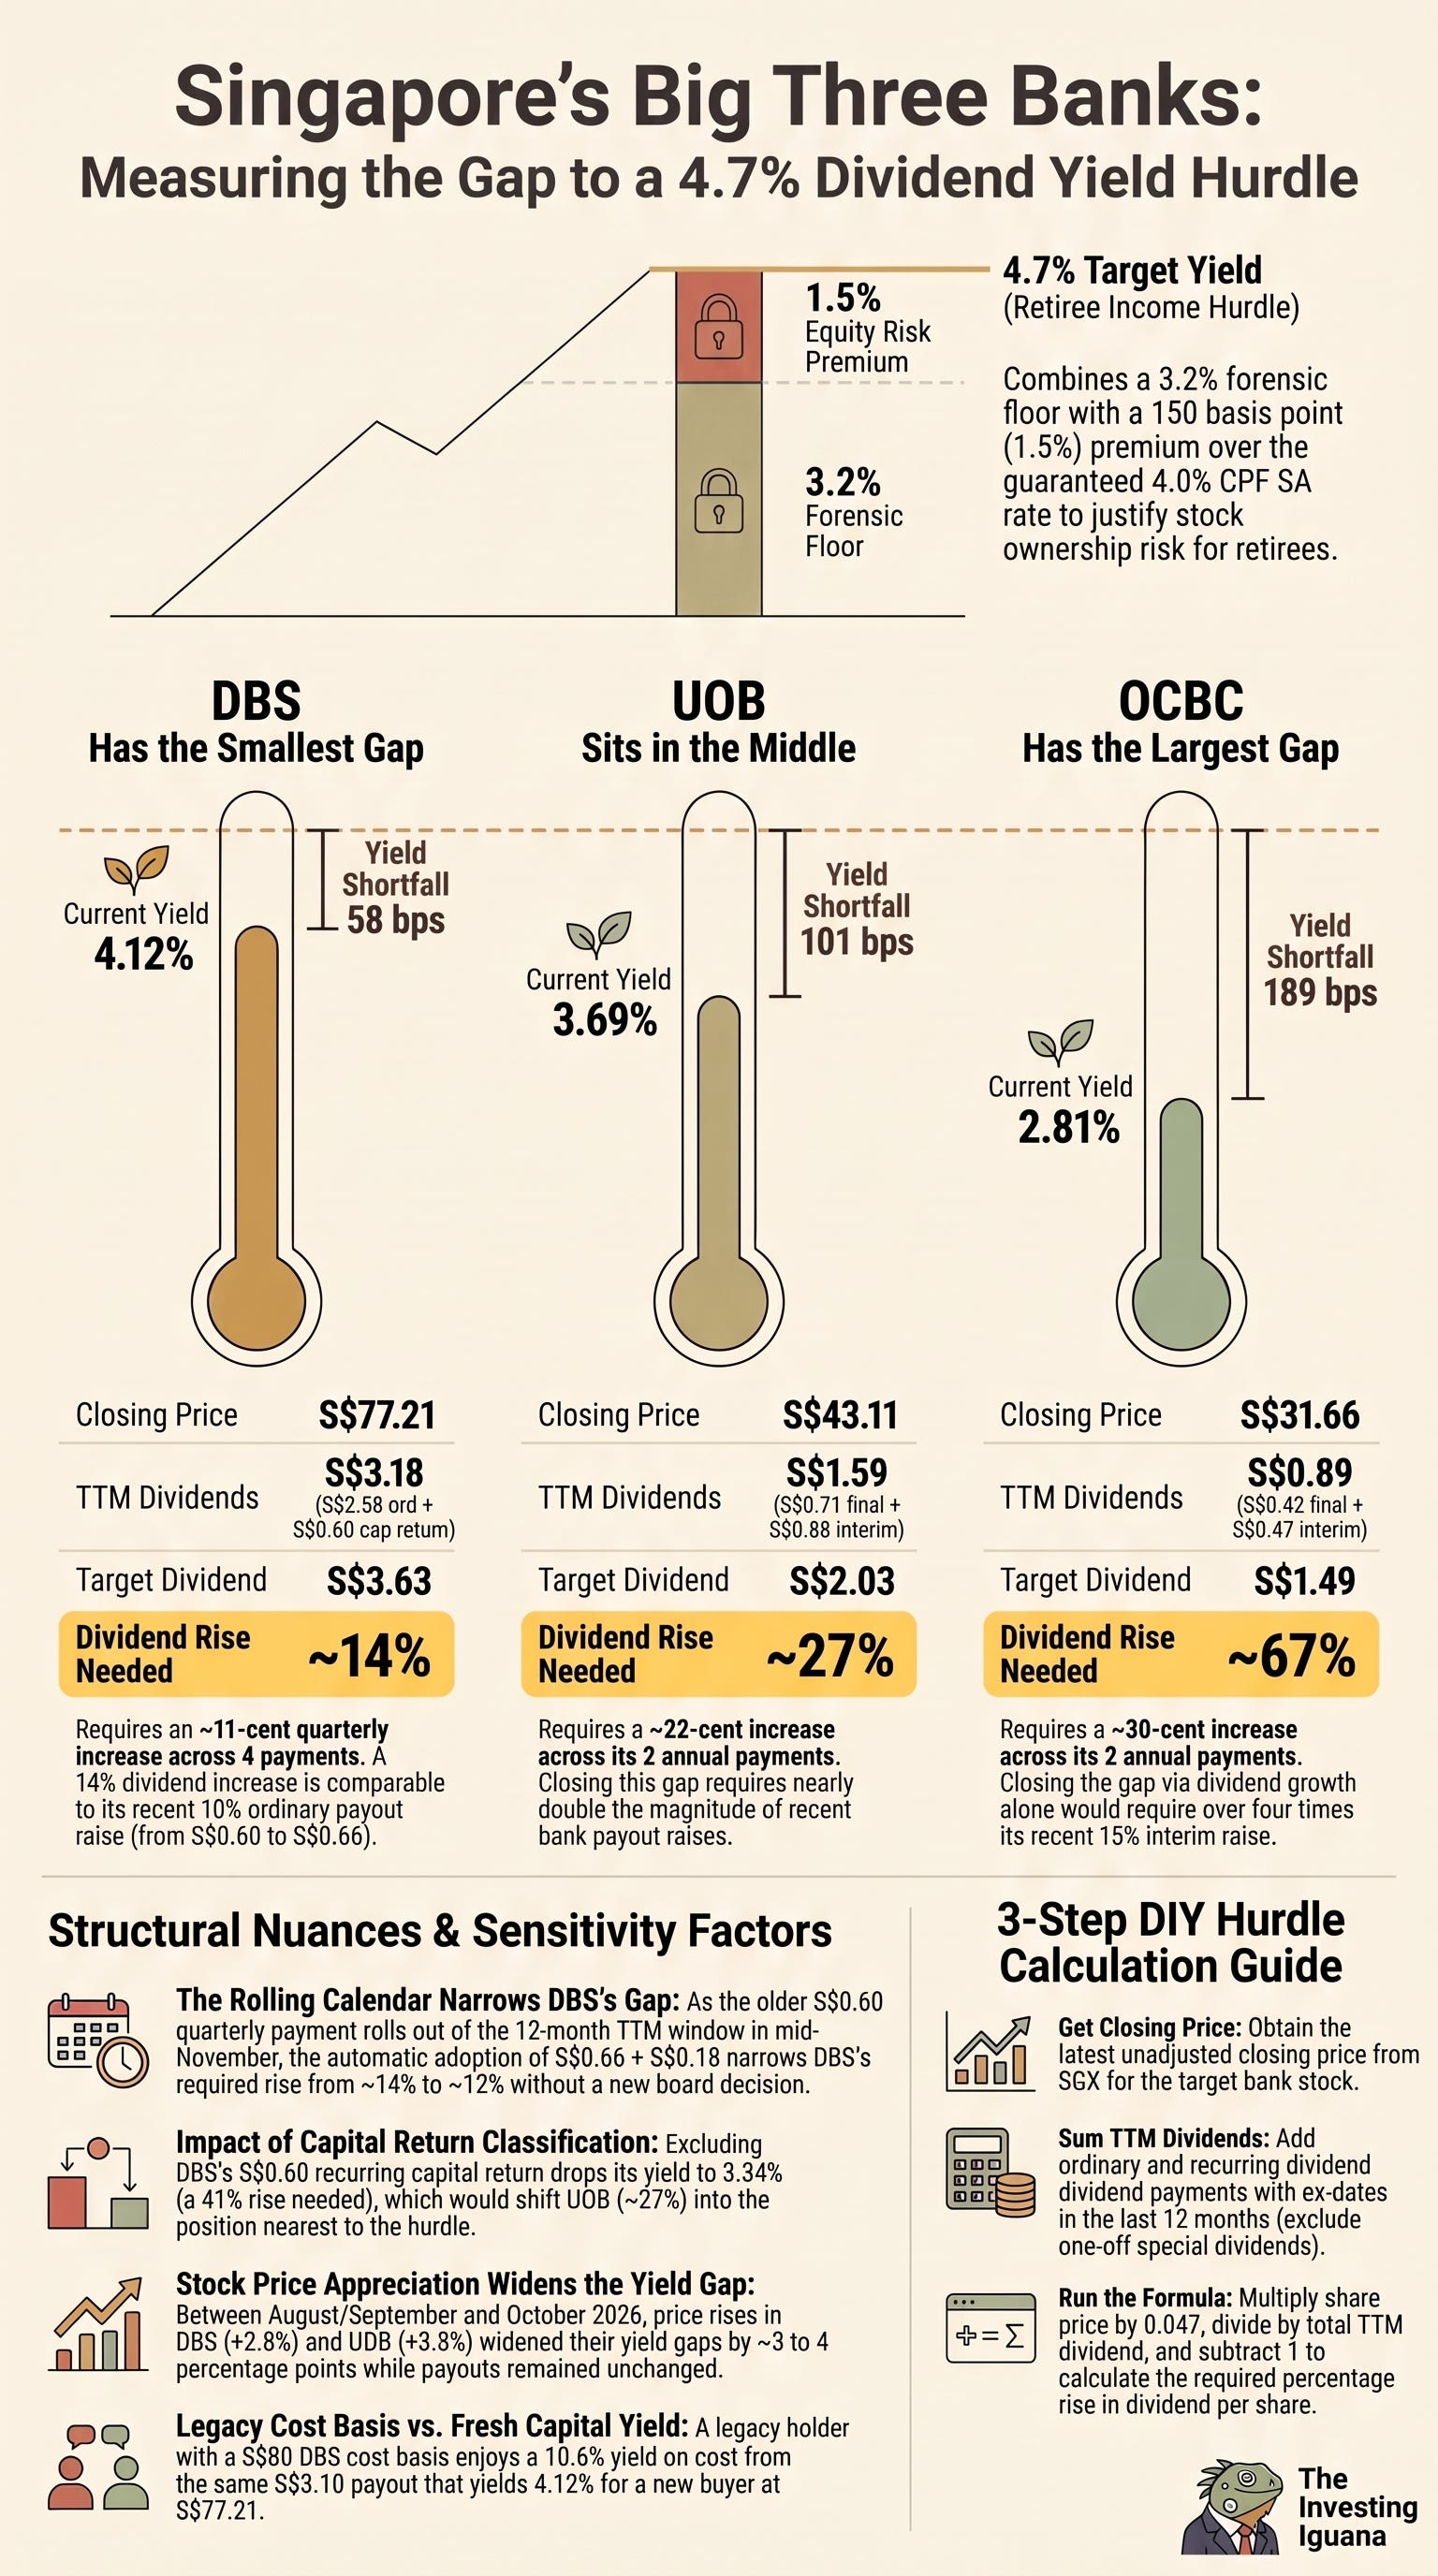
The three Singapore banks most retirees own are not the same distance from my income hurdle. At Friday’s close, DBS needs a dividend about 14% higher to reach 4.7%, UOB about 27% higher, and OCBC about 67% higher. Same hurdle, three very different distances.
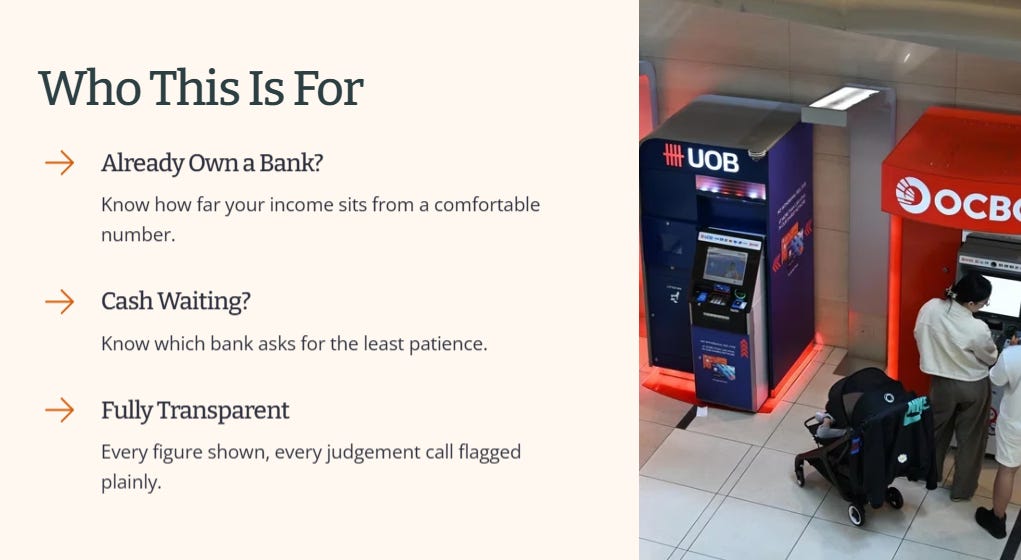
If you already own one of these banks, you want to know how far your income sits from a number that feels comfortable, and if you have cash waiting, you want to know which bank asks for the least patience. This piece answers both with one measurement you can repeat yourself, and I am publishing it free, with no paywall, because the arithmetic needs nothing more than a calculator. I will show every figure and where it came from, and I will say plainly where a number is a judgment call rather than a fact.
Disclosure: I own shares in all three banks. I am not asking you to buy or sell anything; I am showing the arithmetic I use for my own income planning.
📖 Free Edition
I’m making this edition free for everyone, with no paywall, so anyone weighing these three banks can read it, check the numbers and pass it on.

The Hurdle, and the Gap It Creates
Which Payments Count
Why Trailing Payments and Not Forecasts
Three Banks, Three Gaps
DBS: The Nearest Gap, and the Calendar Narrows It
UOB: A Flat Payment Against a Higher Price
OCBC: The Largest Gap, With the Special Shown Separately
Where the Basis Changes the Order
Iggy’s Insight
A Quick Note Before the Verdict
What the Gap Does and Does Not Say
Where the Three Sit on My Screen
How Big Is a 14%, 27% or 67% Raise?
Legacy Holders vs. Fresh Capital
Iggy’s Insight
Run the Same Test on Your Own Bank Shares
The Hurdle, and the Gap It Creates
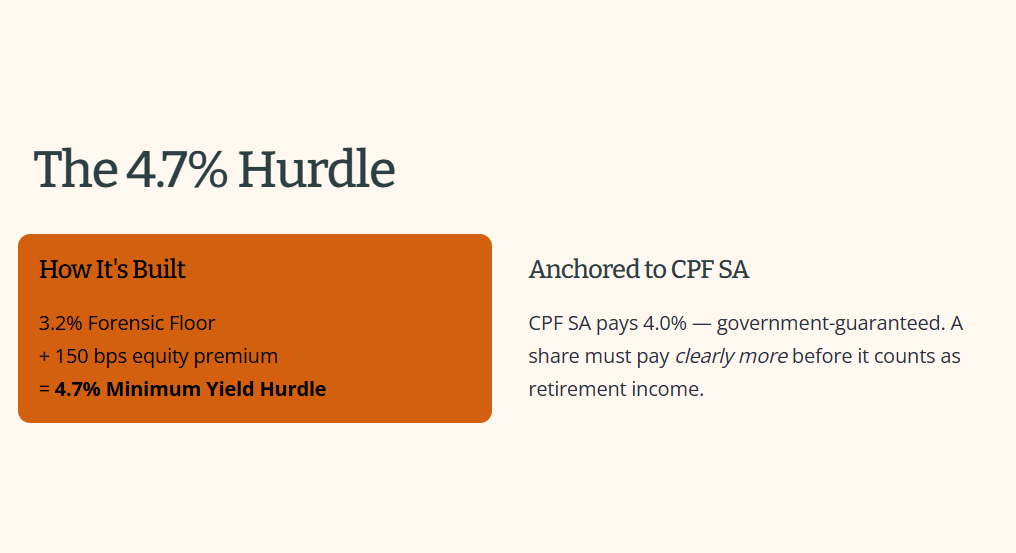
My Minimum Yield Hurdle is 4.7%. It is my 3.2% Forensic Floor plus a 150 basis point premium for owning shares instead of something guaranteed, and it is anchored to CPF SA, which pays 4.0% a year at the time of writing, on money the government stands behind. (A basis point is one hundredth of a percentage point, so 150 basis points is 1.5 percentage points.) If a guaranteed 4.0% exists, a share has to pay clearly more than that in dividends before I treat it as income for a retiree.
A heartland way to think about it: a resale flat bought for S$600,000 and rented out for S$2,000 a month delivers a 4.0% gross yield before costs. My hurdle asks a share to provide a higher income return, with dividends doing the work that rent does for the flat.
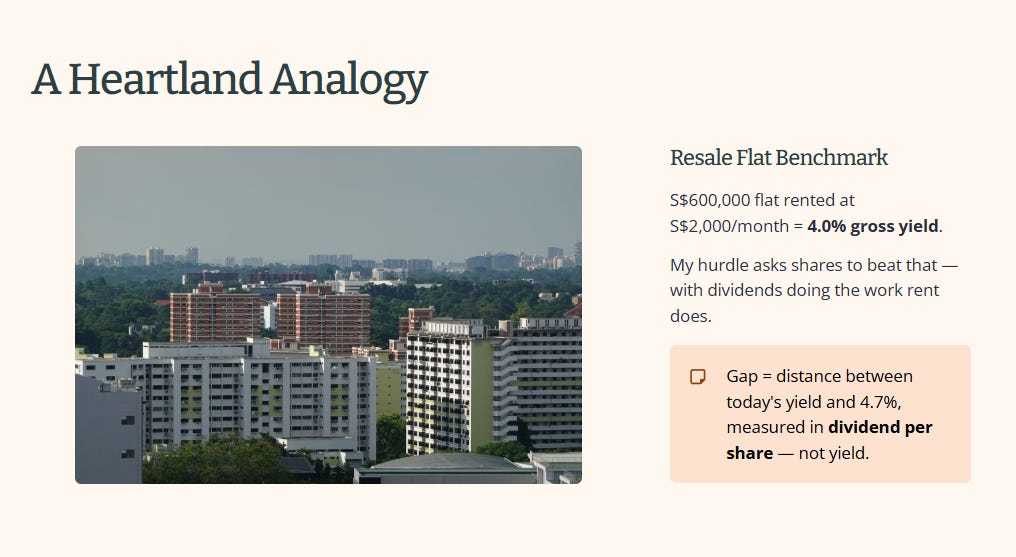
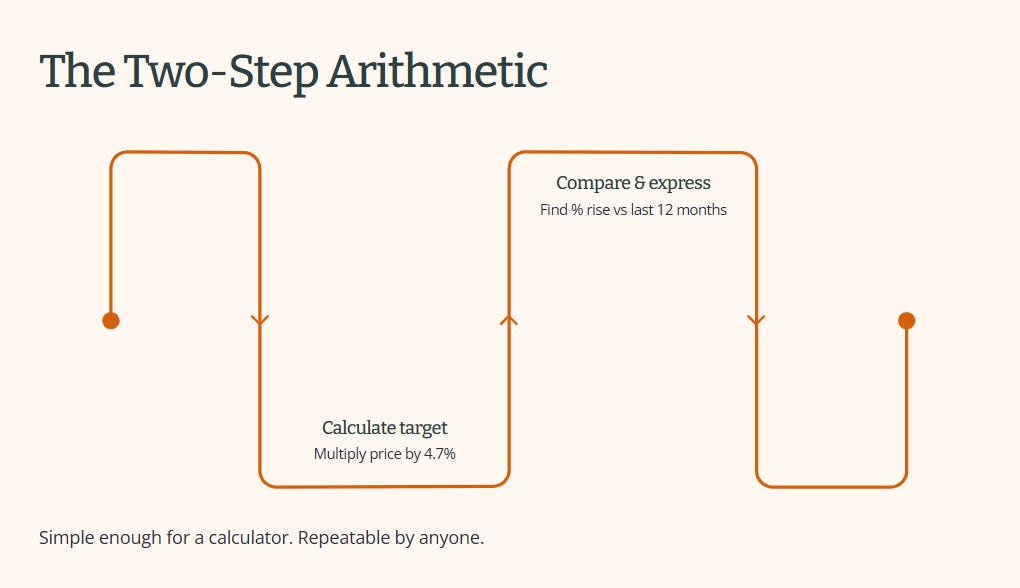
The gap is the distance between the yield a share pays today and 4.7%. I measure that distance in dividend per share rather than in yield, because the dividend is the part a bank’s board decides. The share price is decided by the market, and it moves every day. The arithmetic has two steps:
Multiply today’s share price by 4.7%. The result is the dividend per share the bank would need to have paid.
Compare that with the dividend per share it actually paid over the last 12 months, and express the difference as a percentage rise.
Which Payments Count
I include ordinary dividends and recurring distributions, but exclude one-off special dividends. DBS’s S$0.15 quarterly capital return is paid on a regular schedule, so I count it in the yield calculation.
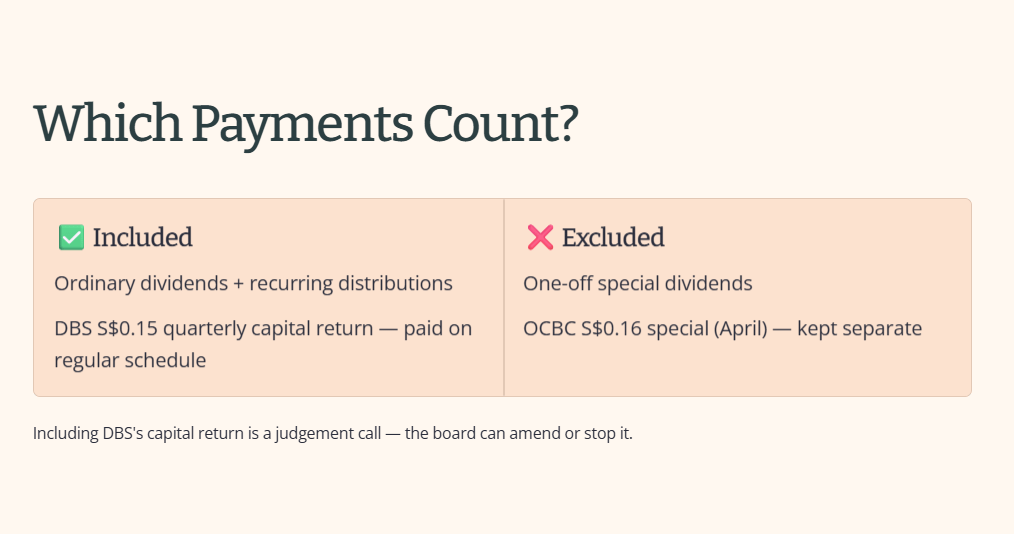
OCBC’s S$0.16 special dividend paid in April was a one-off, so I keep it separate and exclude it from the yield gap. DBS has indicated that it intends to continue its capital-return programme, but it is not guaranteed and the board can amend or stop it. Including it is therefore my judgement call, not a certainty.
Why Trailing Payments and Not Forecasts
I use payments that have already been made because anyone can check them against the bank’s own announcements. A forecast of next year’s dividend is somebody’s estimate, and an estimate can sit on a screen for months without being tested.
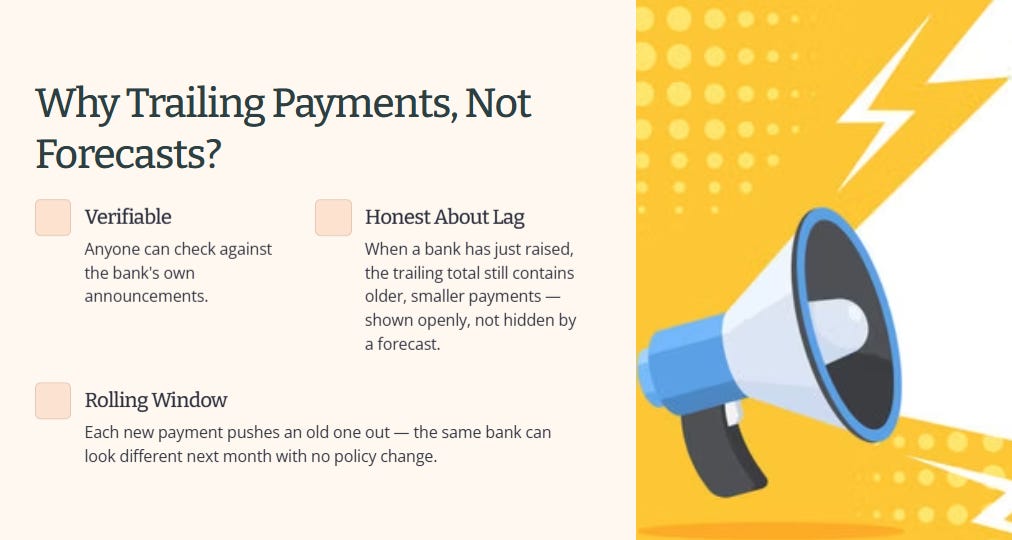
The trade-off is that a trailing number lags: when a bank has just raised its payment, the 12-month total still contains older, smaller payments, so it understates what the bank is paying today. DBS is the live example below. I would rather show that lag openly than replace it with a forecast I cannot verify. A trailing window also rolls forward, with each new payment pushing an old one out, so the same bank can look different a month from now without any change in its policy.
That is the method. Now the three banks.
Three Banks, Three Gaps
Closing prices are the unadjusted SGX closes from the 2 October 2026 session, so a data vendor that shows dividend-adjusted closes may display a slightly different figure. Dividends are the payments with an ex-dividend date between 3 October 2025 and 2 October 2026.
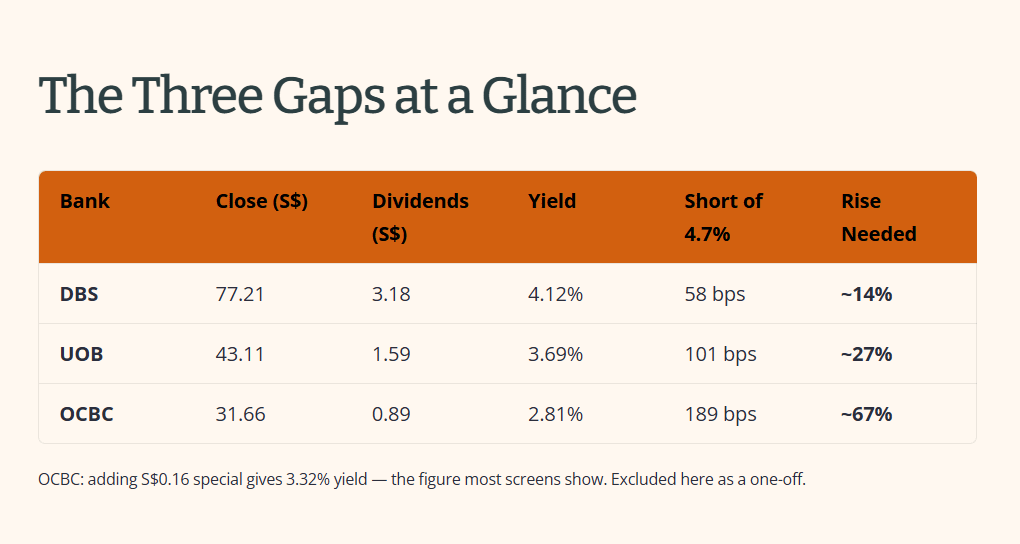
OCBC side line: adding the SGD 0.16 special makes its trailing total SGD 1.05 and its yield 3.32%, which is the figure many screens show. I do not count it, for the reason above. The special stays inside a trailing 12-month window until about late April 2027, so those screens will keep showing the larger yield for roughly seven more months.
In payment terms, DBS would need about 11 cents more on each of its four quarterly payments. UOB would need about 22 cents more on each of its two yearly payments, and OCBC about 30 cents more on each of its two.
DBS: The Nearest Gap, and the Calendar Narrows It
DBS’s SGD 3.18 is SGD 2.58 of ordinary dividends (SGD 0.60 + SGD 0.66 + SGD 0.66 + SGD 0.66) and SGD 0.60 of capital return (SGD 0.15 four times). Its ordinary quarterly payment rose from SGD 0.60 to SGD 0.66 beginning with the April payment, so the trailing window still contains one old SGD 0.60 payment, the one with the 13 November 2025 ex-date.
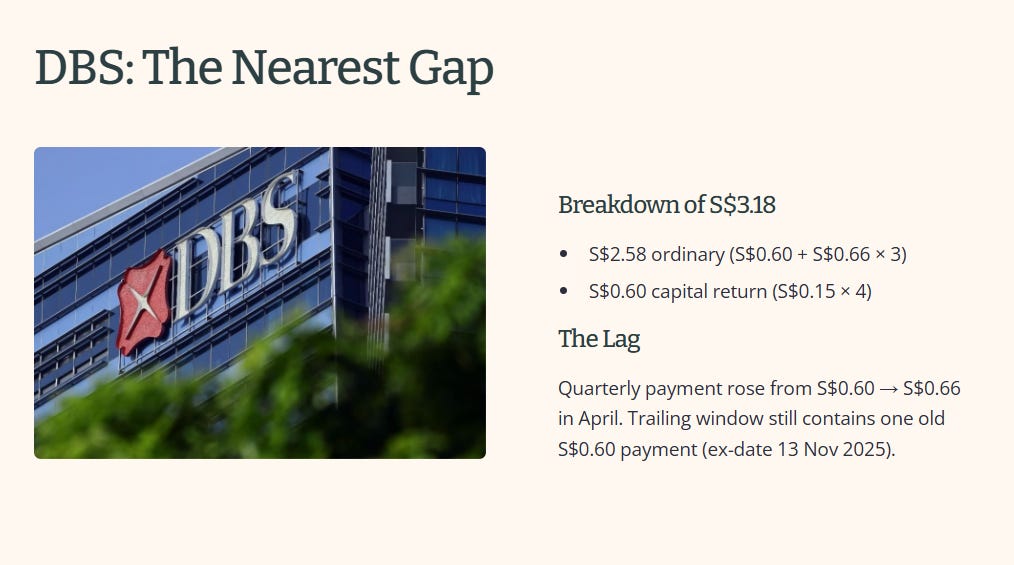
Here is where the calendar helps. If DBS pays SGD 0.66 plus the SGD 0.15 capital return again at its next payment, that payment replaces the SGD 0.60 one around mid-November. Trailing dividends become SGD 3.24, and at Friday’s price the rise needed falls from about 14% to about 12%. That is arithmetic about the window, not a forecast of what the board will declare, and it needs no new raise to happen. It is the only one of the three gaps that narrows by the calendar alone.
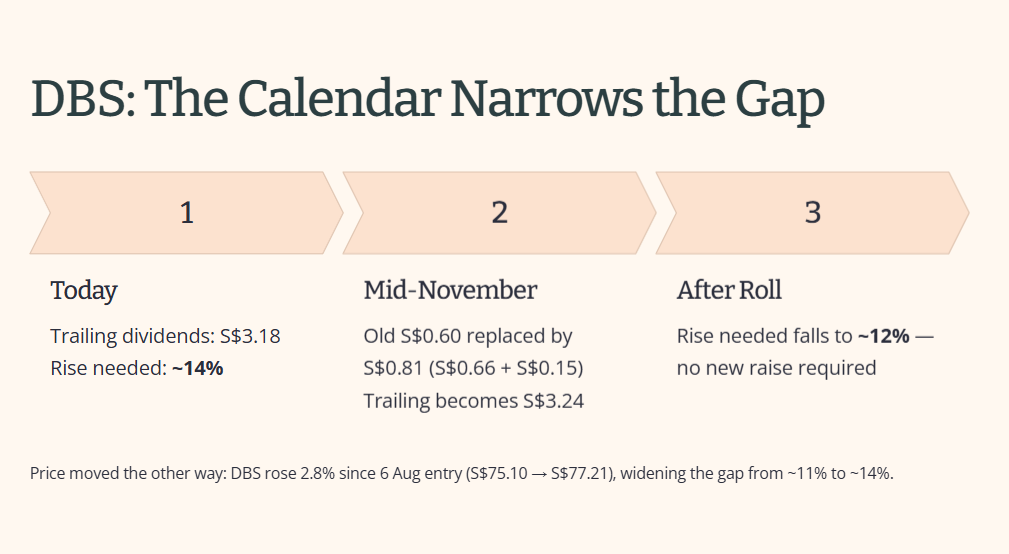
The share price has pushed the other way. My Ledger entry from 6 August had DBS at SGD 75.10, where the gap was about 11%. At SGD 77.21 it is about 14%, and DBS paid no more in between. The price rose 2.8%, and the gap grew about three percentage points on that alone.
UOB: A Flat Payment Against a Higher Price
UOB’s SGD 1.59 is the SGD 0.71 final paid in May and the SGD 0.88 interim paid in August, with no special in the window. At SGD 43.11 that is a yield of 3.69%, which leaves the gap 101 basis points wide.
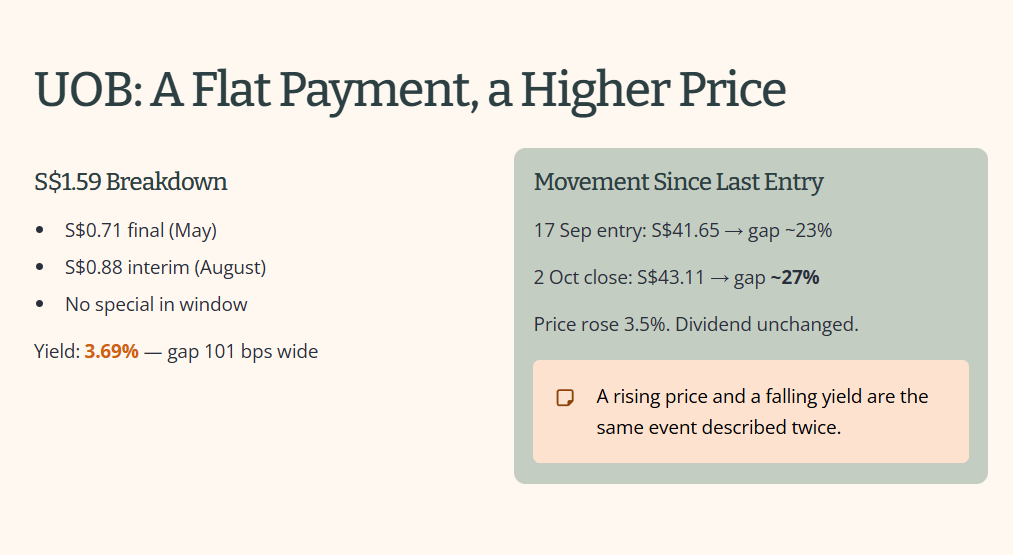
The movement since my last UOB entry is entirely price. That entry, dated 17 September, used a provisional SGD 41.65 and showed a gap of about 23%. At Friday’s close the same SGD 1.59 produces a gap of about 27%, because the price rose 3.5% and the dividend had no new declaration to change it. When the payment stays flat, a rising price and a falling yield are the same event described twice.
OCBC: The Largest Gap, With the Special Shown Separately
OCBC’s SGD 0.89 is the SGD 0.42 final and the SGD 0.47 interim. At SGD 31.66 the yield is 2.81%, and the rise needed is about 67%. Even if I counted the special, which I do not, the gap would still be about 42%, so the choice of basis changes the size of the distance but not its order.
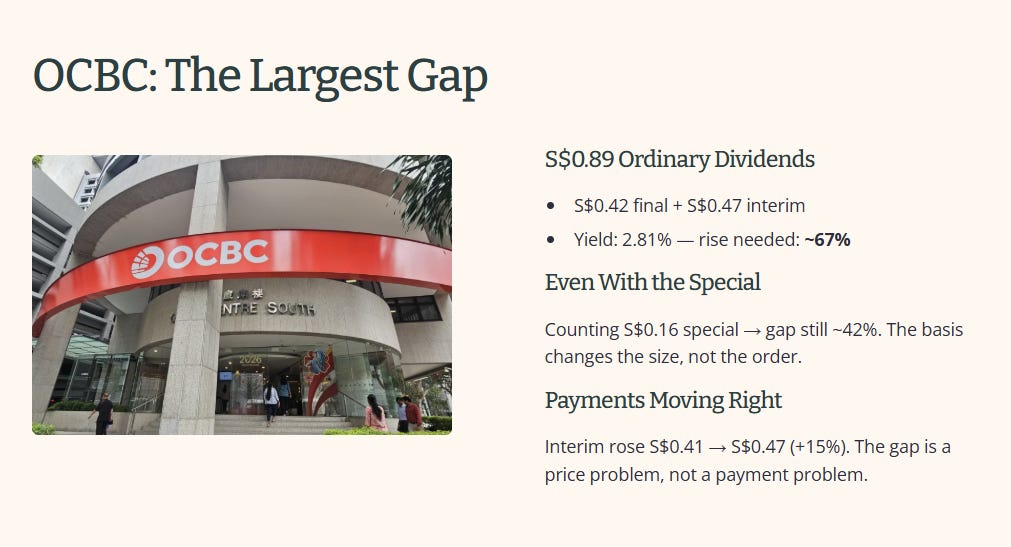
The ordinary payment is moving the right way. The interim rose from SGD 0.41 to SGD 0.47, about 15%, and the two ordinary payments in this window total SGD 0.89 against SGD 0.82 a year earlier. The size of the gap comes from the price being high relative to those payments, not from the payments shrinking.
Where the Basis Changes the Order
The capital return is the one judgment that moves the ranking. If I counted only DBS’s ordinary dividends, S$2.58, its yield at Friday’s close would be 3.34% and the rise needed would be about 41%. On that basis UOB, at about 27%, would be the nearest to the hurdle, DBS second and OCBC still last.
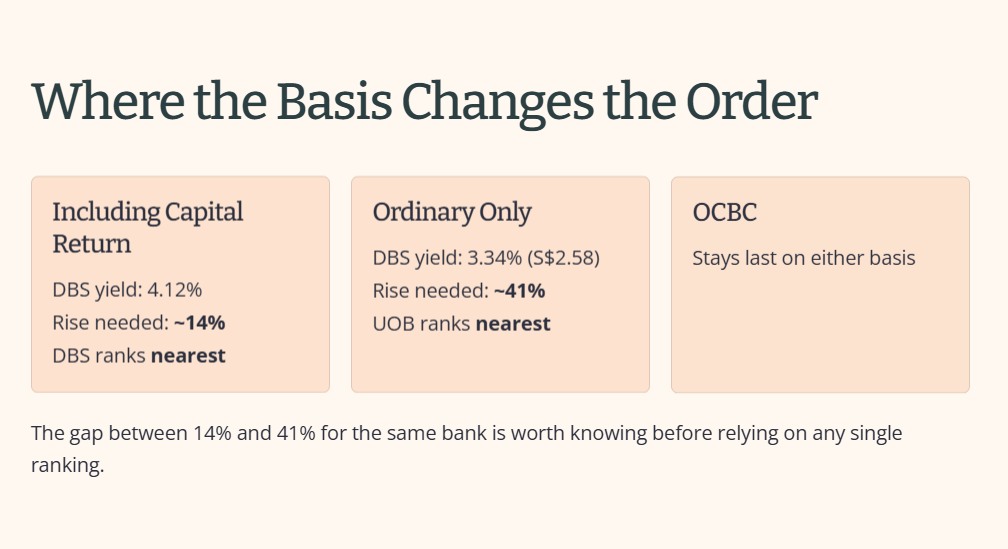
I count the capital return because it has arrived every quarter in this window and the bank has said it intends to continue it, but a reader who weighs a board-controlled distribution differently will get a different order. The gap between 14% and 41% for the same bank is worth knowing before you rely on any single ranking, including mine.
💡 Insight Callout
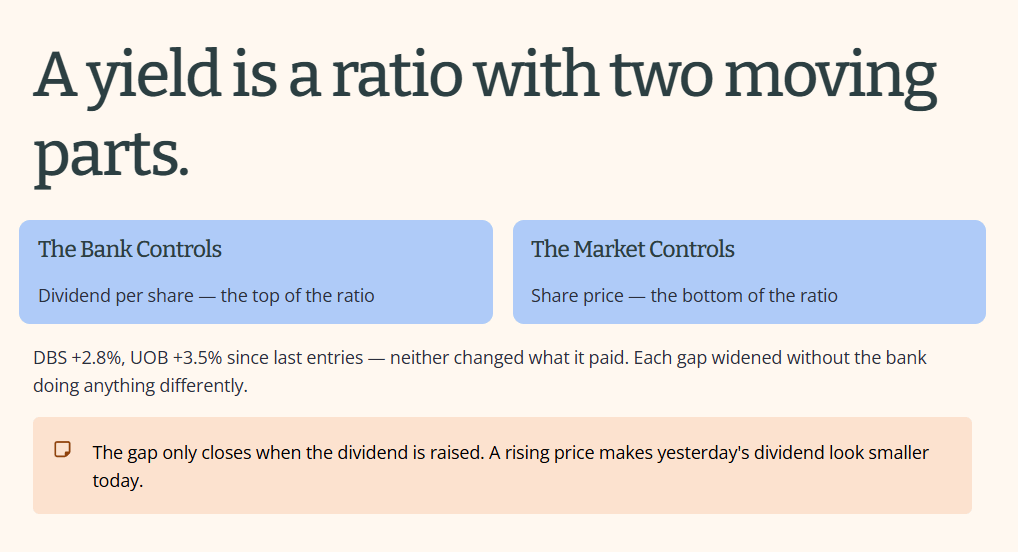
A yield is a ratio, and a ratio has two moving parts. The bank controls the top, the dividend per share. The market controls the bottom, the share price. Between my Ledger entries and Friday’s close, DBS rose 2.8% and UOB rose 3.5% while neither changed what it paid, so each gap widened without the bank doing anything differently. That is why I measure the gap in dividends: it shows what a board would have to decide, instead of what the market did this week. A rising price makes yesterday’s dividend look smaller today. The dividend only counts when it is paid, and the gap only closes when it is raised.
A Quick Note Before the Verdict
You aren’t here for the kopi tips or the hype. You’re here because you want the forensic truth before you commit a single dollar of your capital. That says something about the kind of investor you are.
Here’s the uncomfortable truth about independent publishing: reach isn’t guaranteed by quality alone, it’s built by readers who subscribe and share. Every forensic investor who reads without subscribing is invisible to the numbers that decide whether this keeps reaching people.
If this analysis has ever helped you spot a risk or work out a margin of safety, subscribe for free and pass it to one person who’d get value from it. Not for me. So that data-driven SGX analysis keeps finding the people who actually want it, instead of getting buried under the noise.
What the Gap Does and Does Not Say
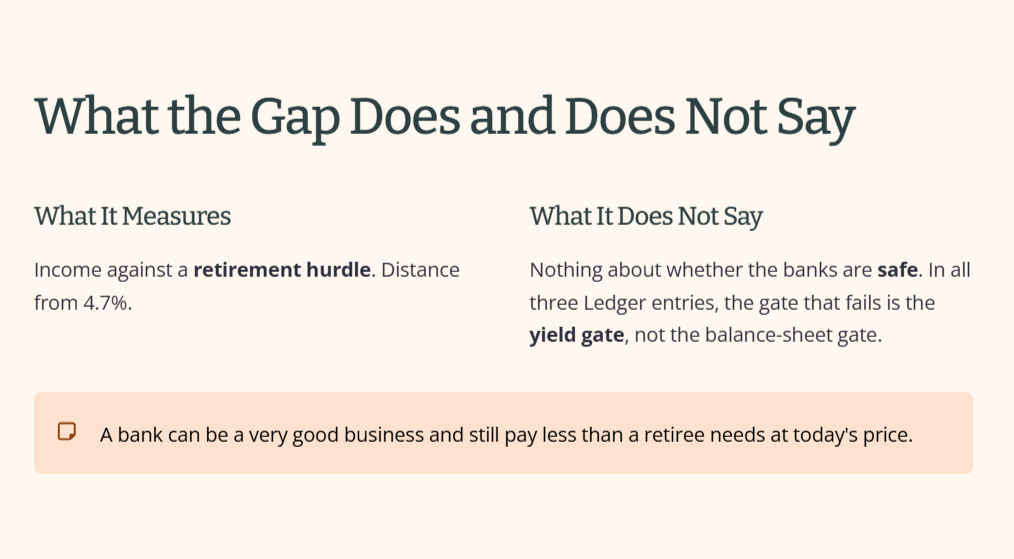
The obvious pushback is a fair one: “These are Singapore’s three big local banks, so isn’t it unfair to mark them down?” The gap measures income against a retirement hurdle. It says nothing about whether the banks are safe, and in all three of my Ledger entries the gate that fails is the yield gate, not a balance-sheet gate. A bank can be a very good business and still pay less than a retiree needs from the shares at today’s price.
Where the Three Sit on My Screen
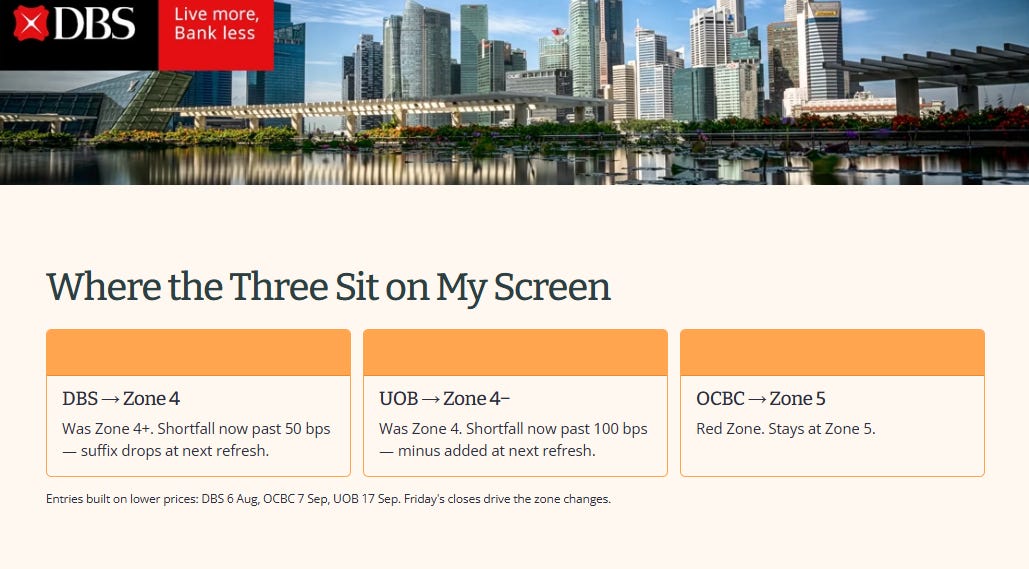
My Stock Forensic Ledger carries DBS at Zone 4+, OCBC at Zone 5 Red Zone and UOB at Zone 4, as at entry dates of 6 August, 7 September and 17 September. Those entries were built on lower prices. Friday’s closes push the DBS shortfall past 50 basis points and the UOB shortfall past 100 basis points, which are the lines for the suffix, so the next Ledger refresh will move DBS to Zone 4 with no suffix and UOB to Zone 4 with a minus. OCBC stays at Zone 5.
How Big Is a 14%, 27% or 67% Raise?
Context helps here. DBS’s most recent raise, from SGD 0.60 to SGD 0.66 a quarter, was 10%. OCBC’s most recent raise, in its interim from SGD 0.41 to SGD 0.47, was about 15%. A 14% rise at DBS is about the size of a raise it has just delivered. A 27% rise at UOB is nearly twice the larger of those two recent raises, and a 67% rise at OCBC is more than four times larger.Context helps here. DBS’s most recent raise, from SGD 0.60 to SGD 0.66 a quarter, was 10%. OCBC’s most recent raise, in its interim from SGD 0.41 to SGD 0.47, was about 15%. A 14% rise at DBS is about the size of a raise it has just delivered. A 27% rise at UOB is nearly twice the larger of those two recent raises, and a 67% rise at OCBC is more than four times larger.
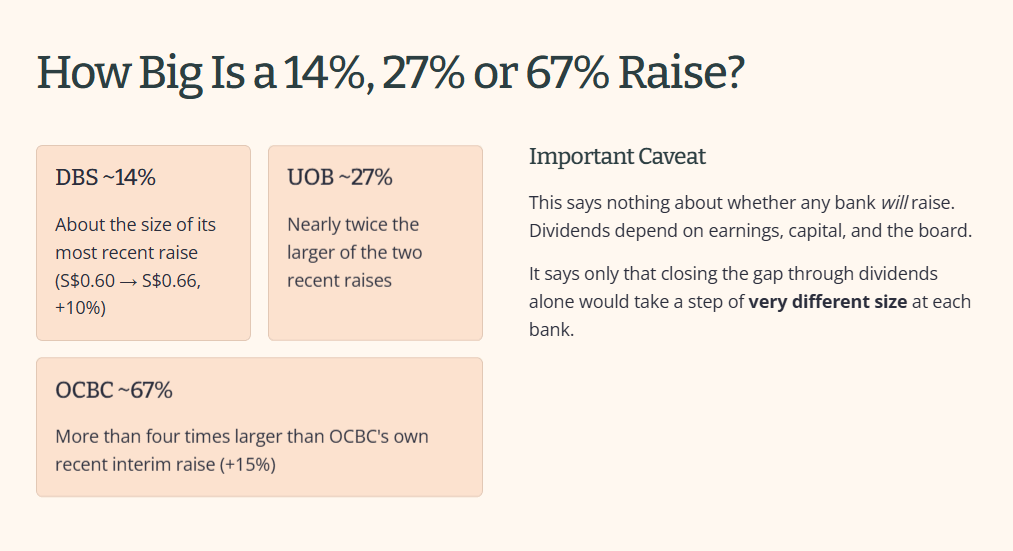
That does not say any of the three will or will not raise. A bank’s dividend depends on its earnings, its capital and its board, and I am not forecasting any of them here. It says only that closing the gap through dividends alone would take a step of very different size at each bank. The other side of the arithmetic is the share price, and I am making no call on where that goes.
Legacy Holders vs. Fresh Capital
DBS and OCBC both raised their ordinary payments inside this window, so the two kinds of reader need separate answers. The numbers below are an illustration, not a historical price.
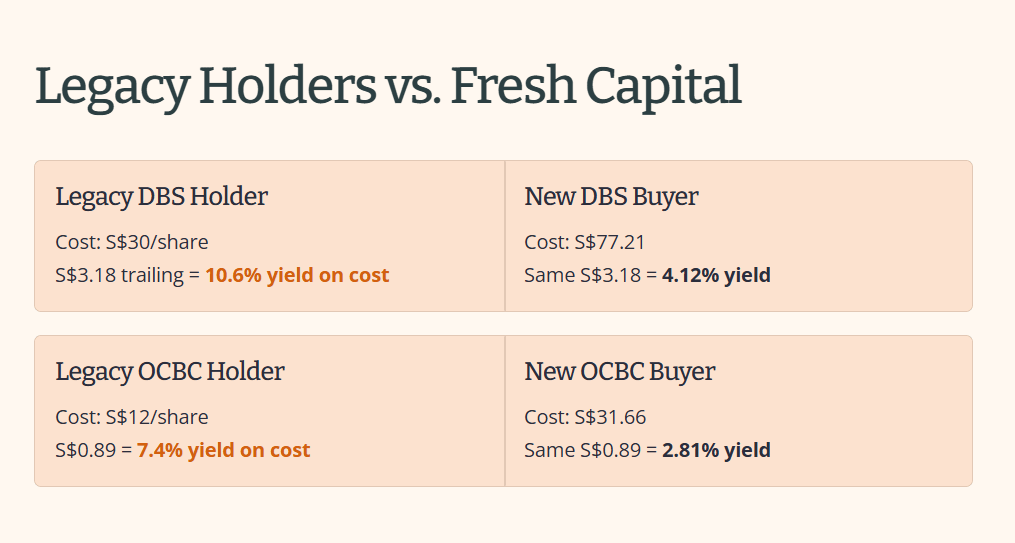
Suppose a DBS holder’s cost was SGD 30 a share. The SGD 3.18 of trailing dividends is a 10.6% yield on that cost. A reader committing new money at SGD 77.21 receives exactly the same payments and a yield of 4.12%. For OCBC, a holder whose cost was SGD 12 receives SGD 0.89, a yield on cost of 7.4%, while a new buyer at SGD 31.66 gets 2.81%.
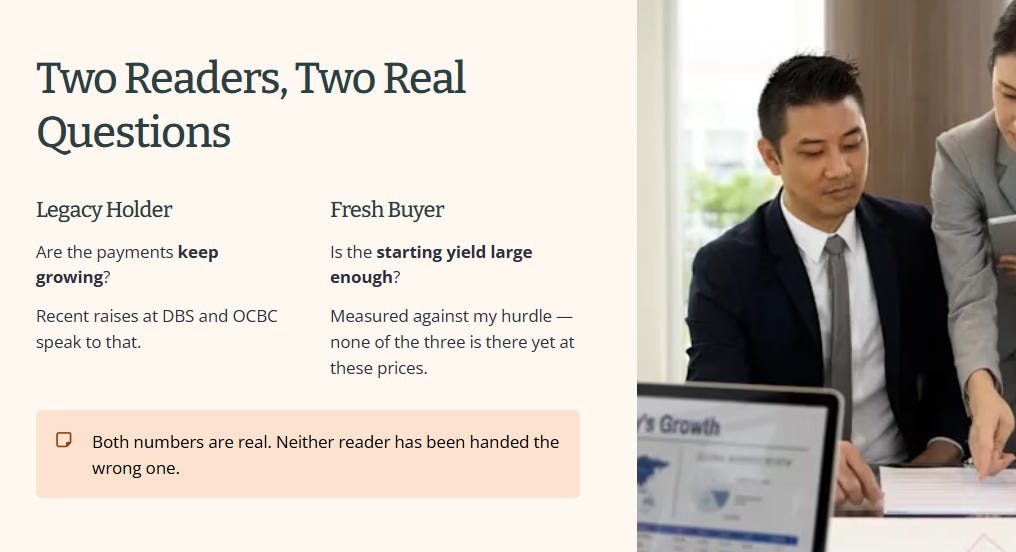
Both numbers are real, and neither reader has been handed the wrong one. The legacy holder’s question is whether the payments keep growing, and the recent raises at DBS and OCBC speak to that. The fresh reader’s question is whether the starting yield is large enough, and measured against my hurdle, none of the three is there yet at these prices.
💡 Insight Callout
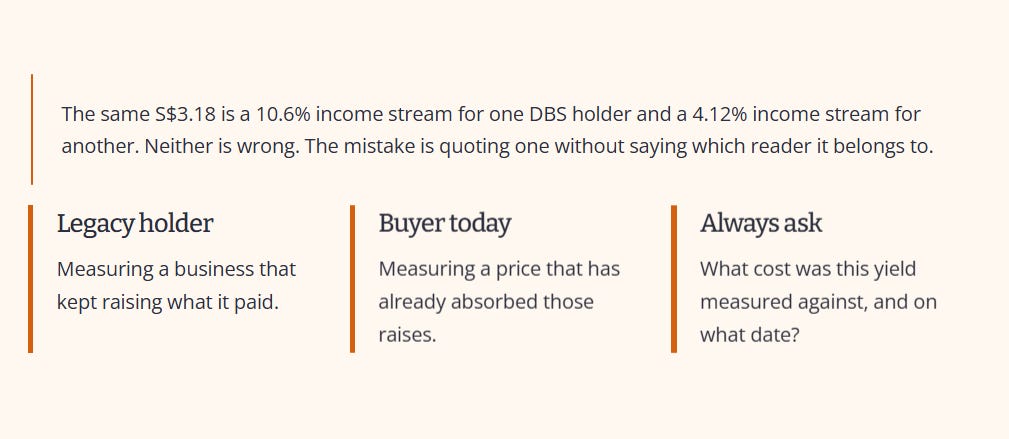
The same S$3.18 is a 10.6% income stream for one DBS holder and a 4.12% income stream for another. Neither reader is wrong, and neither has been given a false number. The mistake is quoting one without saying which reader it belongs to. A holder who bought years ago is measuring a business that kept raising what it paid, while a buyer today is measuring a price that has already absorbed those raises. When you read any bank yield, ask what cost it was measured against and on what date. A yield without a cost basis is a statement about the seller’s price, not about your income.
Run the Same Test on Your Own Bank Shares
You do not need my Ledger to repeat this. It takes three steps and a calculator.
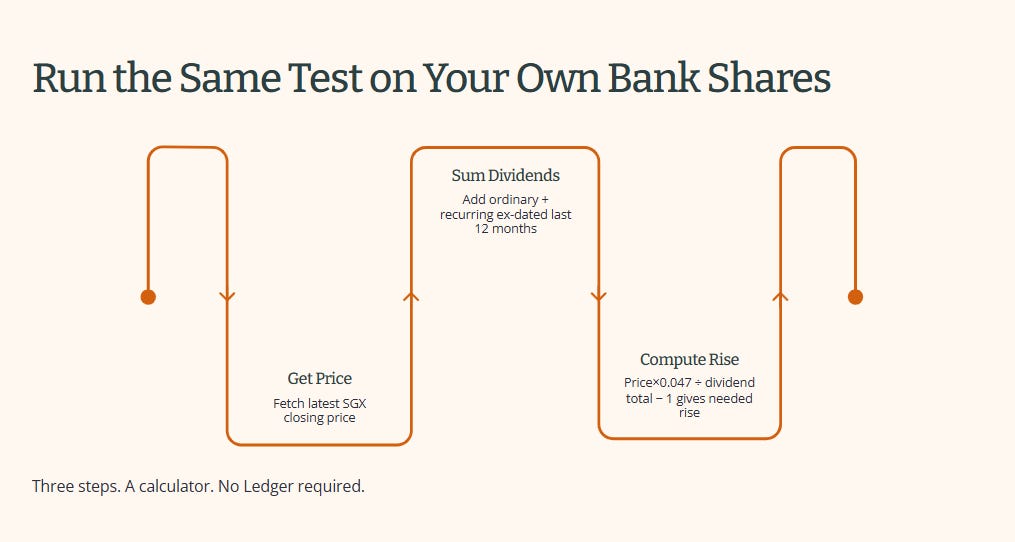
Take the latest closing price from SGX or any quote page, and note the date on it.
Add up the dividends with an ex-dividend date in the last 12 months, using the bank’s own investor relations page. Sort them into ordinary, recurring and one-off, and leave the one-offs out.
Multiply the price by 0.047, divide the result by your dividend total, and subtract 1. That is the rise needed.
For DBS: SGD 77.21 × 0.047 = SGD 3.63, and SGD 3.63 ÷ SGD 3.18 = 1.14, so the rise needed is about 14%.
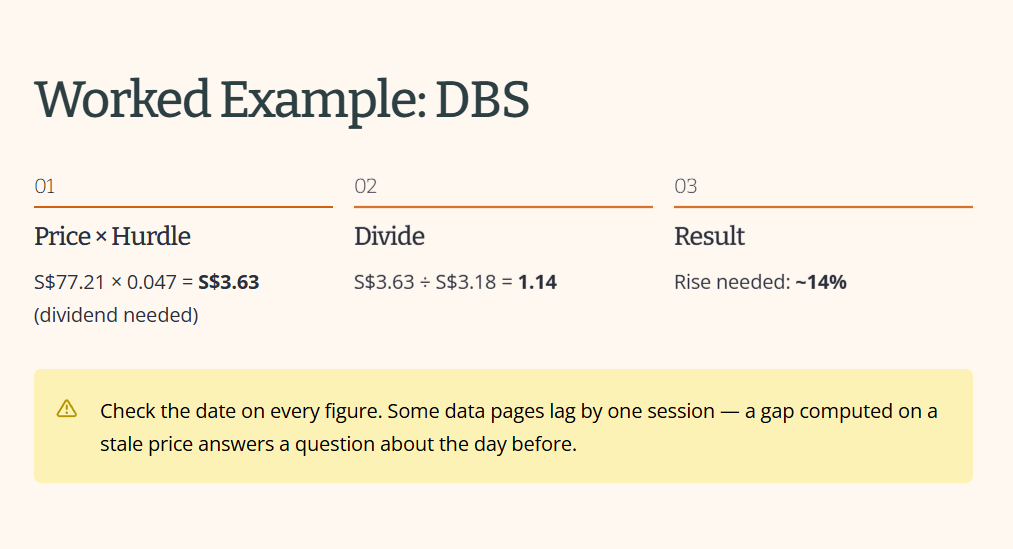
Check the date on every figure you pull. Some data pages lag by one trading session, and two of the pages I checked for this piece showed Thursday’s yield beside Friday’s date. A gap computed on a stale price is still arithmetic, but it answers a question about the day before.
YOUR FORENSIC VERDICT, ONE PAGE.
The full audit is above. This is the Iggy Forensic Audit distilled to one A4 page — every number that matters, every flag that triggered, one clear verdict. Save it, print it, pull it out when this stock crosses your radar again, or when you need to refer to these data points for your retirement planning.

Iggy’s Forensic Disclaimer
This content is produced for educational and informational purposes only. I am not a financial advisor. I am a retail investor who applies forensic analysis to my own portfolio and shares that process publicly. Nothing here constitutes a recommendation to buy, sell, or hold any security, and no specific target prices or personalised financial advice are offered.
Stocks assessed under Iggy’s Forensic Yield Standard are benchmarked against a 4.7% minimum yield hurdle. Stocks flagged as Growth Watch fall below this threshold but demonstrate clean balance sheet metrics and an identifiable growth catalyst. These carry a materially different risk profile and are not suitable as yield replacements for income-dependent investors.
All data is sourced from public filings and verified sources. Where data is unverified, it is explicitly flagged. All investments carry risk, including the potential loss of principal, and past performance is not indicative of future results. If you are making investment decisions involving CPF, SRS, or personal capital, please conduct your own due diligence or consult a MAS-licensed financial adviser before committing funds.