

DBS Says BUY Singapore Exchange. The Forensic Numbers Say Something Else.
Why a 1.6% Yield in an All-Time High Market Creates a Structural Problem for Retirement Portfolios

1.6% Yield in an All-Time High Market
A yield of 1.6% is the number that should stop you in your tracks. This is not a minor shortfall. It is a structural failure that undermines the entire story of growth and institutional excitement for any retail investor managing a retirement portfolio.
Right now, the Singapore exchange is at a historic high, with the Straits Times Index at 5,218.96. In this environment, chasing capital appreciation stories at the expense of reliable income is how portfolios run out of cash flow during market corrections. This analysis takes apart the institutional growth assumptions surrounding Singapore Exchange Limited and shows why a blue-chip name cannot hide a structural failure to meet the income hurdles required for a retirement portfolio.
The gap between what institutions want and what a retirement portfolio needs has never been wider than it is right now, at the top of this market cycle. Investment bank analysts can chase price momentum and build multi-year growth projections based on institutional money flows. Your personal capital has a completely different job to do.
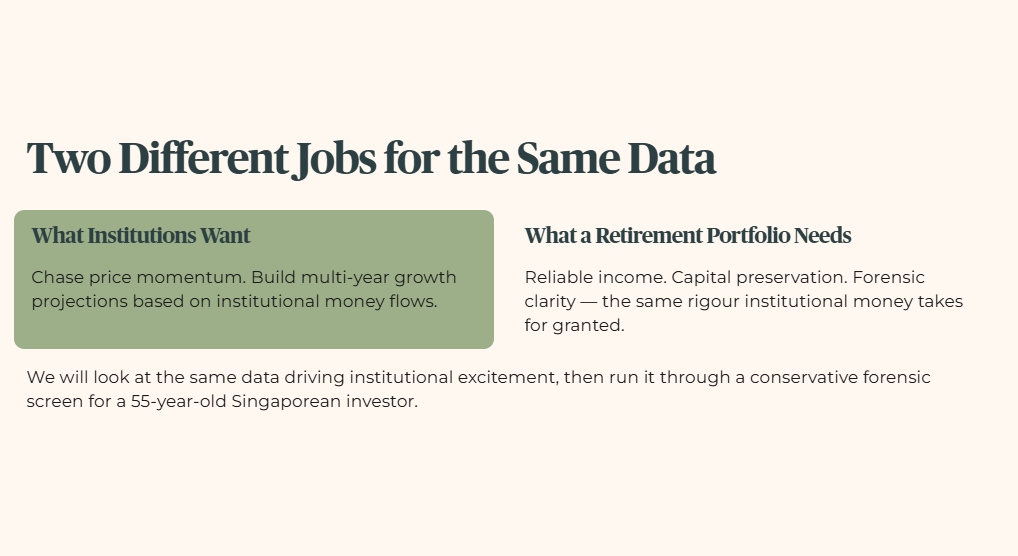
We are going to look at the same data that has the institutions excited. Then we will run it through a conservative forensic screen to see what is actually left on the table for a 55-year-old Singaporean investor.

Section 1 — The Analyst’s Case
Section 2 — Iggy’s Forensic Screen
Section 3 — The Dividend Trajectory
Section 4 — The Forensic Gap
Section 5 — What To Watch Next
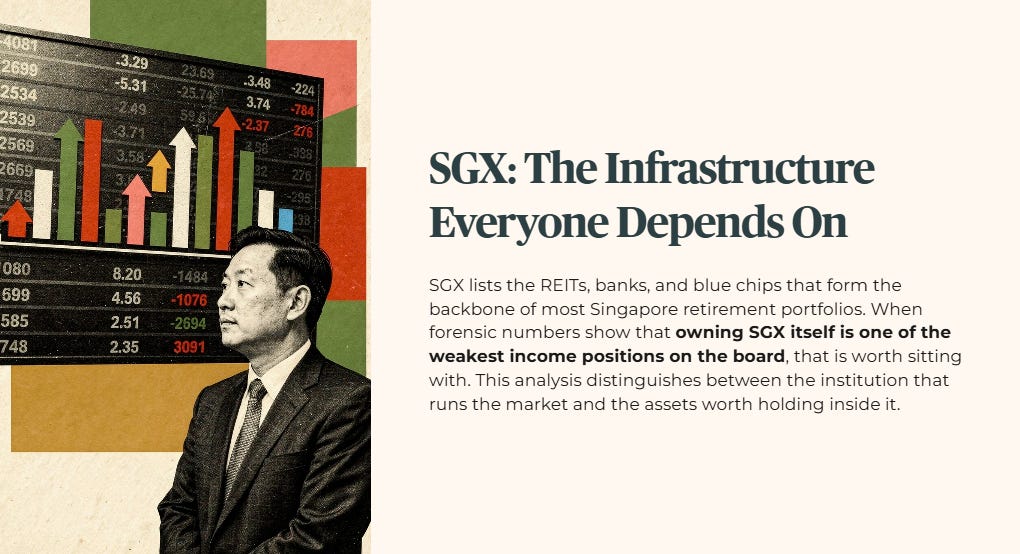
SGX is the infrastructure that every investor in this room depends on. It is the exchange that lists the REITs, the banks, and the blue chips that form the backbone of most retirement portfolios in Singapore. So when the forensic numbers show that owning SGX itself is one of the weakest income positions on the entire board, that is worth sitting with for a moment. This analysis is for the investor who wants to understand the difference between the institution that runs the market and the assets worth holding inside it.
My job is simple, even if the balance sheet is not. I read the numbers that the headline skips, the interest coverage, the gearing, the free cash flow sustainability, so that the Singaporean building or living off a dividend portfolio gets the same forensic clarity that institutional money takes for granted.
Section 1 — The Analyst’s Case
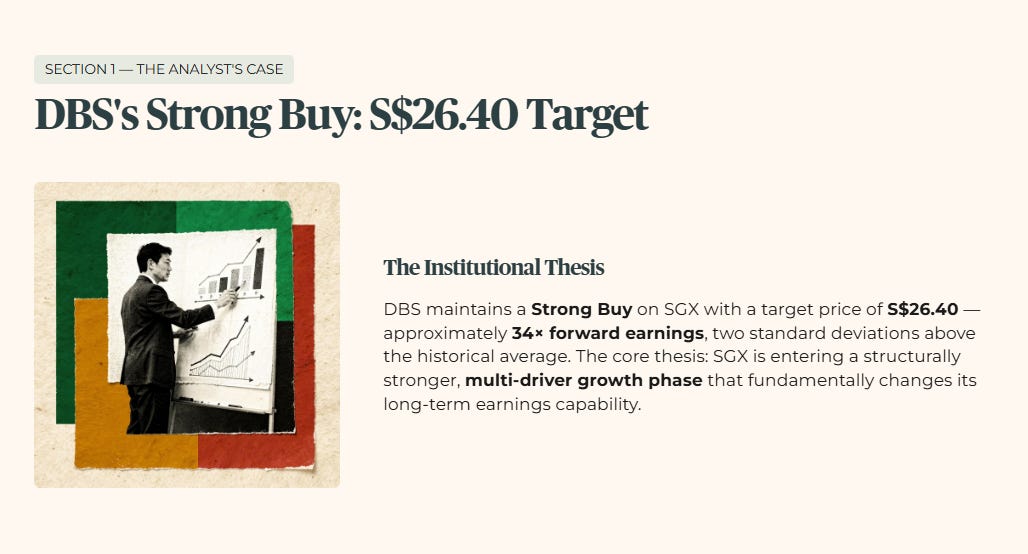
The institutional team at DBS has maintained a strong buy call on Singapore Exchange Limited (SGX, ticker S68). They have raised their target price significantly to S$26.40, which reflects a premium multiple of approximately 34 times forward earnings. This valuation sits two standard deviations above the historical average for the local exchange operator.
The core thesis driving this aggressive valuation is that SGX is entering a structurally stronger, multi-driver growth phase. Analysts believe this fundamentally changes the long-term earnings capability of the business.
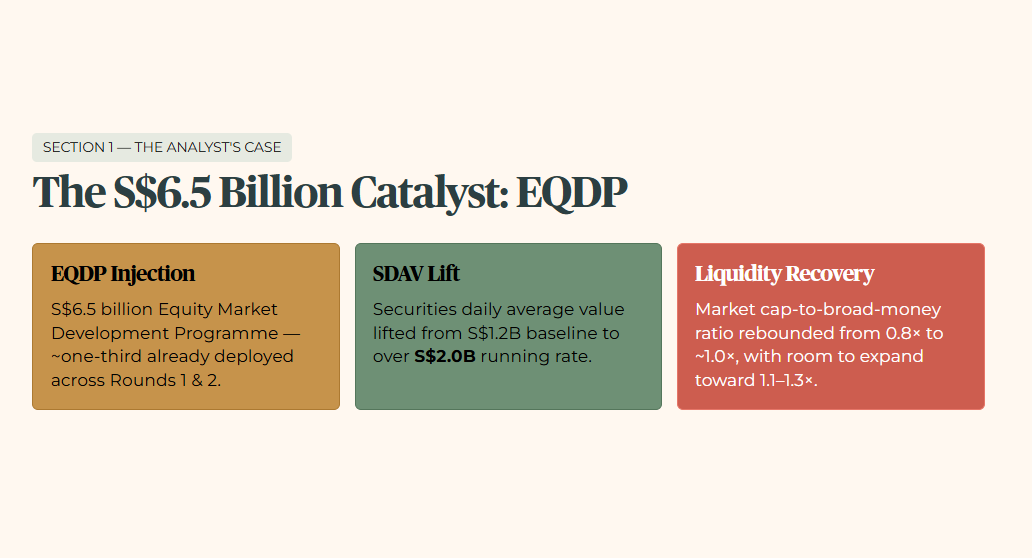
The architects of this institutional view point to massive, unprecedented government intervention as the primary catalyst. The S$6.5 billion Equity Market Development Programme (EQDP) is acting as a major liquidity driver. DBS estimates that roughly one-third of this capital has already been deployed across Rounds 1 and 2. This figure excludes additional private capital moving alongside the state framework.
This structural capital injection has successfully lifted securities daily average value (SDAV, the total value of shares traded each day) from its long-term baseline of S$1.2 billion to a current running rate of over S$2.0 billion. Furthermore, the macro data shows a sharp recovery in market liquidity. The ratio of total stock market capitalisation to broad money has rebounded from 0.8 times in the second half of 2025 to approximately 1.0 times today. The institutional view projects that this ratio has clear room to expand further toward its pre-COVID baseline range of 1.1 to 1.3 times.
Trading volume data across both cash equities and derivatives reinforces this short-term operational momentum.
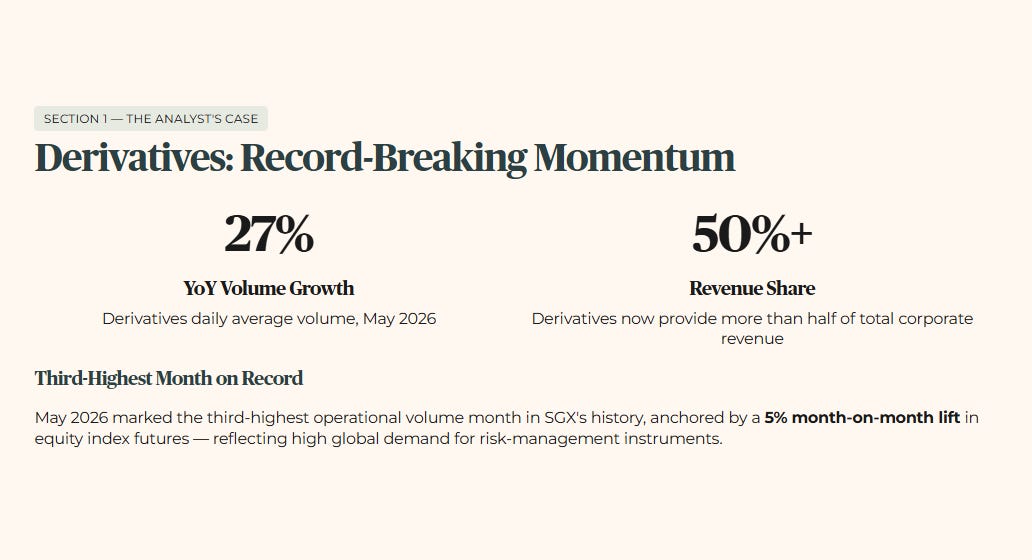
Derivatives Volumes: In May 2026, derivatives daily average volume expanded by 27% year-on-year and 9% month-on-month. This marked the third-highest operational volume month on record for the exchange. This was anchored by a 5% month-on-month lift in equity index futures, showing high global demand for risk-management instruments. Derivatives activity now provides more than half of total corporate revenue.
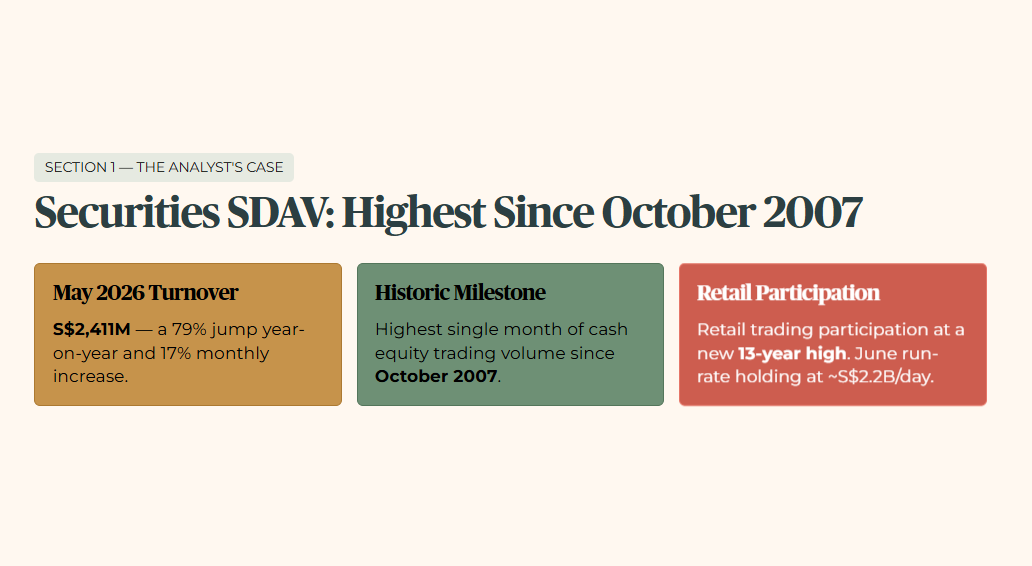
Securities SDAV: May 2026 securities turnover reached S$2,411 million. This represents a 79% jump year-on-year and a 17% monthly increase. This is the highest single month of cash equity trading volume since October 2007. Retail trading participation has simultaneously broken through to a new 13-year high. June turnover is maintaining a steady run-rate of approximately S$2.2 billion per day up to June 18.
Primary Listings: The institutional narrative emphasises a major turnaround in primary market listing activity. Singapore led Southeast Asia in IPO fundraising across 2025, with landmark listings including NTT DC REIT and Centurion Accommodation REIT. The current corporate pipeline indicates SGX is firmly on track for roughly 30 listings across 2026. This is supported by an operational dual-listing framework with Nasdaq to attract fast-growing technology companies.
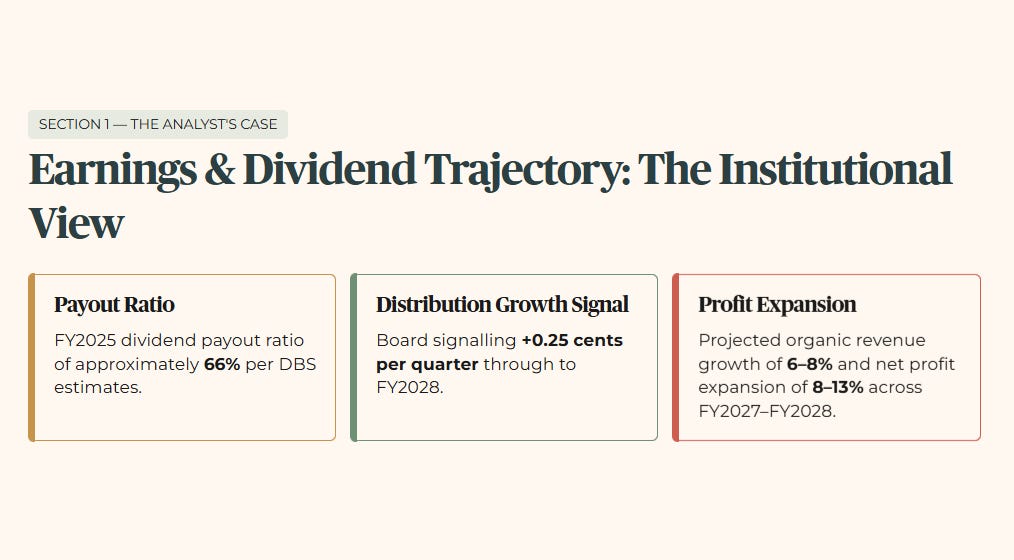
From an earnings and dividend perspective, the institutional view highlights management’s structured policy shift. In FY2025, the corporate dividend payout ratio was approximately 66% per DBS analyst estimates. The board is actively signalling an intent to raise distributions by 0.25 cents per quarter through to FY2028. This is backed by projected medium-term organic revenue growth of 6% to 8% and net profit expansion of 8% to 13% across FY2027 to FY2028. The institutional case argues that this capital appreciation and structural dividend growth justify paying an extreme premium multiple at the absolute peak of the market.

The Load-Bearing Assumption: The institutional buy case depends entirely on the assumption that unprecedented state liquidity injections via the S$6.5 billion EQDP have permanently shifted SGX into a high-volume, higher-multiple growth regime. This must offset an earnings yield that has compressed well below risk-free benchmarks.
Section 2 — Iggy’s Forensic Screen
When we apply a strict forensic screen to SGX, we are not checking whether trading volumes are high or whether the headline news looks positive. We are looking at the foundational parameters of financial safety and income generation for capital that cannot afford to be exposed to structural downside.
Layer 1 — Raw Fact
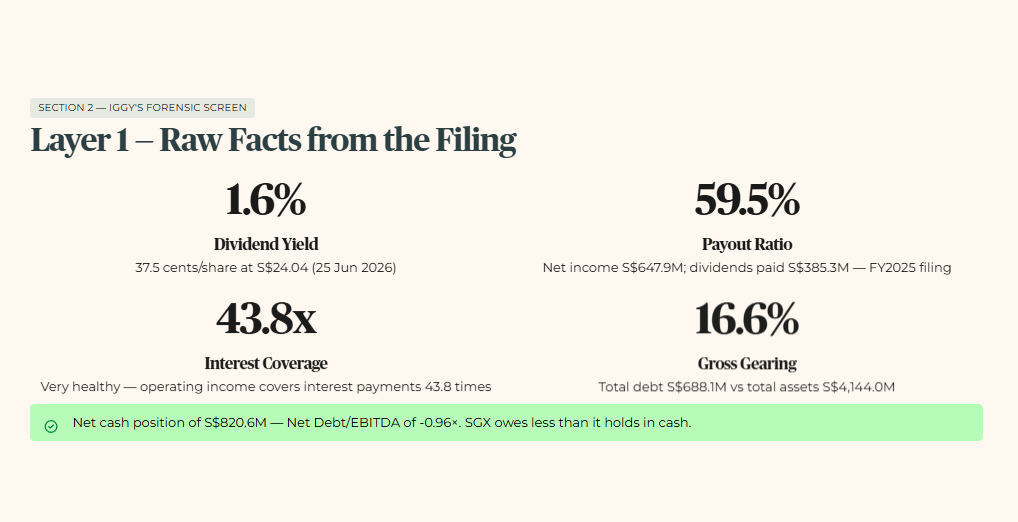
The verified dividend yield for SGX has compressed to 1.6%, based on a declared full-year ordinary dividend of 37.5 cents per share and a share price of S$24.04 as at June 25 2026. This is a direct consequence of heavy share price appreciation.
Management’s FY2025 filing confirms a dividend payout ratio of 59.5%, derived from net income of S$647.9 million and total dividends paid of S$385.3 million. This is the filing-level figure. The 59.5% ratio is historically consistent with SGX’s track record of 55% to 60% payouts.
Balance sheet metrics from SGX’s FY2025 filing confirm gross gearing (the proportion of total assets funded by debt) at 16.6%, with total debt of S$688.1 million against total assets of S$4,144.0 million. The interest coverage ratio (how many times operating income covers interest payments, abbreviated ICR) is at a very healthy 43.8 times. The company also holds a net cash position of S$820.6 million, resulting in a Net Debt to EBITDA ratio (total debt minus cash, divided by earnings before interest, tax, depreciation, and amortisation) of -0.96 times. SGX owes less than it holds in cash.
Layer 2 — Historical Benchmark
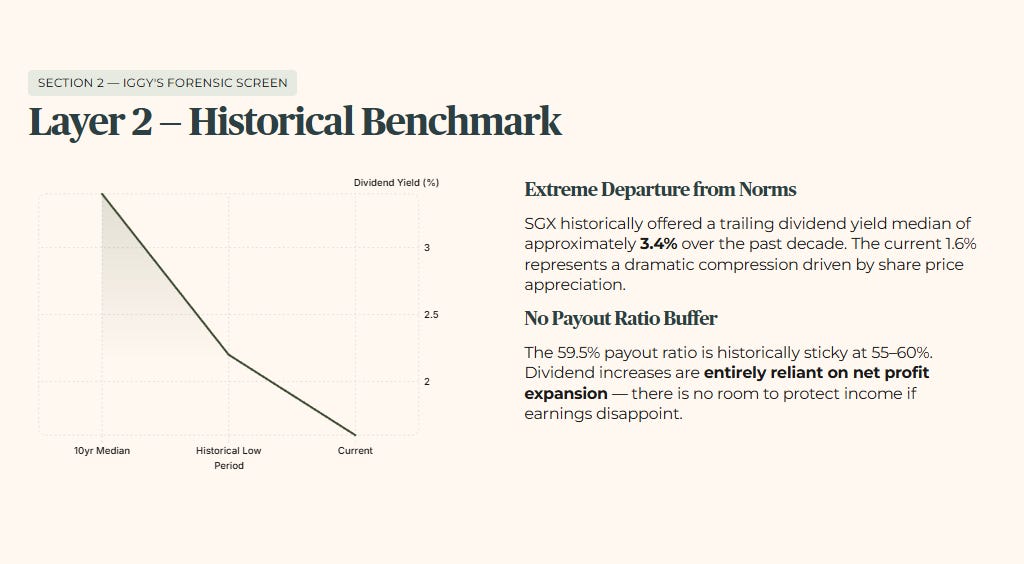
Historically, SGX has operated as a stable, defensive utility cash generator rather than a high-multiple growth stock. The compression of the dividend yield to 1.6% represents an extreme departure from historical norms. In the past, the company routinely offered defensive yield structures with a trailing dividend yield median of approximately 3.4% over the past decade.
The 59.5% payout ratio is historically sticky within the 55% to 60% band. This means that dividend increases are entirely reliant on net profit expansion. There is no meaningful room to increase the payout ratio to protect income if earnings disappoint.
Layer 3 — Peer Context
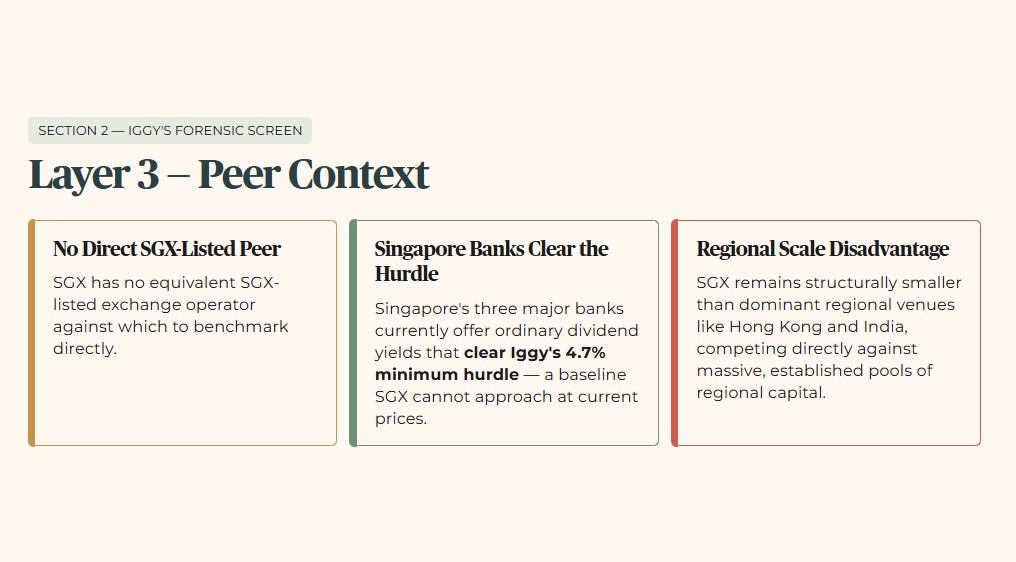
A direct peer comparison is structurally limited because SGX has no equivalent SGX-listed exchange operator against which to benchmark. Peer comparison table omitted. SGX has no directly comparable SGX-listed exchange operator peer. The Forensic Gap table in Section 4 serves as the structural substitute for this piece.
What can be said clearly is this: Singapore’s three major banks currently offer ordinary dividend yields that clear Iggy’s 4.7% minimum hurdle, a baseline SGX cannot approach at current prices.
On an international exchange basis, SGX remains structurally smaller than dominant regional venues like Hong Kong and India. This means its growth initiatives compete directly against massive, established pools of regional capital.
Layer 4 — Forward Scenario
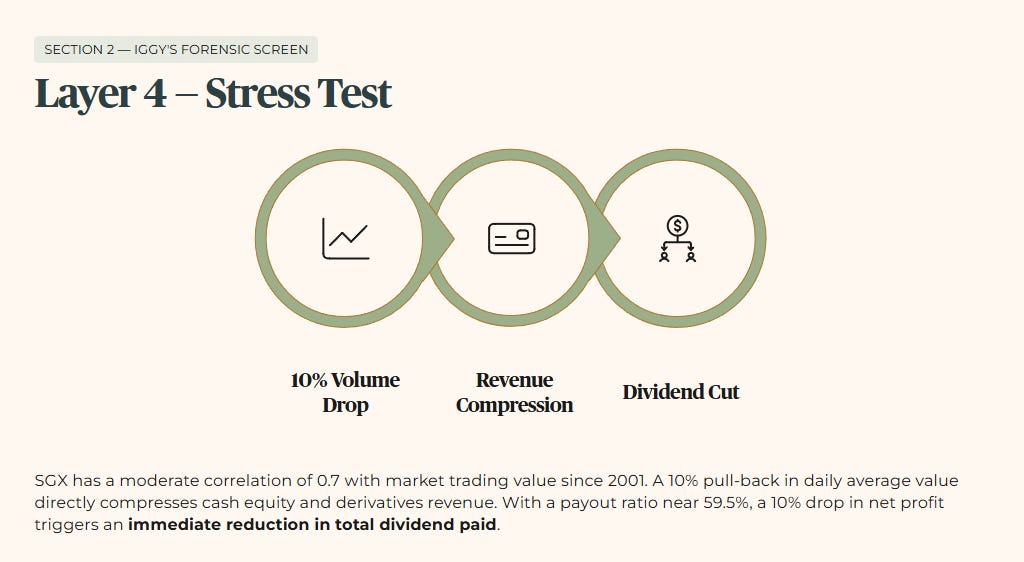
Let us run a stress test. Assume a 10% structural contraction in global trading volumes or a reduction in EQDP state support effectiveness. Because SGX has a moderate correlation of 0.7 with market trading value since 2001, a 10% pull-back in daily average value would directly compress cash equity and derivatives revenue lines.
Given the fixed-cost operating base required to run exchange infrastructure, net profit margins would compress. With a payout ratio near 59.5%, a 10% drop in net profit would trigger an immediate reduction in the total dividend paid. This would entirely remove the projected 0.25-cent quarterly increment and could reduce the baseline distribution.
Layer 5 — Wallet Impact
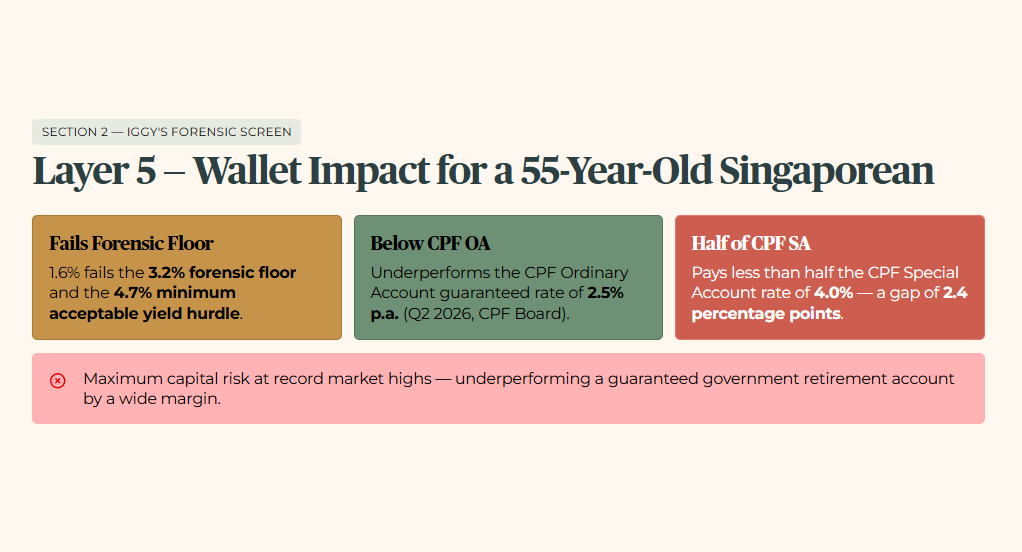
For a 55-year-old Singaporean investor, a 1.6% yield is a wealth-dilution mechanism. This return fails to clear my 3.2% forensic floor. It also fails the 4.7% minimum acceptable yield hurdle. Most critically, it underperforms the CPF Ordinary Account guaranteed rate of 2.5% per annum (Q2 2026, confirmed by CPF Board). It pays less than half of the 4.0% risk-free return offered by the CPF Special Account sanctuary (Q2 2026, confirmed by CPF Board), a gap of 2.4 percentage points.
To choose a volatile equity at record market highs with a 1.6% yield means you are taking maximum capital risk. In return, you are underperforming a guaranteed government retirement account by a wide margin.
The yield has already failed the 3.2% floor and the CPF benchmarks — but the next section’s zone classification calculation shows exactly how brutally that 1.6% figure drags a retirement portfolio out of the investable universe.
