



DBS’s Trading Income Fell 65%. Inside That Line, the Part That Isn’t Interest Fell 96% 🦖
A total can fall while one of its parts rises. DBS’s release shows it twice, in markets trading income and in net interest income. Here is what each line did, and which dates apply to the 81 cent dividend.
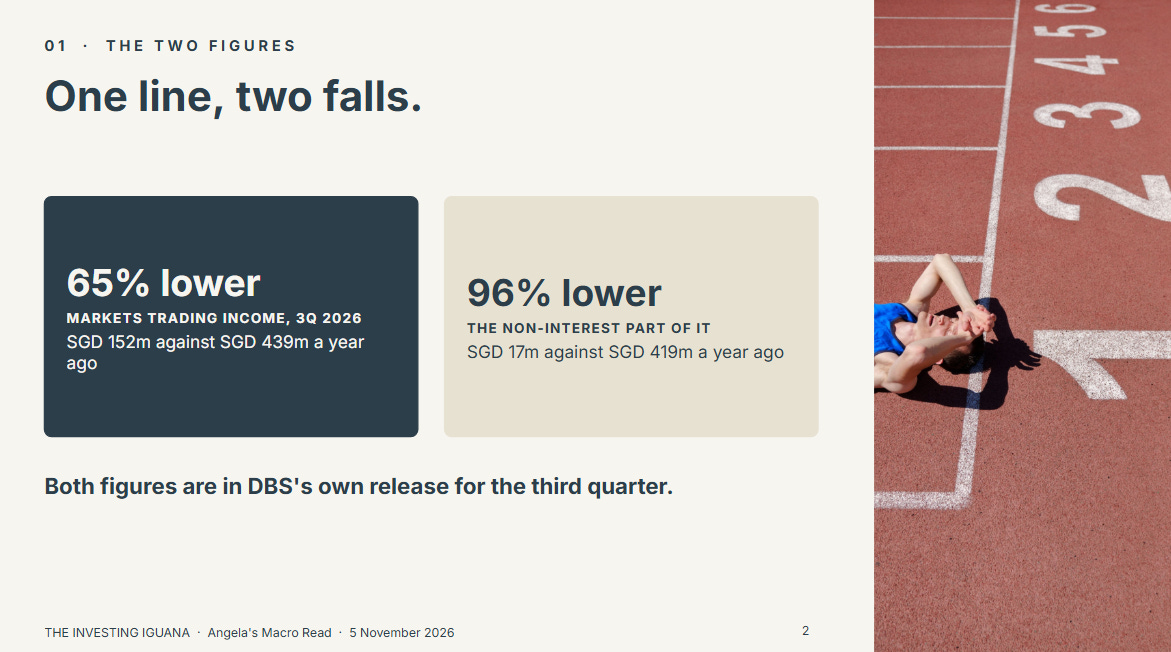
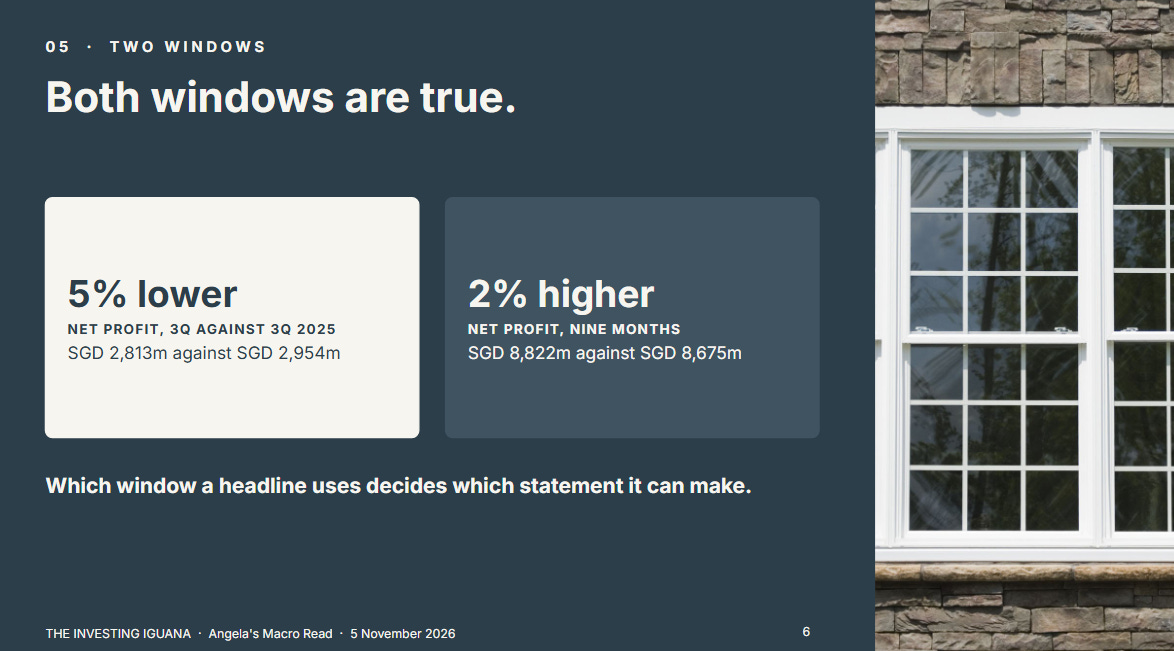
DBS reported net profit of SGD 2.81 billion for the third quarter, 5% lower than a year ago and 9% lower than the previous quarter. In the same release it called the nine months a record, with net profit up 2% to SGD 8.82 billion. Both statements are true. DBS names markets trading income as the line that pulled the quarter down: SGD 152 million, 65% lower than a year ago.
What I found worth slowing down for is a table further into the release. It shows what sits inside that SGD 152 million, and the part that is not interest income fell by far more than 65%. I want to walk through that table and the lines around it before anyone fits them into a story.
I am not a bank analyst, and I take no view on what DBS’s shares will do or whether anyone should own them. I read two documents DBS published on 5 November 2026: the Trading Update for the third quarter ended 30 September 2026, including its summary tables, and the CFO presentation for the same quarter. I have not read the full financial statements or the Pillar 3 disclosures, so anything that sits only in them is outside this piece. If you own DBS, or a fund or an ETF that holds it, the practical questions are which lines changed since last quarter, what the bank said about why, and which dates apply to the dividend.
What This Piece Does
It sets out DBS’s third quarter in the bank’s own figures, beside the previous quarter and the same quarter a year ago.
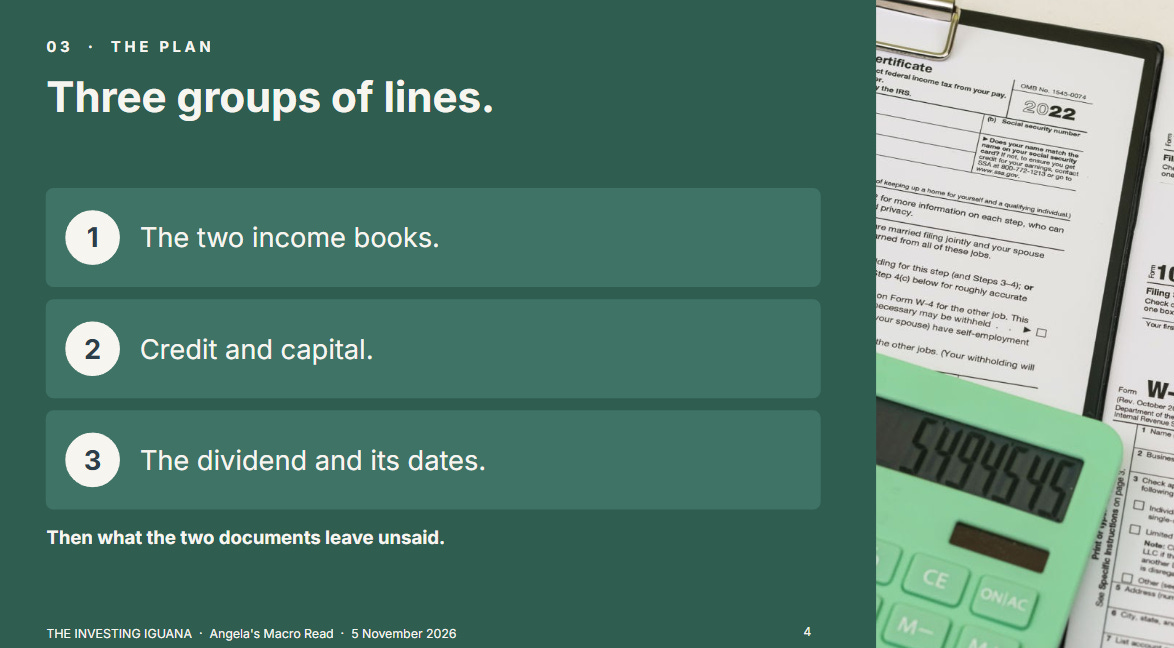
It reads three groups of lines: the two income books, the credit and capital figures, and the dividend.
It says what the two documents do not say, and where Iggy’s report on the Singapore banks picks up.
The income books, Angela’s first Observation and the credit figures are free to read. The capital and liquidity figures, the dividend and its dates, the outlook, what the two documents do not say and my second Observation are for paid members. Nothing here is advice on your own holdings.

What This Piece Does
The Quarter in One Table
Two Income Books
What sits inside the SGD 152 million
Where the 4% in net interest income landed
The lines that held
Angela’s Observation
What the Credit Lines Say
The Paid Half Adds
Capital and Liquidity
The Dividend
The Outlook DBS Gave
What the Two Documents Do Not Say
Angela’s Observation
Iggy’s Forensic Read
Sources
The Quarter in One Table
All figures are DBS’s own, in SGD million unless shown as a percentage, from the summary table in the Trading Update.
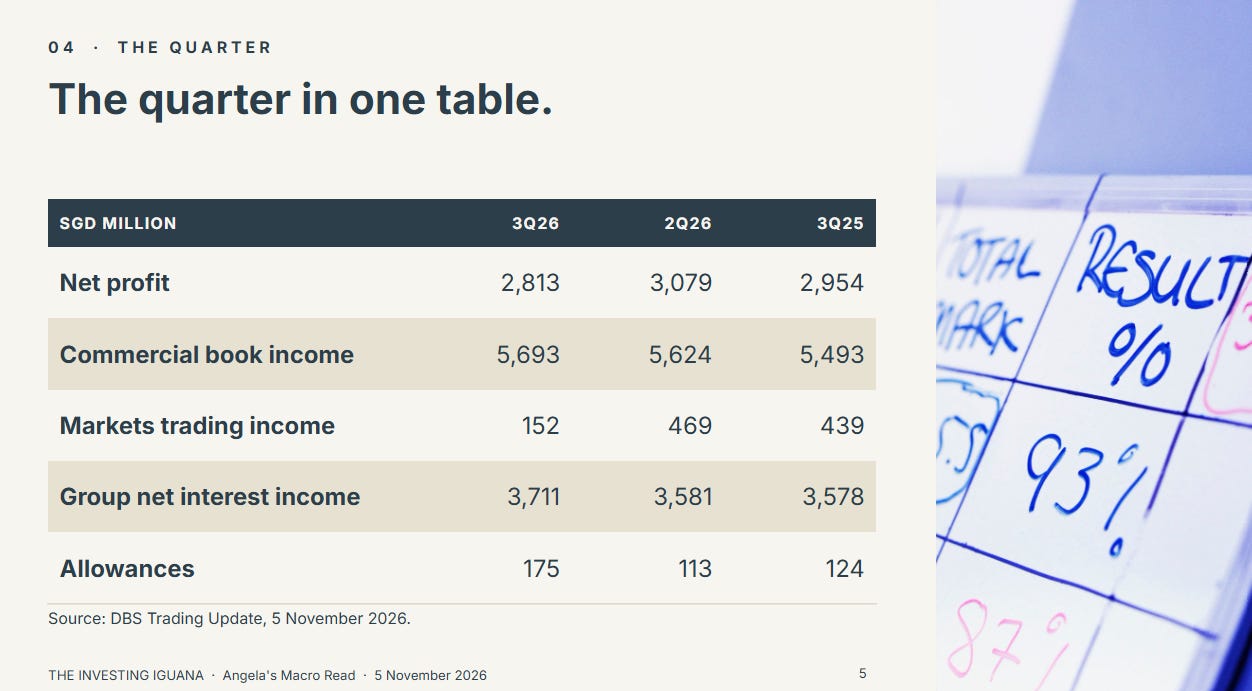
Net profit fell 5% against a year ago and 9% against the previous quarter. For the nine months it rose 2%, from SGD 8,675 million to SGD 8,822 million. Which window a headline uses decides which of those statements it can make, so I keep all three columns in view.
Two Income Books
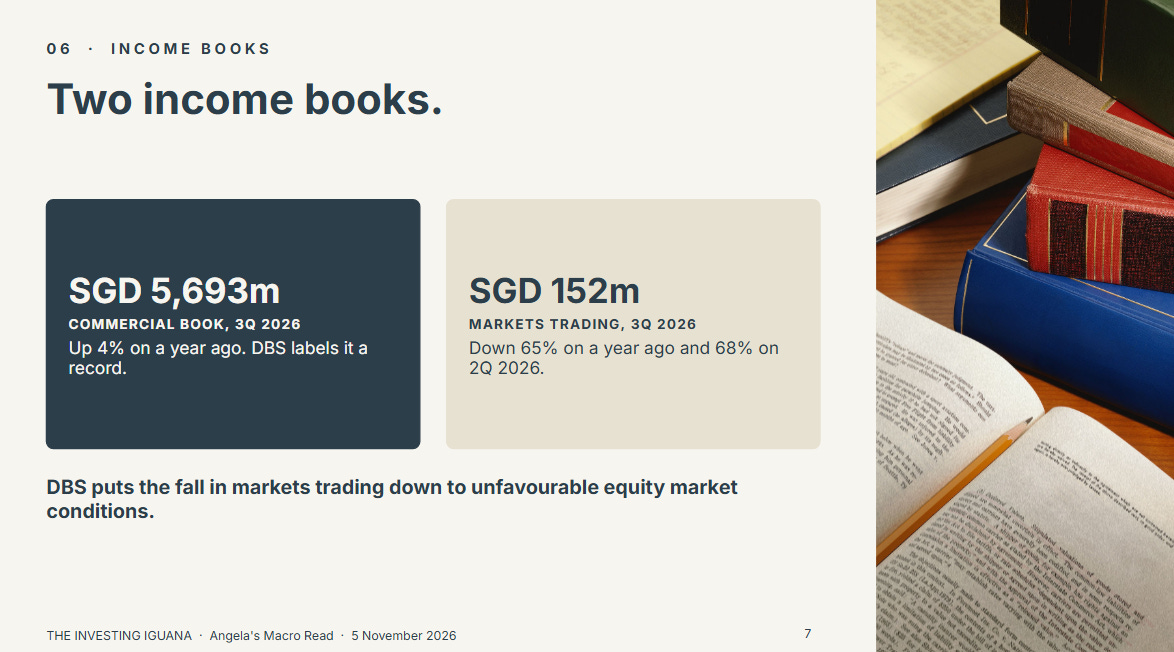
DBS reports its income in two books. The commercial book holds net interest income, fee and commission income, and treasury customer sales and other income. Markets trading income is reported separately. In the third quarter the commercial book earned SGD 5,693 million, up 4% on a year ago, and DBS labels it a record. Markets trading income was SGD 152 million, down 65% from SGD 439 million a year ago and down 68% from SGD 469 million in the second quarter. DBS puts the fall down to unfavourable equity market conditions.
DBS’s bridge for the profit fall
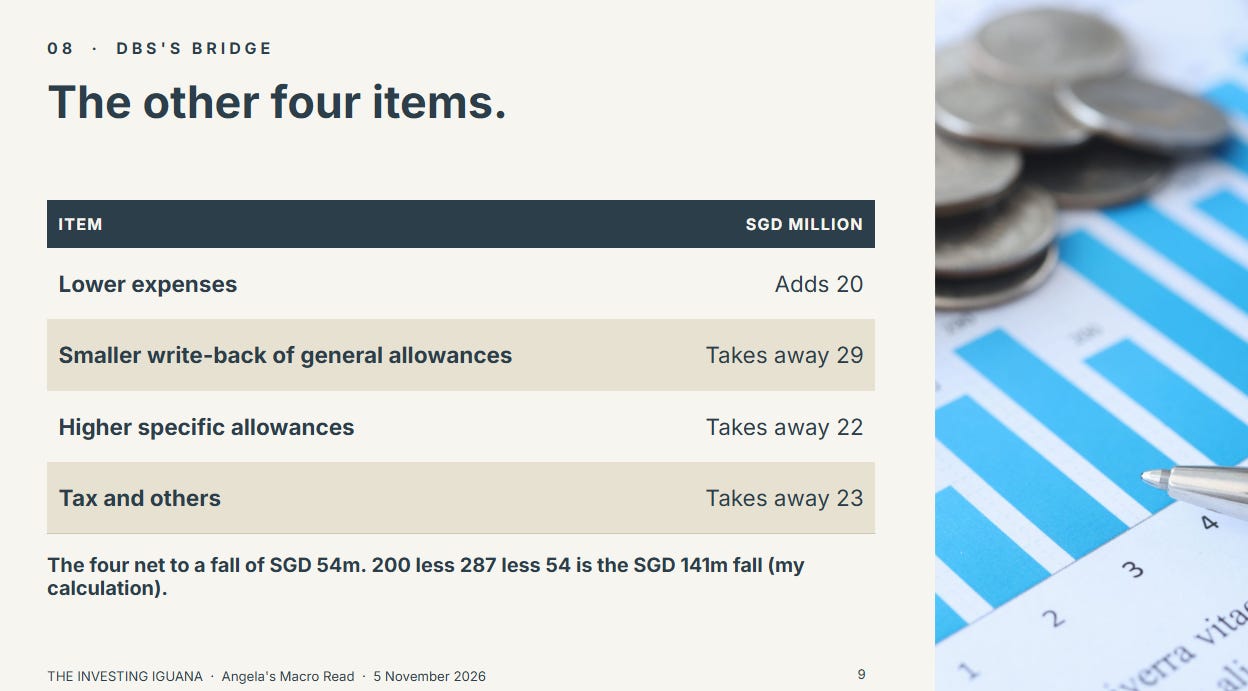
The presentation has a chart that walks net profit from SGD 2,954 million a year ago to SGD 2,813 million. On it, commercial book net interest income adds SGD 18 million, fee income adds SGD 75 million, and treasury customer sales and other income adds SGD 107 million. Together that is SGD 200 million (my own arithmetic). Markets trading income takes away SGD 287 million, which is the 439 less 152. The remaining items on the chart are lower expenses, which add SGD 20 million, and three items that subtract: a smaller write-back of general allowances (SGD 29 million), higher specific allowances (SGD 22 million), and tax and other items (SGD 23 million). The three subtract SGD 74 million, so the four net to a further fall of SGD 54 million (my own arithmetic). Add 200, subtract 287 and subtract 54, and you reach the SGD 141 million fall in net profit.
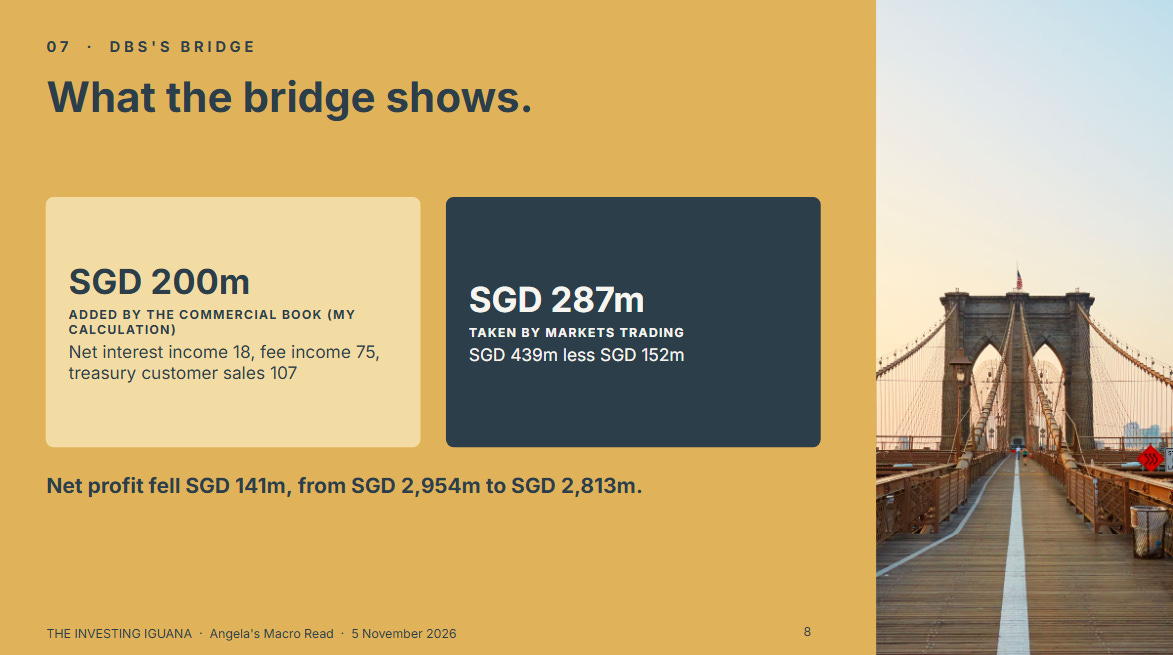
So the commercial book was not the weak part of this quarter. One line took away more than the three income lines of the commercial book added.
What sits inside the SGD 152 million
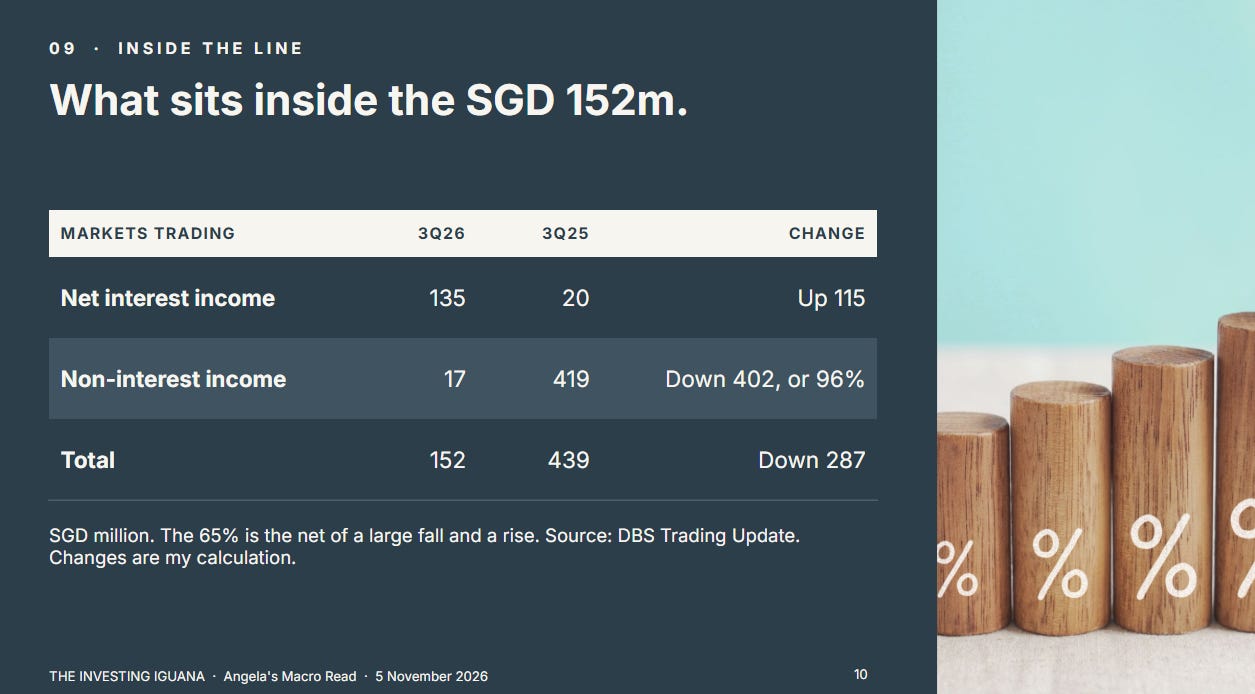
The summary table splits markets trading income in two. Its net interest income was SGD 135 million, against SGD 20 million a year ago. Its non-interest income was SGD 17 million, against SGD 419 million a year ago, a fall of 96%. The two parts add to SGD 152 million and SGD 439 million. The non-interest part fell by SGD 402 million and the interest part rose by SGD 115 million (my own arithmetic), and the 65% is the net of the two.
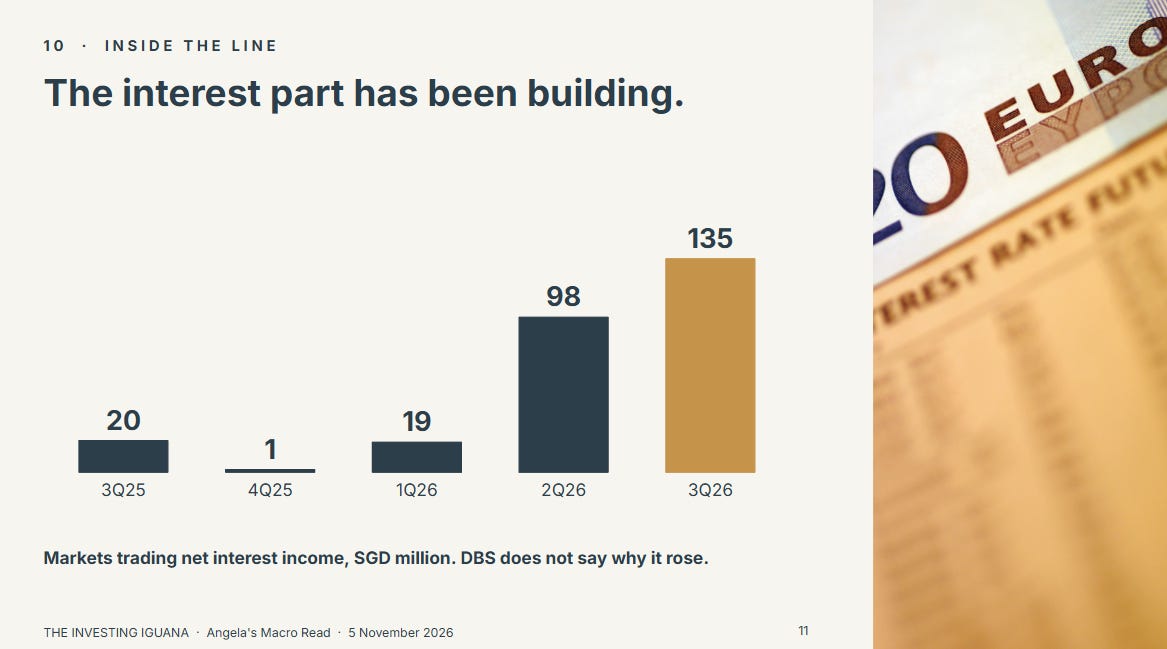
The presentation’s chart of net interest income shows the markets trading amount at SGD 20 million, SGD 1 million, SGD 19 million, SGD 98 million and SGD 135 million over the last five quarters, so the rise has built over the last three. DBS describes the fall in markets trading income as due to market conditions. The documents I read do not say why the interest part rose, and I will not supply a reason.
Where the 4% in net interest income landed
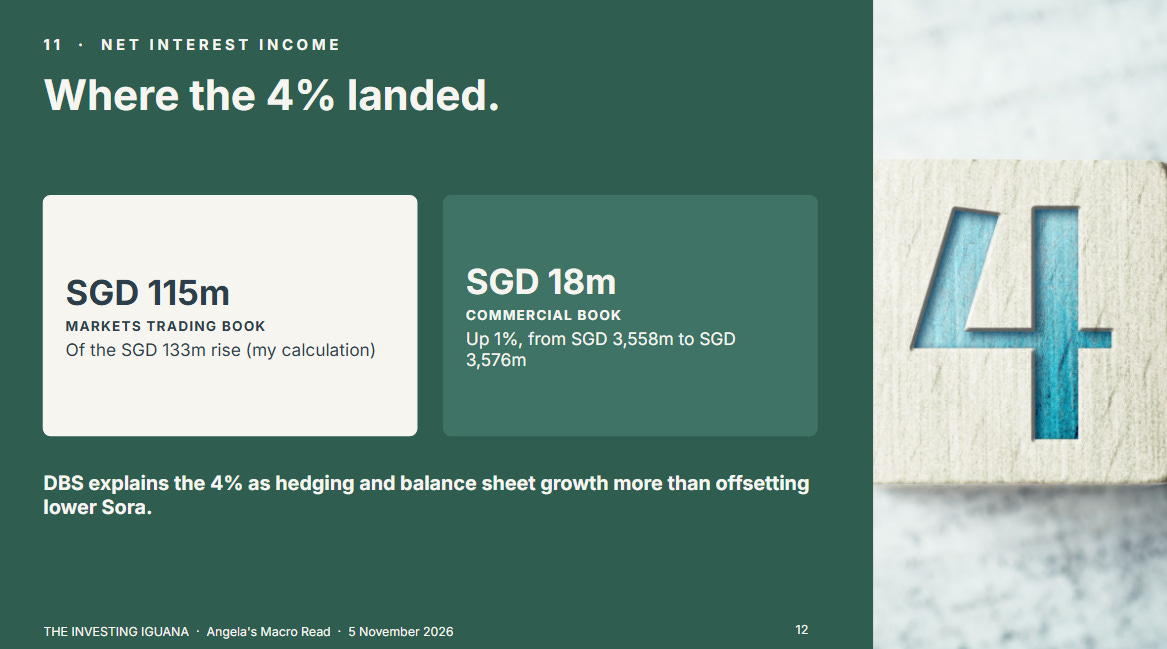
DBS reports group net interest income up 4% to SGD 3,711 million, and explains it as proactive hedging and balance sheet growth more than offsetting lower Sora. The table shows where the rise landed. Of the SGD 133 million increase from a year ago, SGD 115 million sits in the markets trading book and SGD 18 million in the commercial book (my own arithmetic). Commercial book net interest income rose 1%, from SGD 3,558 million to SGD 3,576 million.
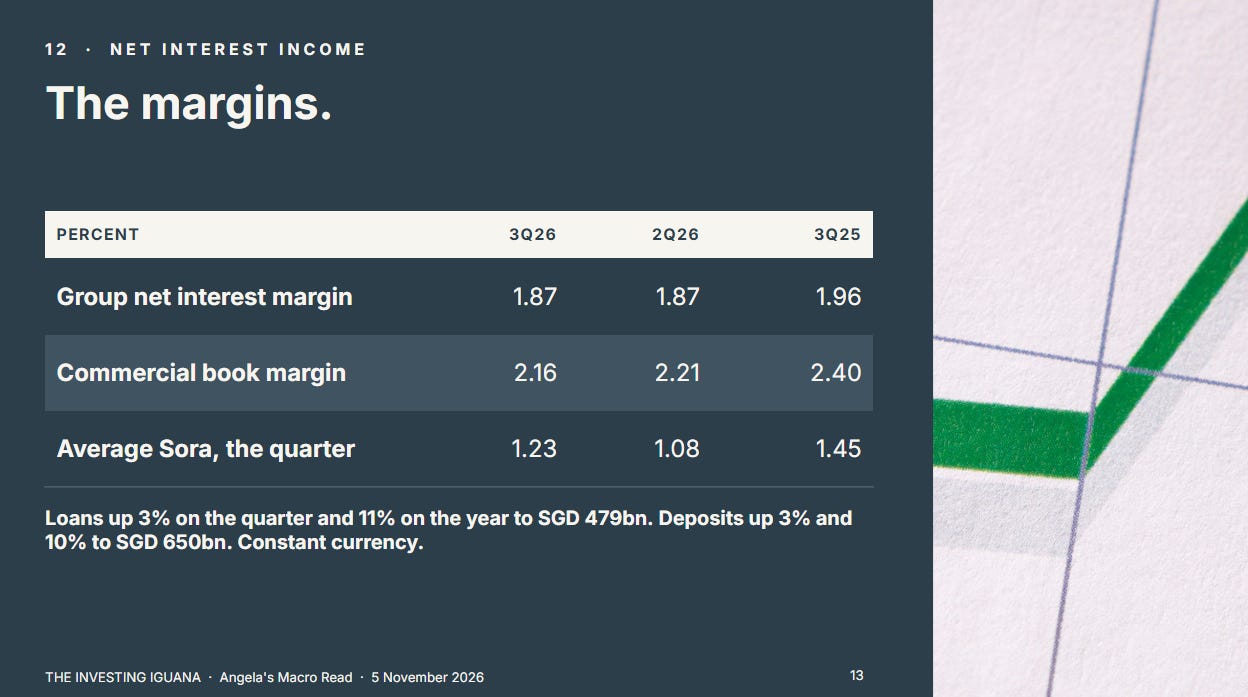
The group net interest margin was 1.87%, unchanged from the second quarter and nine basis points lower than the 1.96% of a year ago. The commercial book margin was 2.16%, against 2.21% in the second quarter and 2.40% a year ago. Average Sora for the third quarter was 1.23%, against 1.08% in the second quarter and 1.45% a year ago. Loans rose 3% on the quarter and 11% on the year in constant-currency terms, to SGD 479 billion. Deposits rose 3% and 10%, to SGD 650 billion.
The lines that held
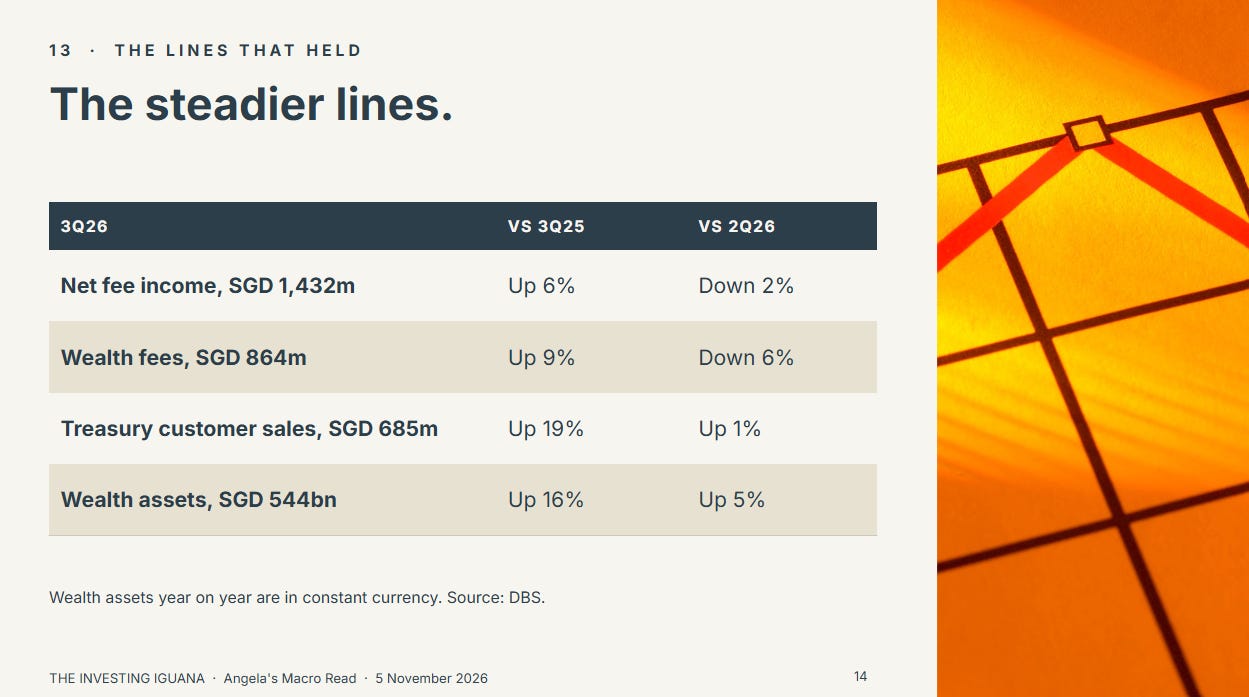
Net fee income was SGD 1,432 million, up 6% on a year ago and down 2% on the quarter. Wealth management fees were SGD 864 million, up 9% on a year ago from a high base and down 6% on the quarter. DBS says customer investment activity moderated from a strong second quarter. Wealth assets under management reached a new high of SGD 544 billion, up 16% on a year ago in constant-currency terms and 5% on the quarter, and the presentation headlines net new money of SGD 15 billion as record third-quarter inflows. Treasury customer sales and other income was SGD 685 million, up 19% on a year ago and near the previous quarter’s record.
🟠 Angela’s Observation
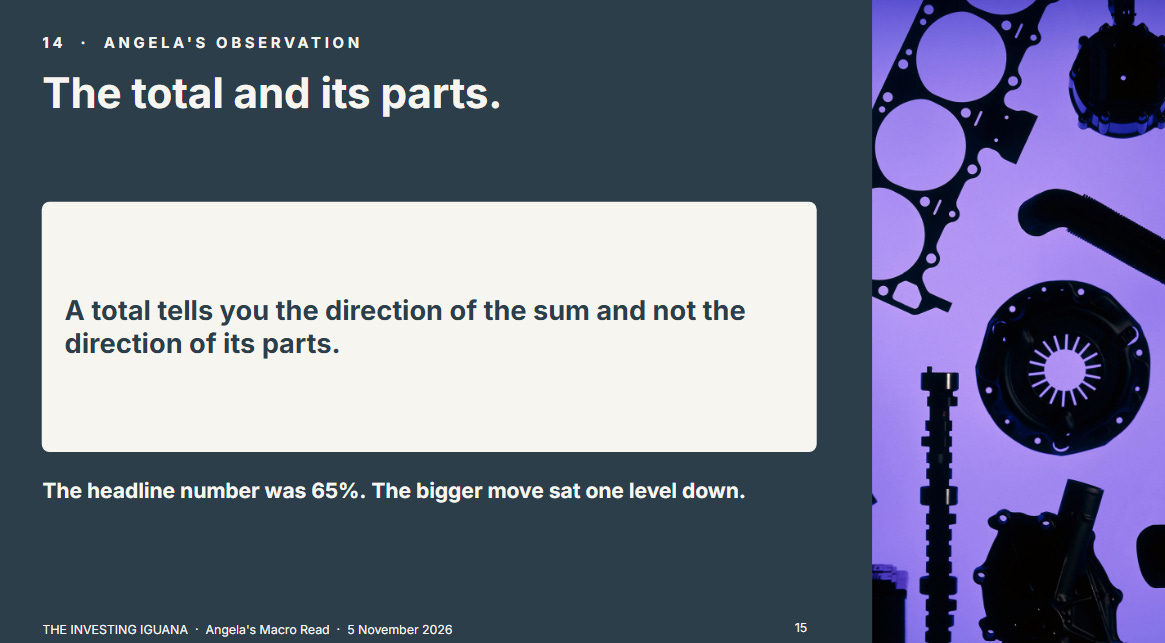
A headline carries one number, and it is usually the number that is easiest to compare. For this quarter that number is 65%, the fall in markets trading income. The release’s own table shows a larger move, 96%, one level down, inside a line that also contains a rise. I notice the same thing in the 4% for net interest income, which is also a sum of a book that moved by 1% and a book that moved a lot more. My reading is that a total tells you the direction of the sum and not the direction of its parts. When I read a total, do I ask what is inside it, or only what it did?
What the Credit Lines Say
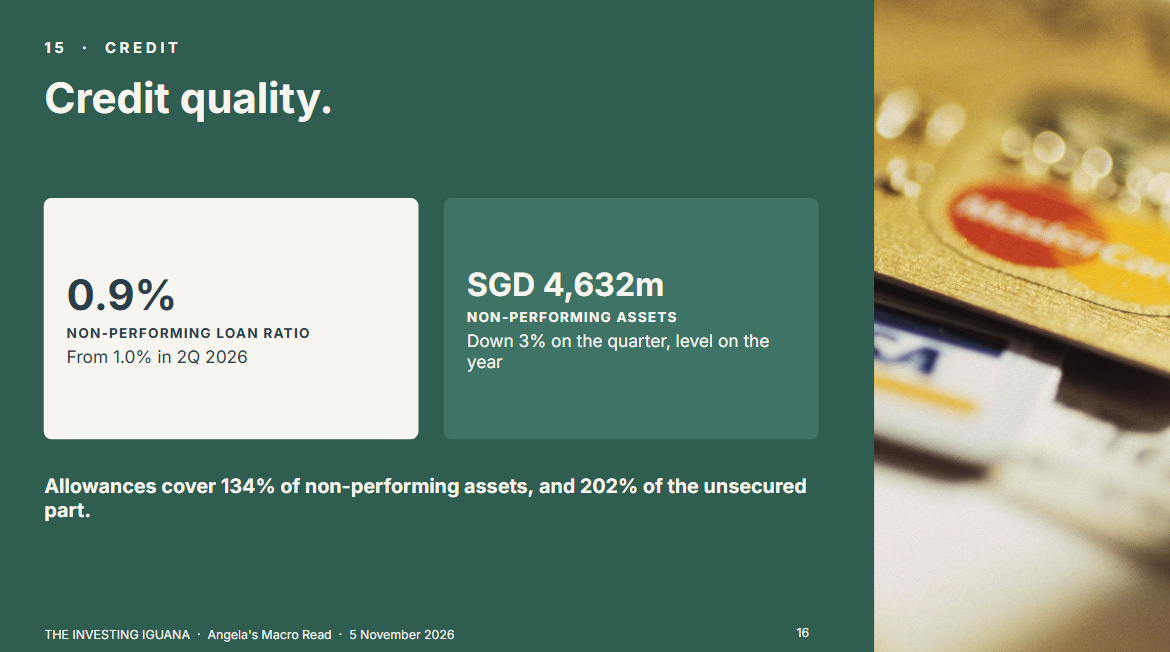
DBS’s non-performing loan ratio was 0.9%, from 1.0% in the second quarter and a year ago. Non-performing assets were SGD 4,632 million, down 3% from SGD 4,764 million in the second quarter and level with the SGD 4,627 million of a year ago. DBS says new non-performing asset formation was more than offset by repayments and write-offs.
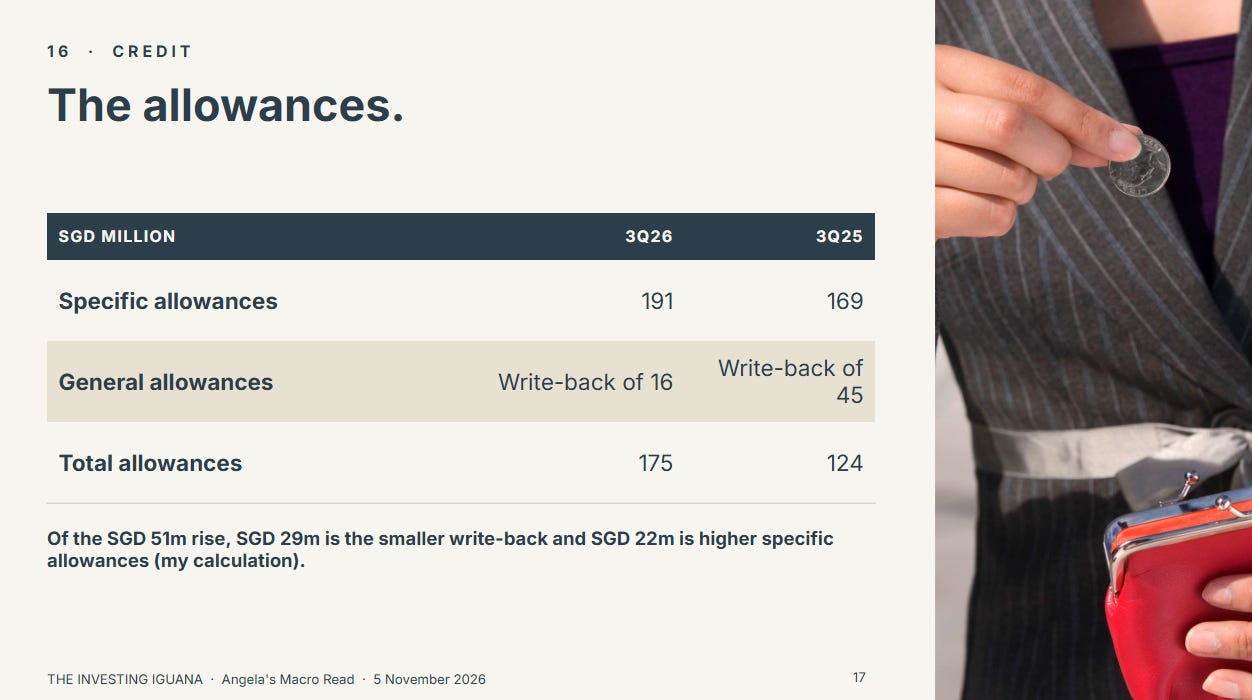
Specific allowances were SGD 191 million, 17 basis points of loans, up from SGD 169 million a year ago. General allowances were a write-back of SGD 16 million, against a write-back of SGD 45 million a year ago and SGD 75 million in the second quarter. Total allowances for credit and other losses were therefore SGD 175 million, against SGD 124 million a year ago, a rise of 41%. Of the SGD 51 million rise, SGD 29 million comes from the smaller write-back of general allowances and SGD 22 million from higher specific allowances (my own arithmetic).
Total allowances covered 134% of non-performing assets and 202% of the unsecured part, against 139% and 229% a year ago. The stock of general allowances stood at SGD 3,786 million at 30 September, against SGD 3,812 million at 30 June and SGD 4,071 million at 30 September 2025.
What the Paid Half Adds
The credit lines above close the free half. The paid half takes up what they leave open: how far the reported Common Equity Tier 1 ratio fell and what DBS says about the MAS multiplier change, how the 81 cent dividend and its dates sit against the quarter’s profit and the last three years, what DBS says about its outlook, the list of what the two documents do not say, and my second Observation on why the dividend did not follow profit. Paid members get the full written analysis for its depth, not for any earlier access. Substack Only is US$8 a month for the full written analysis, portfolio walkthroughs and analyst cheatsheets. YouTube Only is S$5 a month for the full-length Members Edition video. The YouTube/Substack Combo is S$12 a month and includes all of it.
🔒 What’s Next
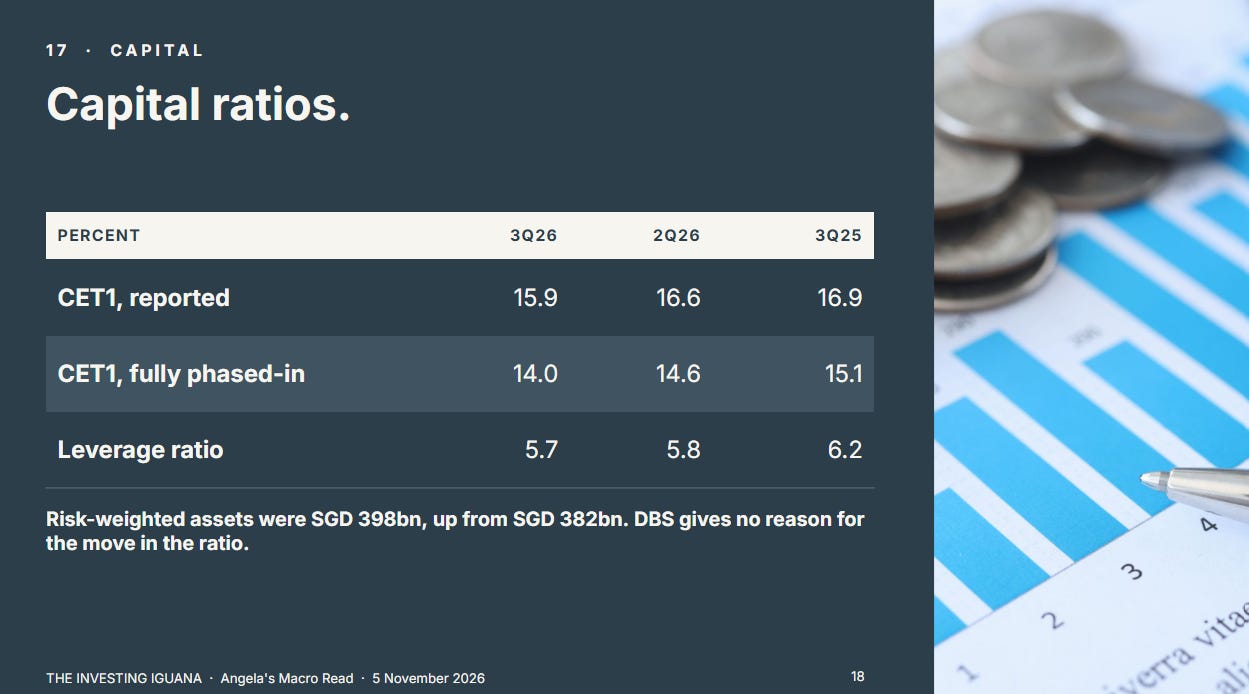
Credit looked steady above, yet the Common Equity Tier 1 ratio in the next section fell from 16.6% to 15.9% in the same quarter, and the documents do not say why.
