

Debt Hits 39%, Profits Drop 4.9% | Digital Core REIT Q1 2026 Deep Dive | 🦖EP1573
And it’s not the 6.9% yield. It’s whether 3.3x interest safety survives the next rate hike

Digital Core REIT (DCRU) — 1Q26 Forensic Earnings Audit
The Uncomfortable Number: Leverage Above the Forensic Ceiling in a High-Rate World
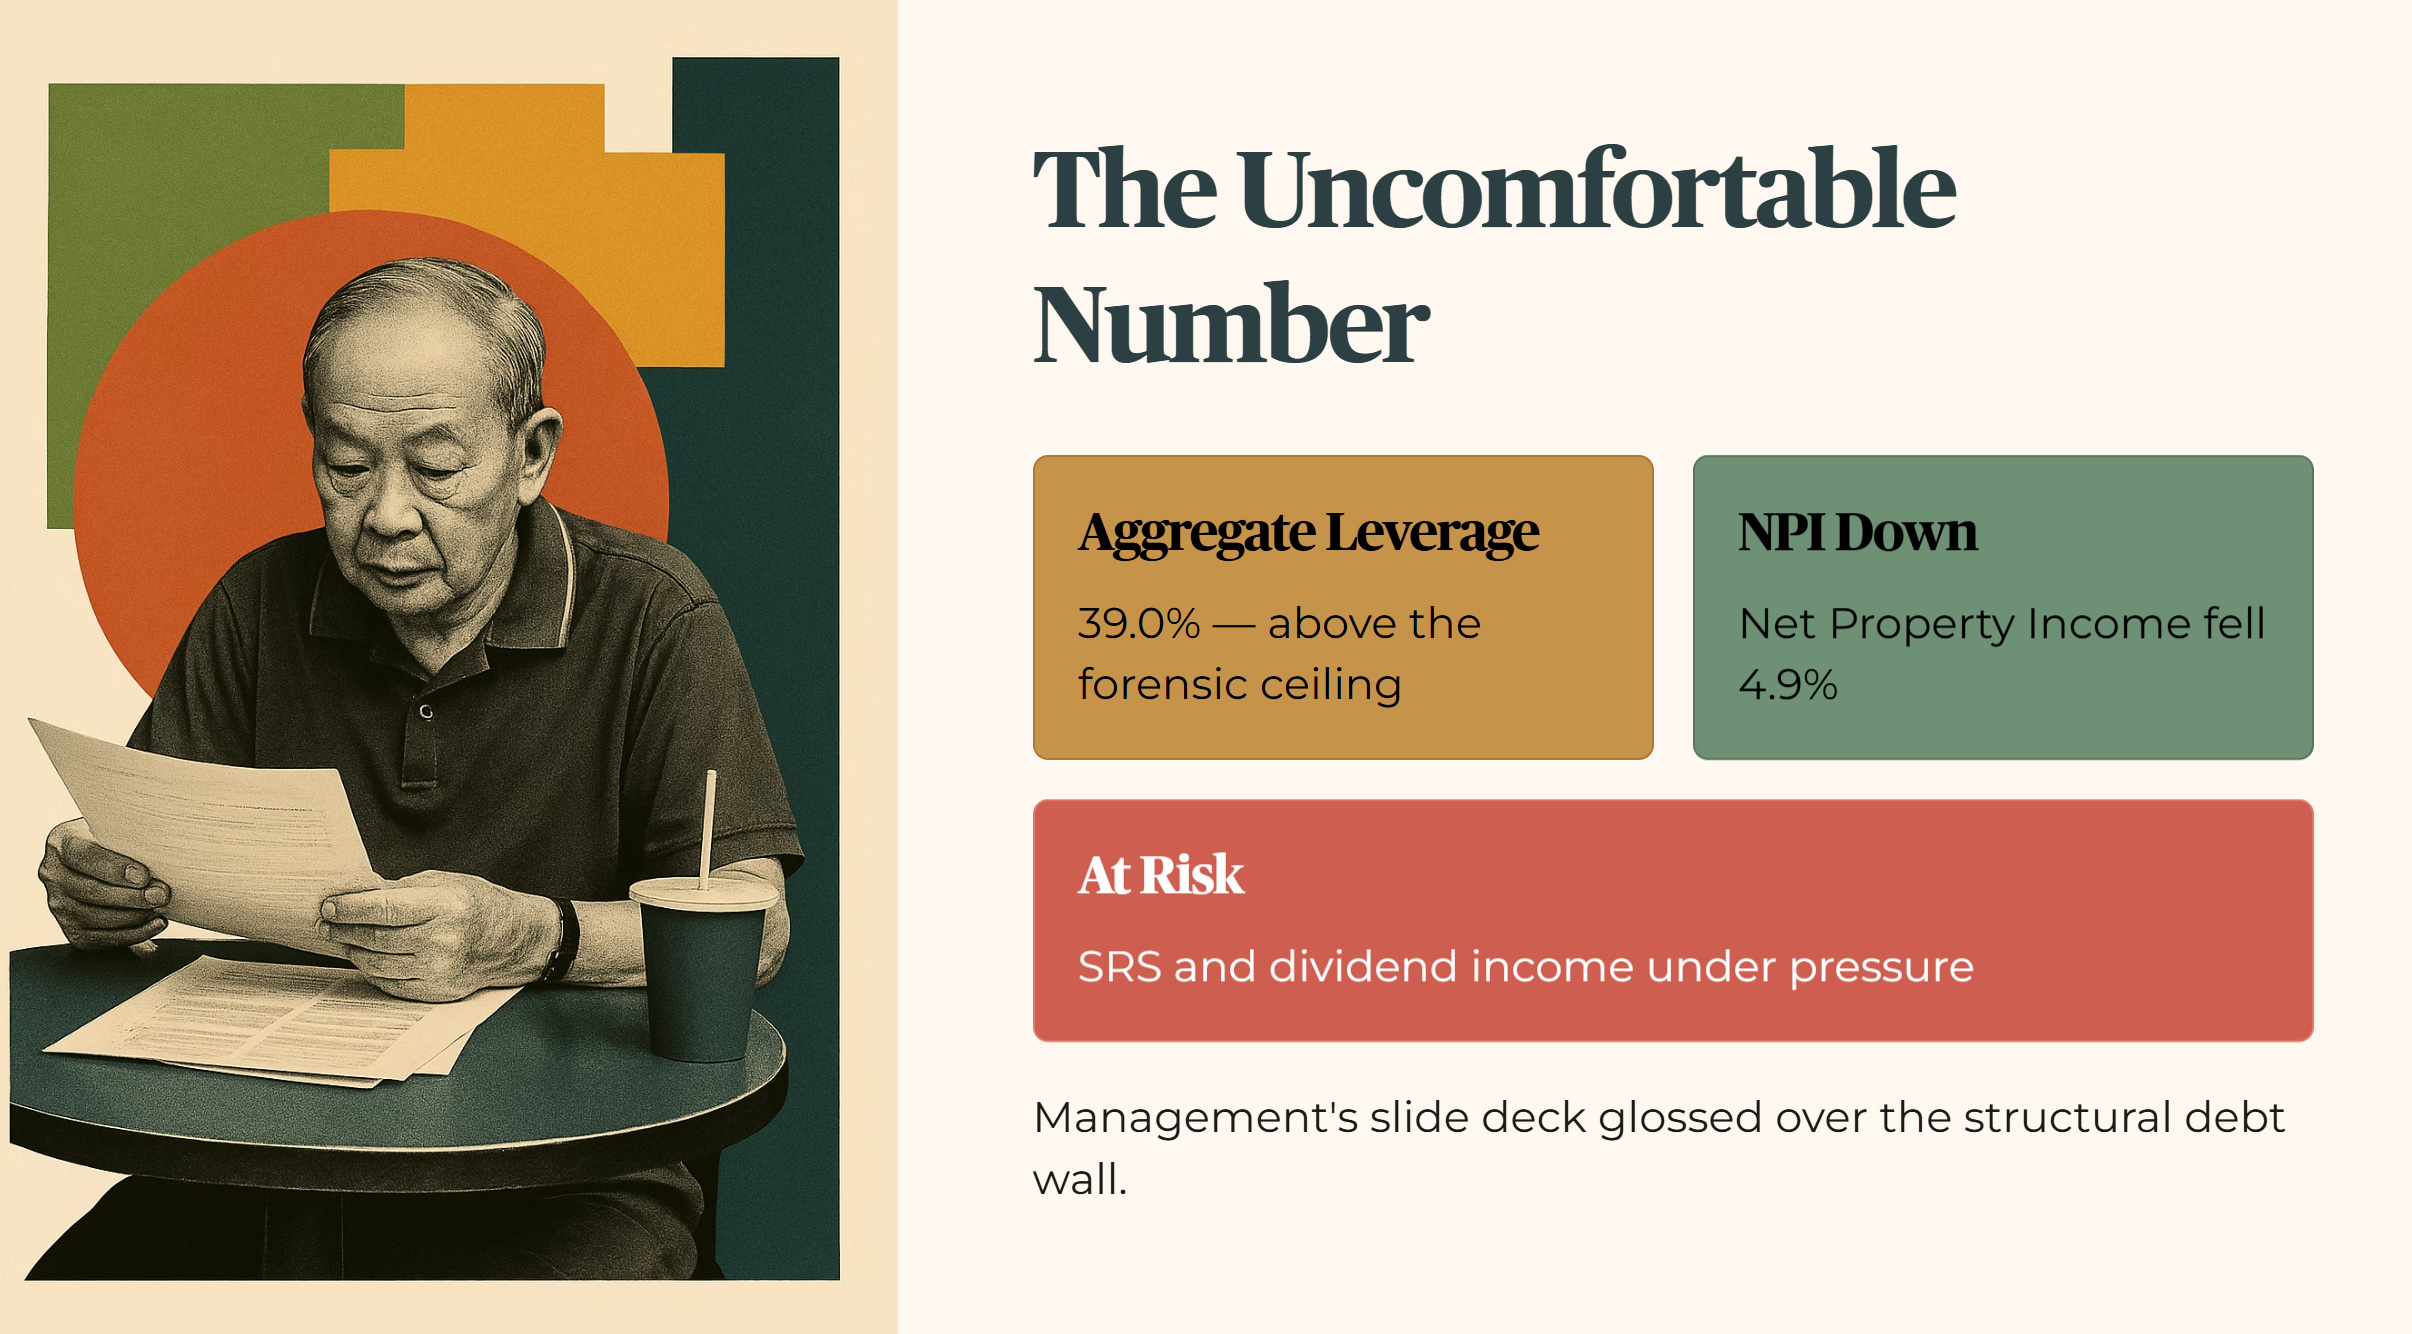
Management’s own filing states Aggregate Leverage at 39.0%, calculated under MAS Property Fund Guidelines, while Net Property Income is down 4.9%. This spike puts your SRS and dividend income at risk. The safety margin for interest payments continues to thin. This forensic audit will expose the structural debt wall management’s slide deck carefully glossed over.

In This Article:
Slide-by-Slide Audit Core Sustainable Growth Narrative
Operational Health Occupancy Concentration and Tenant Risk
Balance Sheet Stress Test Leverage and Interest Coverage
Reality Check Net Asset Value Market Pricing and Buybacks
Forward Outlook AI Inference Power Constraints and Scenario Analysis
Iggy’s Insight Northern Virginia Tax Exemption Legislative Overhang
Forensic Scorecard Yield Spread Debt Health and Income Sustainability
Outro Forensic Stance Portfolio Role Classification and Disclaimer
The Slide-by-Slide Audit: Behind the Sustainable Growth Narrative
Management opened the 1Q26 update with the headline “Core Sustainable Growth.” When we look at the Consolidated Statement of Comprehensive Income, the growth is difficult to find in actual operations.
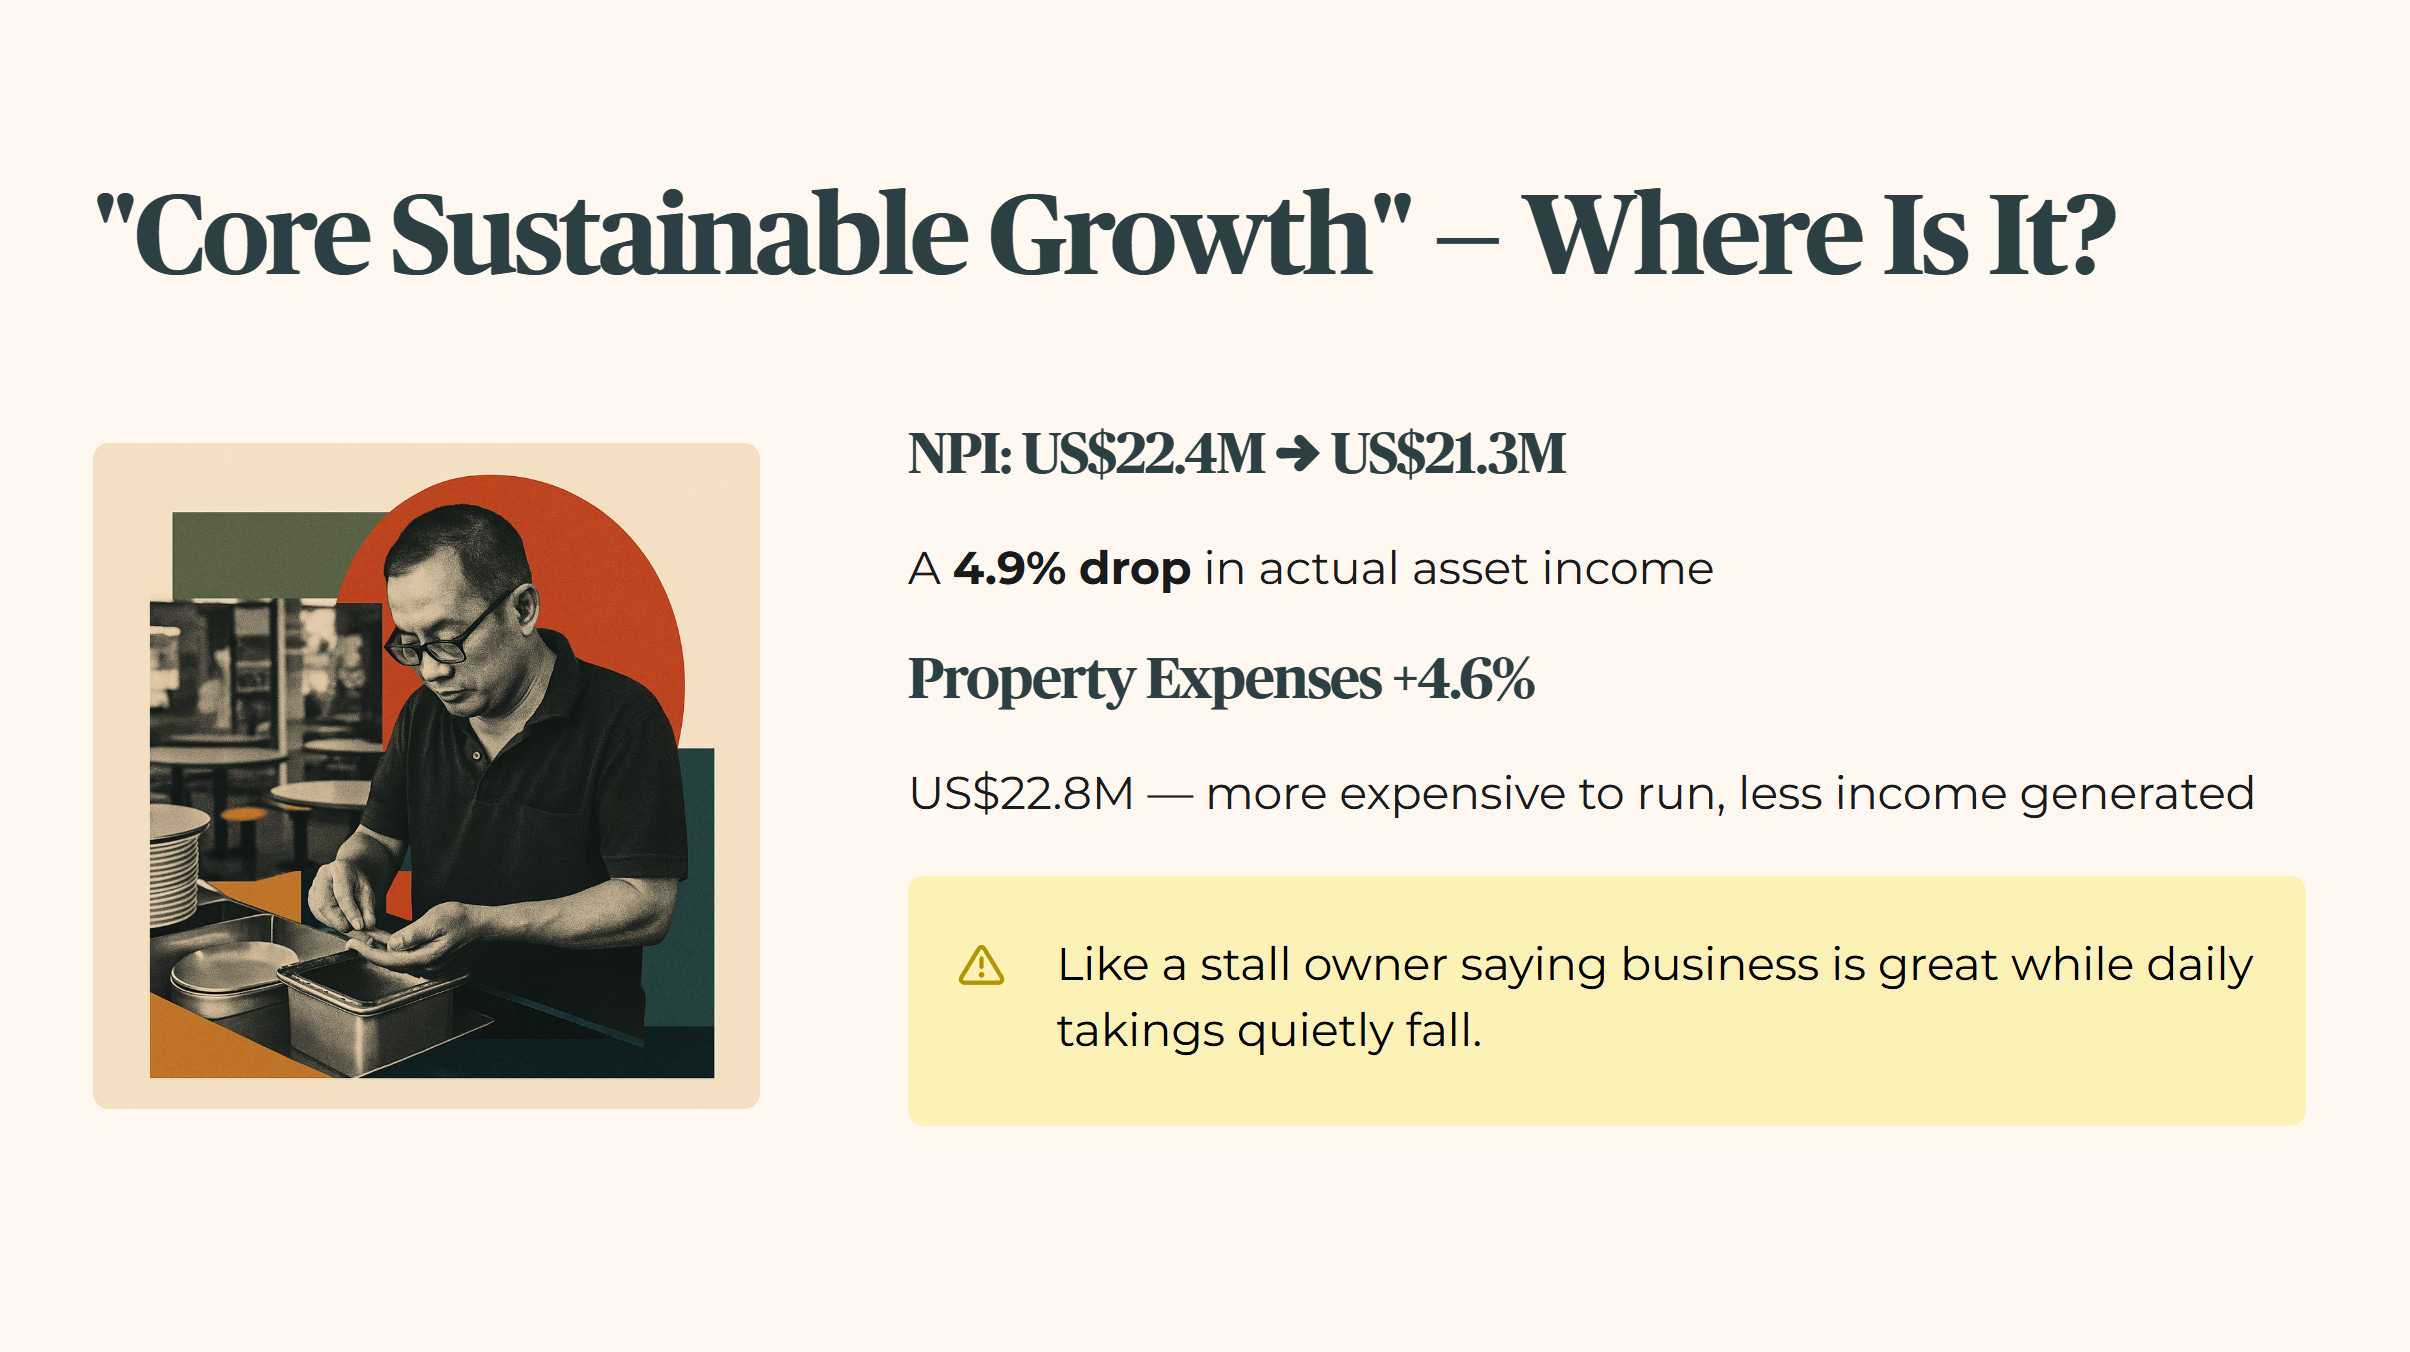
The more concerning figure is the Net Property Income. NPI — the actual profit left after paying for property taxes and maintenance, the fuel for your dividends — fell from US$22.4 million in the prior year to US$21.3 million. That is a 4.9% drop in the money actually coming from the assets. Property expenses jumped 4.6% to US$22.8 million. Management is running a more expensive operation while income from the assets shrinks. In our heartlands, this is like a stall owner telling you business is great while his daily takings are quietly going down.
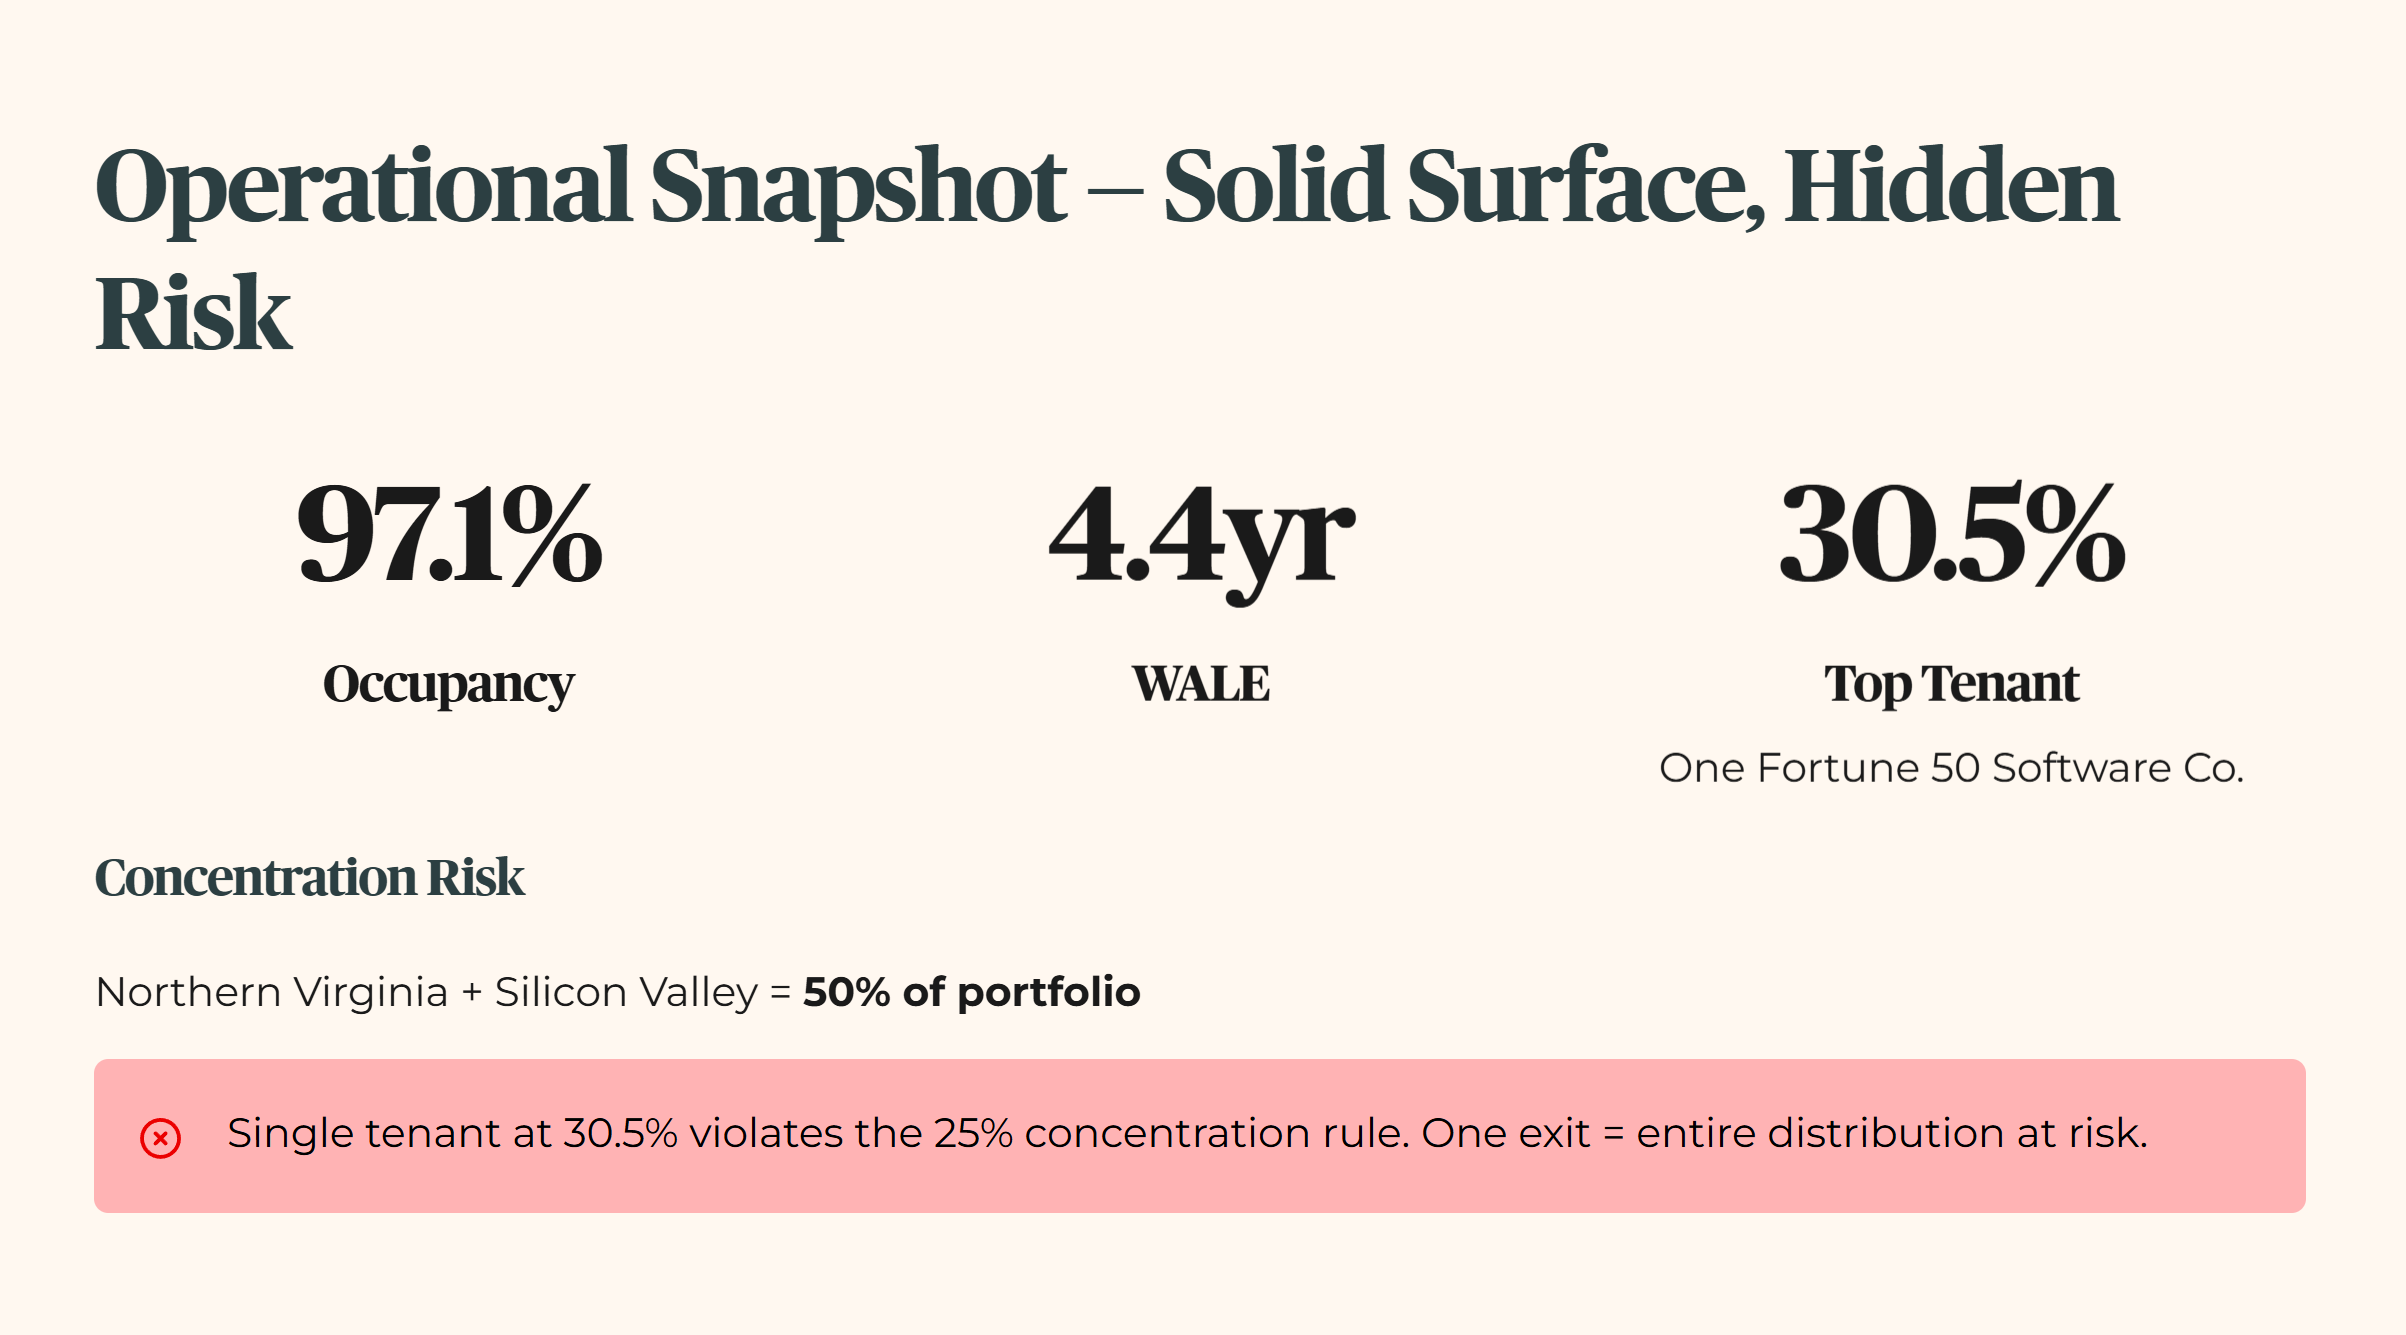
On the operational side, occupancy remains high at 97.1%. The Weighted Average Lease Expiry stands at 4.4 years — the average time until leases expire. These numbers look solid on a slide. However, the portfolio is heavily concentrated. Northern Virginia and Silicon Valley together represent 50% of the portfolio. One single Fortune 50 Software Company accounts for 30.5% of total annualised rent. This violates my 25% concentration rule for a sanctuary asset. If that one tenant moves, the entire distribution for Iggy’s Elite Investors is at risk.
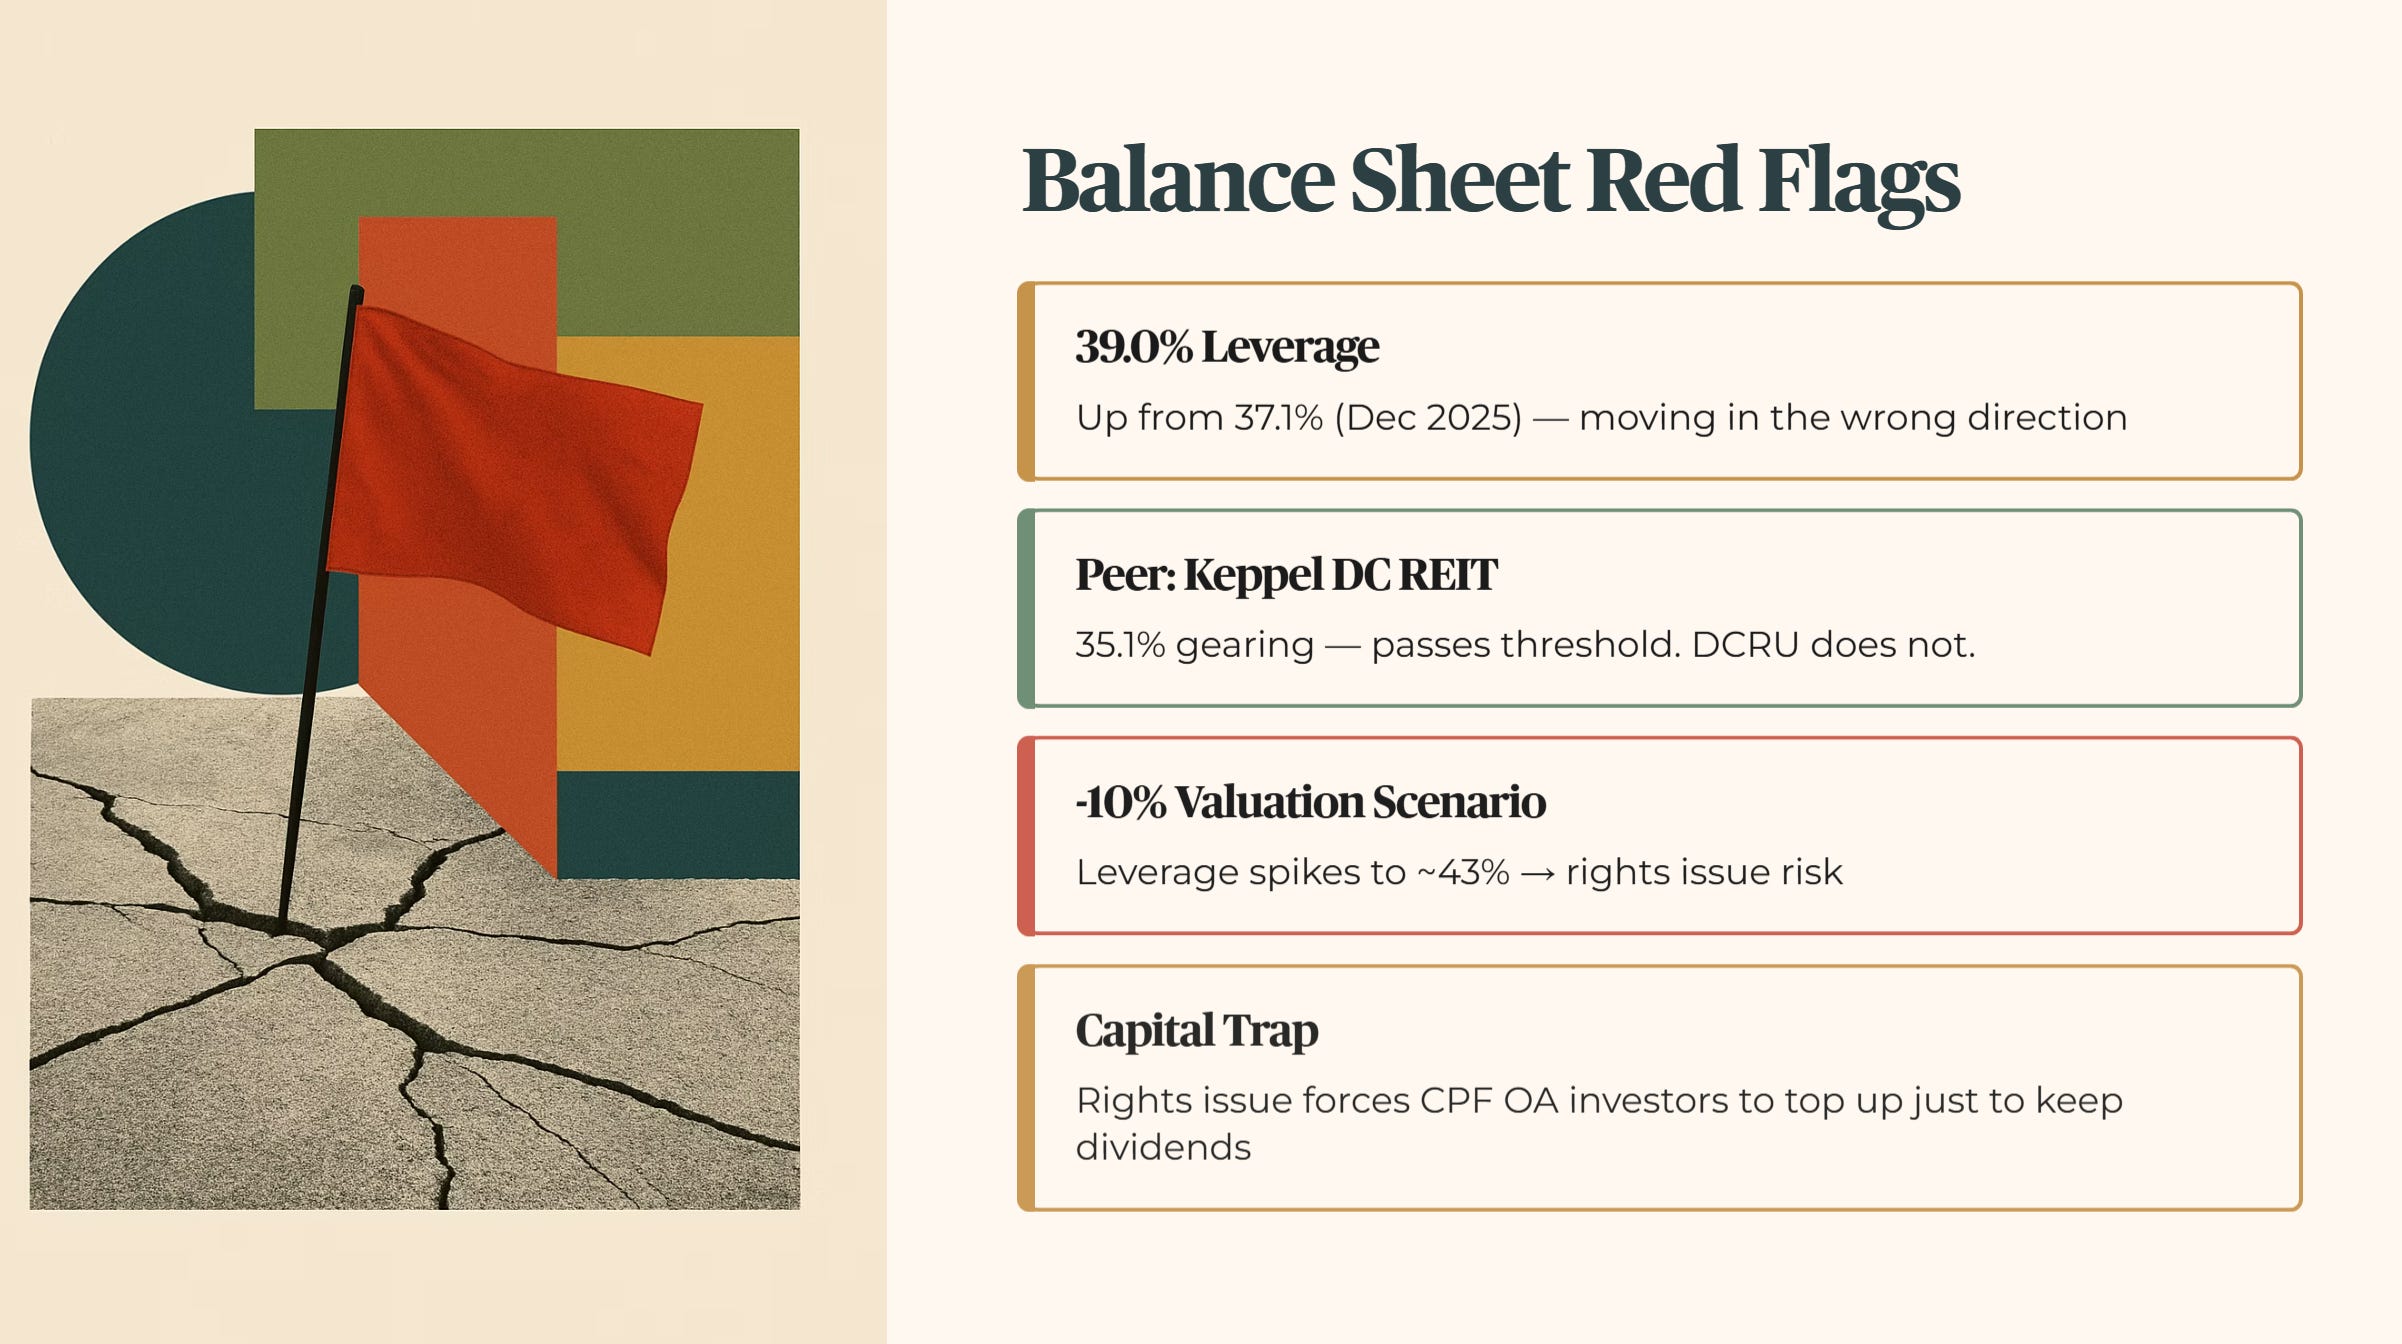
The Balance Sheet is where the forensic red flags are waving. Aggregate Leverage — total debt divided by gross asset value, measured under MAS Property Fund Guidelines — has climbed to 39.0% as stated in the management presentation for the period ending 31 March 2026.
Raw Fact: 39.0% Aggregate Leverage as of 31 March 2026, per management’s 1Q26 filing.
Historical Benchmark: This is a climb from 37.1% as of 31 December 2025. It is moving in the wrong direction.
Peer Context: Keppel DC REIT maintains a gearing of 35.1%. Keppel DC REIT passes my threshold. Digital Core REIT does not.
Forward Scenario: A 10% drop in property valuations would push this leverage toward 43%. This would likely trigger macro credit tightening and force a rights issue.
Wallet Impact: For a 55-year-old heartland investor managing a CPF OA portfolio, a rights issue means being forced to cough up more cash just to keep your original dividend level. It is a capital trap.
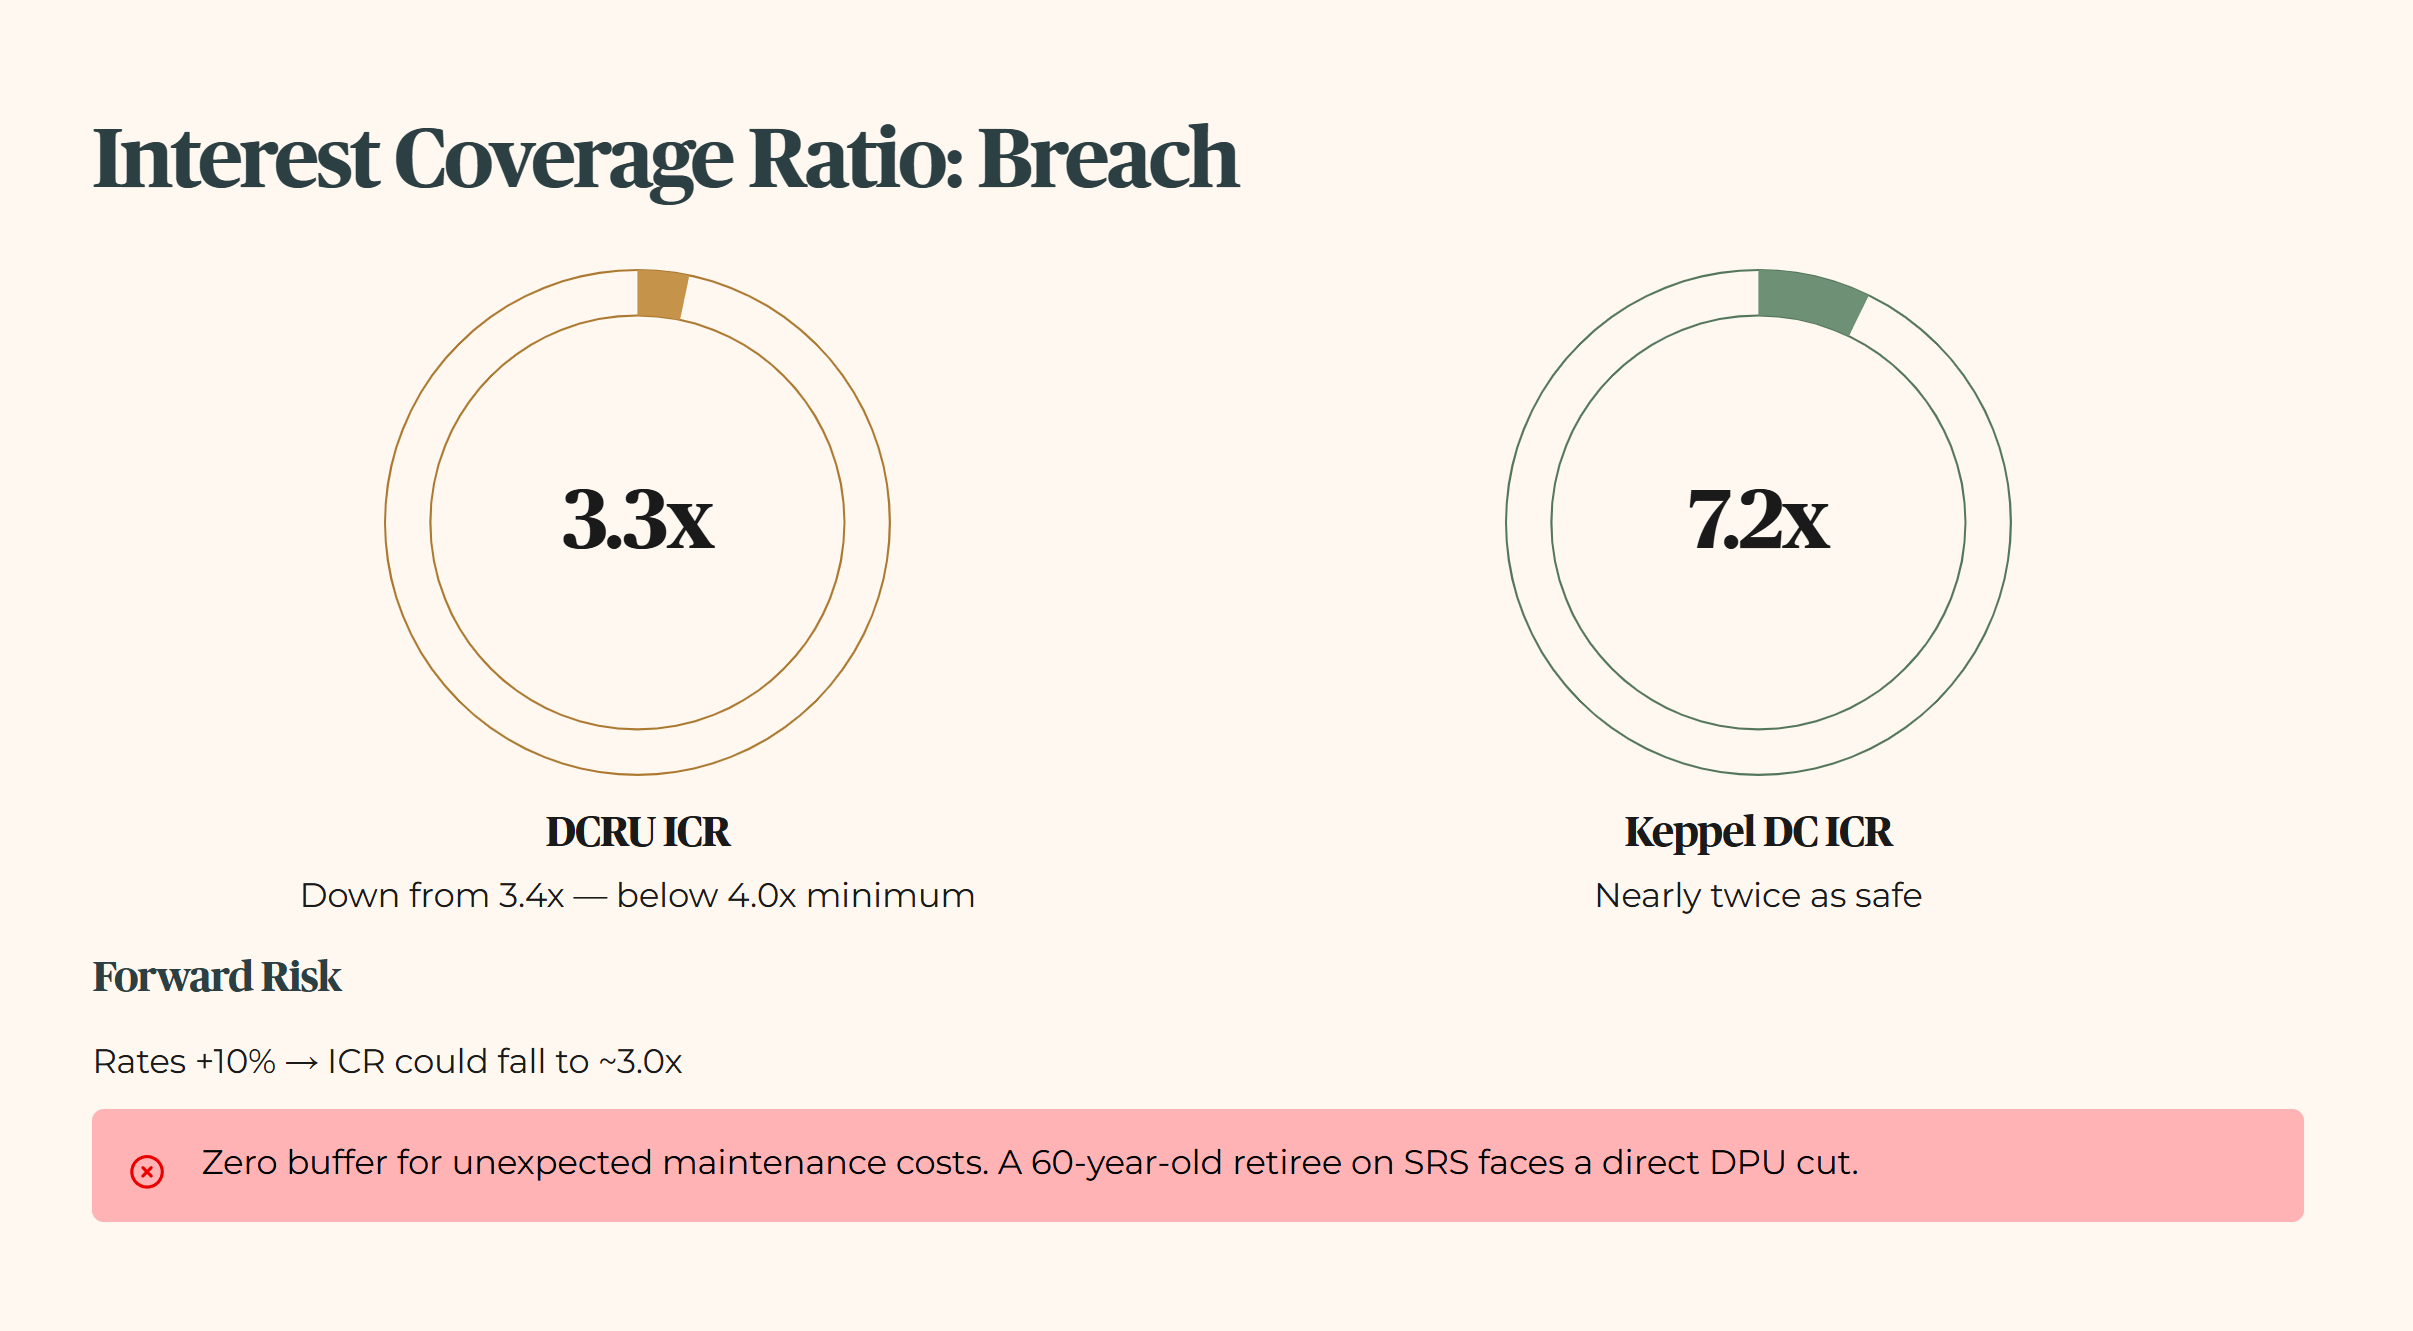
The Interest Coverage Ratio is the next breach. Based on figures in the management presentation, ICR is reported at 3.3x for 1Q26, declining from 3.4x in the prior period. ICR measures how many times a company can pay its interest with its earnings. My Master Source requirement is an ICR of at least 4.0x.
Raw Fact: 3.3x as reported in the 1Q26 management presentation, down from 3.4x in the prior period.
Historical Benchmark: The trend is deteriorating, not recovering.
Peer Context: Keppel DC REIT has an ICR of 7.2x. That is nearly twice as safe.
Forward Scenario: If interest rates rise another 10%, the ICR could dip toward 3.0x, leaving zero room for unexpected maintenance costs.
Wallet Impact: A 60-year-old retiree relying on SRS income faces a direct DPU cut if the ICR continues to slide. There is no fortress here.
🦎 Iggy’s Insight Block 1
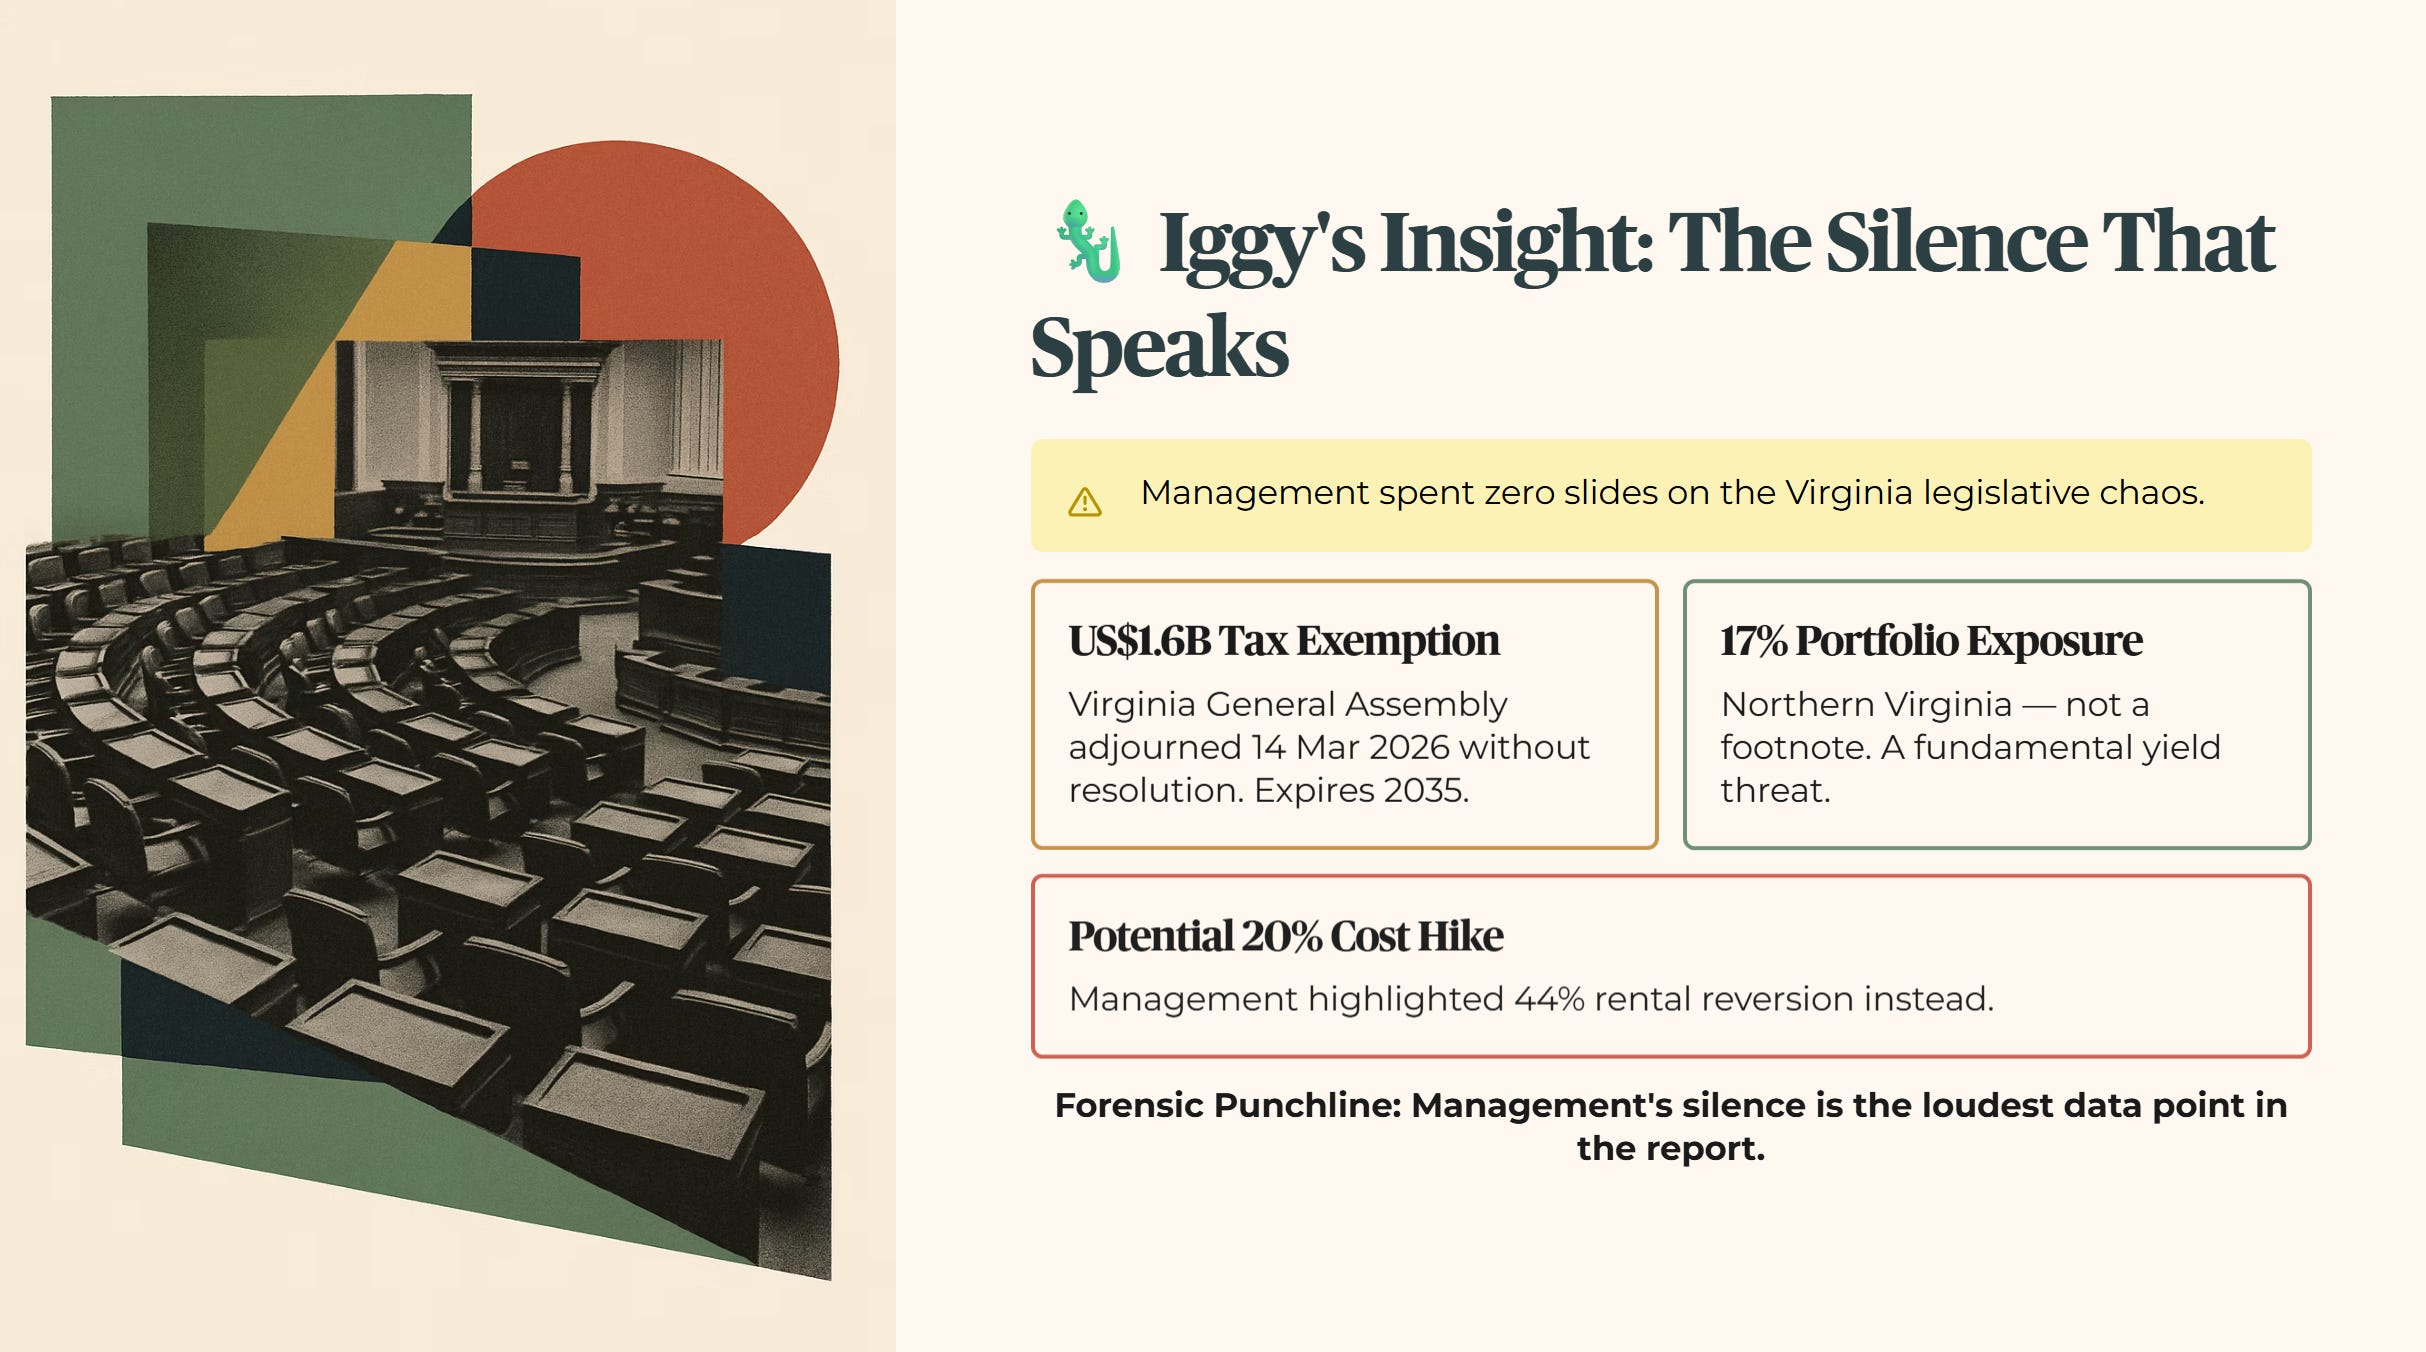
Management spent exactly zero slides discussing the legislative chaos in Northern Virginia. The Virginia General Assembly adjourned on 14 March 2026 without resolving the fate of the US$1.6 billion data centre tax exemption. This exemption expires in 2035. For a REIT with 17% of its portfolio in Northern Virginia, this is not a footnote. It is a fundamental threat to the long-term yield. Silence on this issue in the main presentation suggests management prefers to focus on the 44% rental reversion rather than the potential 20% cost hike from taxes.
Forensic Punchline: Management’s silence is the loudest data point in the report.
The Reality Check: Net Asset Value vs. Market Price
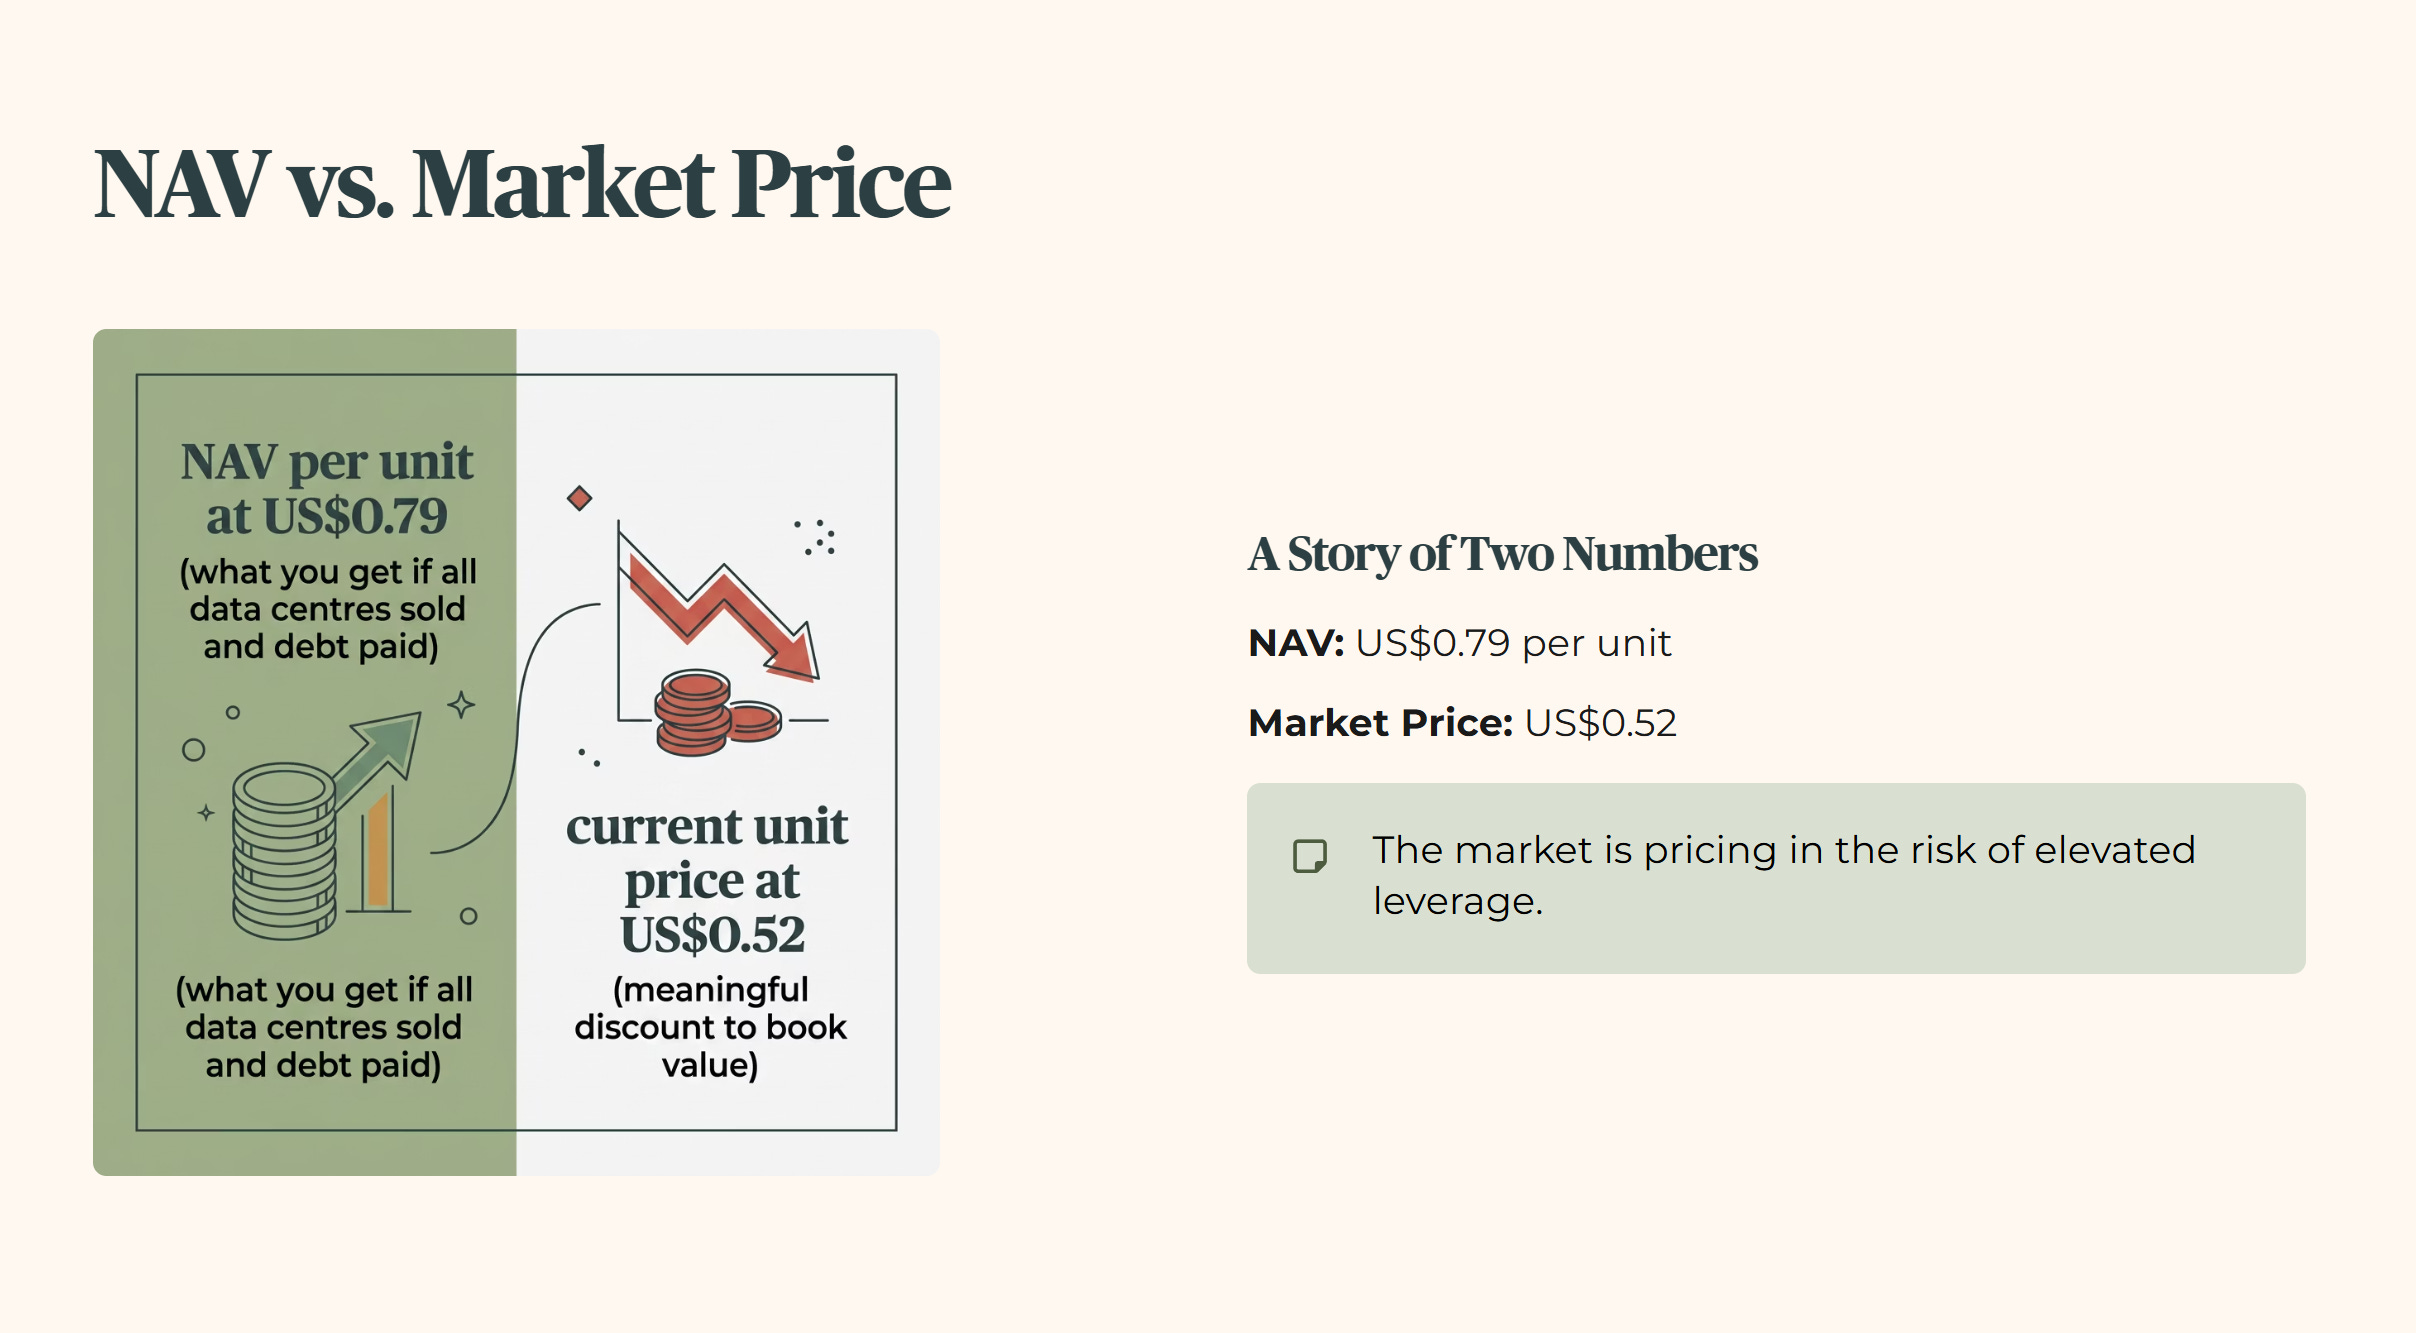
Digital Core REIT is a story of two numbers. The Net Asset Value per unit is US$0.79. NAV is what you would get if you sold all the data centres and paid off the debt today. The current unit price is US$0.52, representing a meaningful discount to book value.

InvestingPro’s average fair value estimate sits at US$0.58, implying approximately 11% upside from current levels, with medium uncertainty assigned.
The market’s 34% discount exists for a reason — and the yield spread calculation below reveals whether that discount compensates for the debt wall or simply marks the exit liquidity.
