



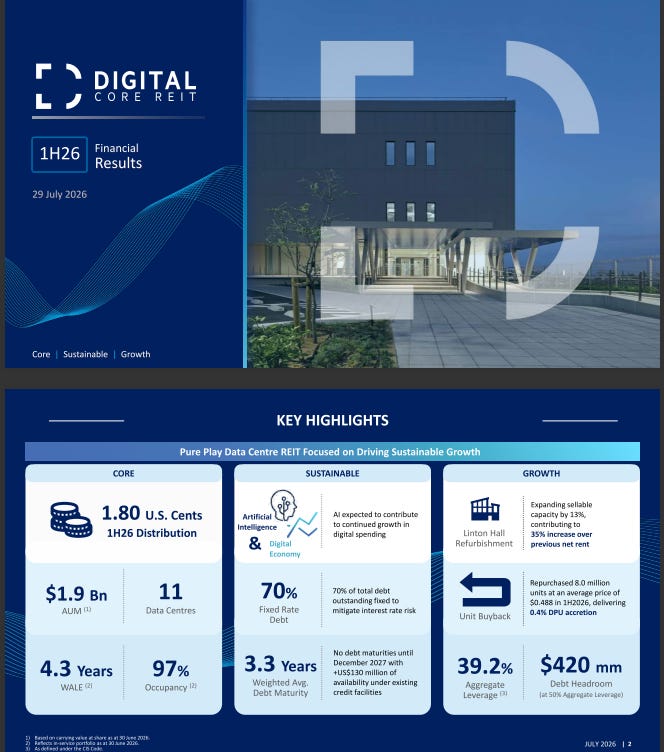
Management’s slide deck calls this a “Core, Sustainable, Growth” story, and on the yield line, they’re right. But a distribution can clear every income test you own and still sit on a balance sheet that’s failing you twice over. That’s exactly what’s happening here. Let the numbers speak.

I’ve been running money through CPF SA long enough to know the difference between a stock that earns its yield and one that’s borrowing against its own balance sheet to pay it. My own rule hasn’t moved in years, if a REIT wants my retirement capital, it needs to clear the yield bar and hold the balance sheet steady, not one or the other. Digital Core REIT’s 1H26 results are a clean test case for exactly that split, a genuinely strong income number sitting on top of two gate failures at the same time.

This is the kind of report where the headline and the audit tell two different stories, so let’s go through both.


The Slide-by-Slide Audit
Iggy’s Insight Block 1
The Reality Check
The Scorecard and Yield Spread
The Forward Outlook
Iggy’s Insight Block 2
The Verdict
Iggy’s Forensic Zone: Zone 4, Caution
1. The Slide-by-Slide Audit
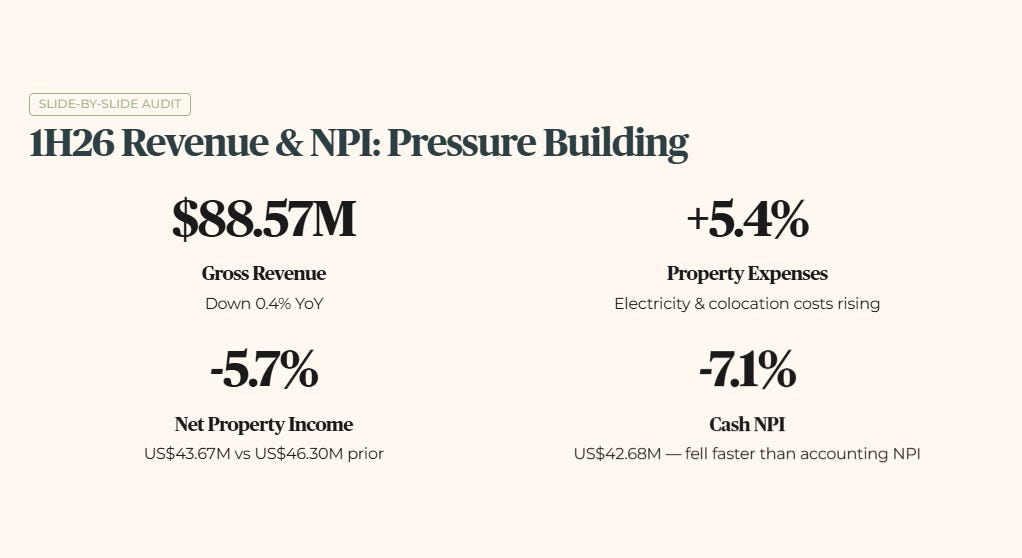
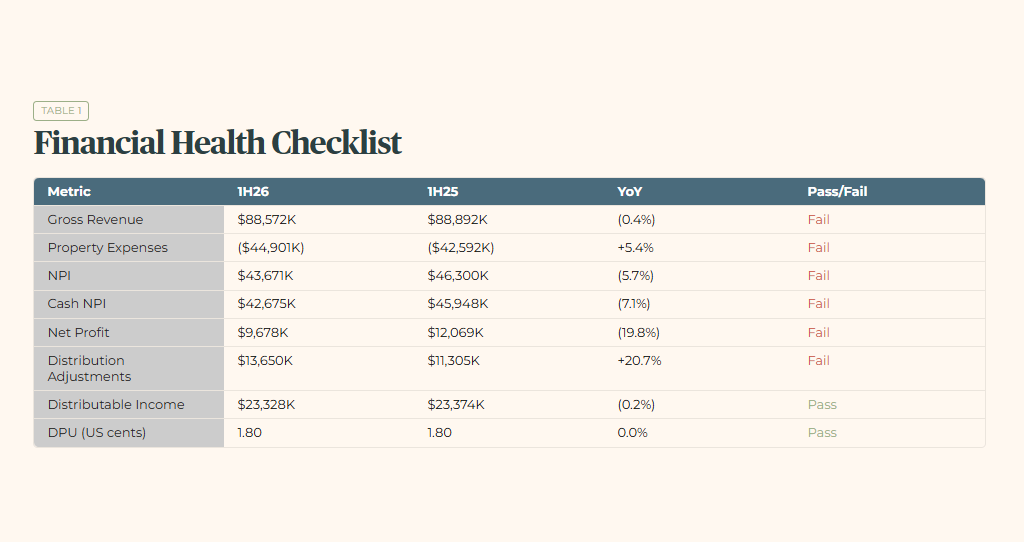
Digital Core REIT reported 1H26 Gross Revenue of US$88.57 million, down 0.4% from US$88.89 million in 1H25. Property expenses rose 5.4%, from US$42.59 million to US$44.90 million, driven by electricity overheads and colocation operating costs. That expense pressure pulled Net Property Income down 5.7% year on year to US$43.67 million, and organic cash generation fell even faster than the accounting NPI figure. Cash NPI dropped 7.1%, from US$45.95 million to US$42.68 million, reflecting straight-line rent adjustments and leasing friction in the non-core colocation units.
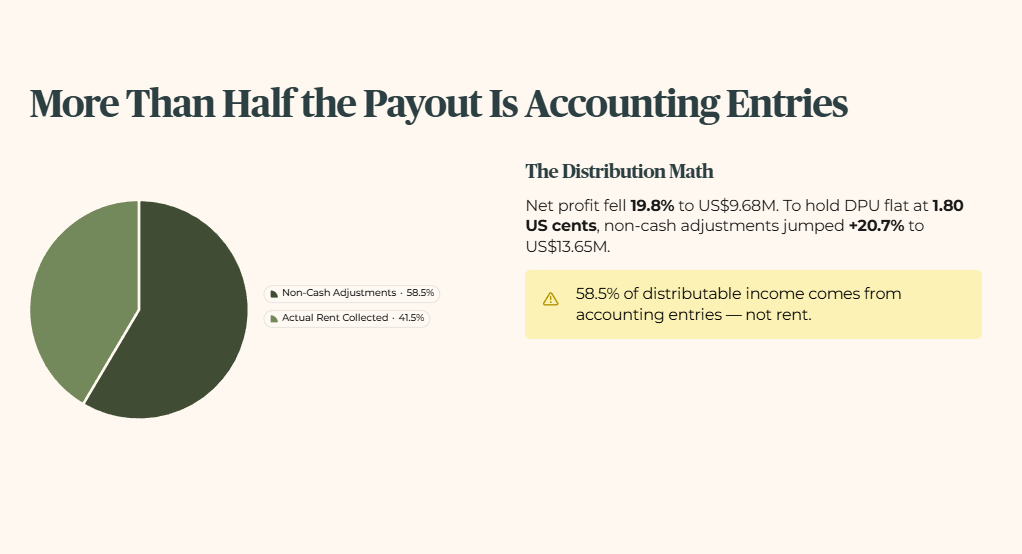
Net profit attributable to unitholders fell 19.8%, from US$12.07 million to US$9.68 million. To hold the unitholder payout flat at 1.80 US cents per unit, management increased non-cash distribution adjustments by 20.7% year on year, from US$11.31 million to US$13.65 million. Those adjustments now fund 58.5% of the total US$23.33 million distributable income, meaning more than half of what unitholders receive this half is coming from accounting entries, not rent collected from tenants.
Table 1: Financial Health Checklist
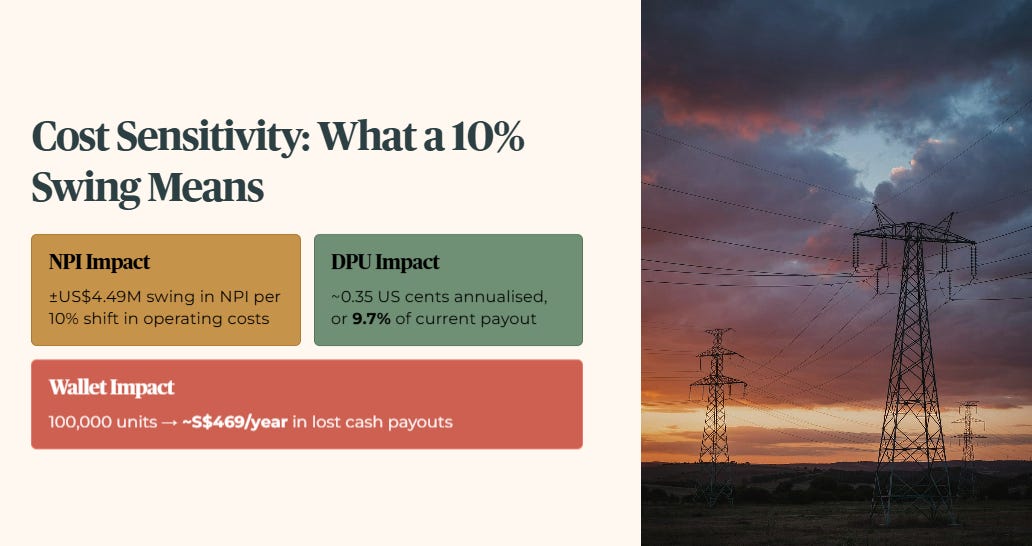
A plus or minus 10% shift in property operating costs equates to a US$4.49 million swing in NPI, moving annualised DPU by roughly 0.35 US cents, or about 9.7% of the current payout. A macro trigger such as a 10% jump in North American grid power costs would compress NPI directly, since colocation lease structures cannot fully pass through short-term utility spikes. For a Singaporean investor holding 100,000 units, a 9.7% distribution haircut works out to roughly S$469 a year in lost cash payouts, at an exchange rate near 1.34 SGD per USD.
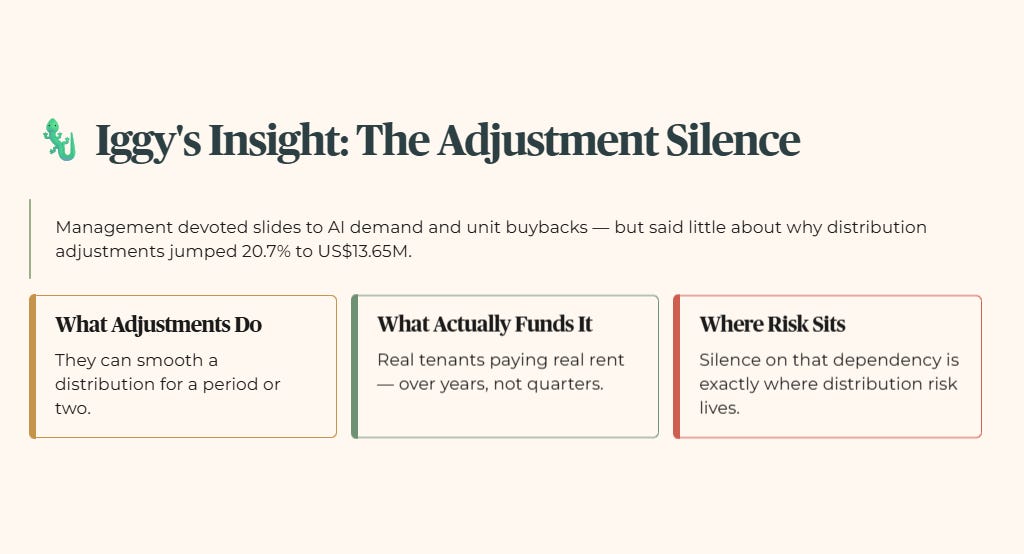
🦎 Iggy’s Insight Block 1 Management devoted several slides to AI demand trends and the unit buyback, but said little about why distribution adjustments jumped 20.7% to US$13.65 million. When non-cash accounting entries fund more than half of what you’re paid, the payout is being insulated from operational drag, not generated by it. Entries like these can smooth a distribution for a period or two. Real tenants paying real rent are what actually funds it over years, not quarters. Silence on that dependency is exactly where the distribution risk sits.
There’s a second layer worth naming here, since it sits underneath the cash flow story rather than beside it. The top two customers, both hyperscale cloud providers, account for 45.7% of annualised rent between them, and the largest single customer alone represents 30.3%. That’s a concentrated tenant base, and it’s not unusual for this type of asset, hyperscale data centre leases are built exactly this way, long-dated and investment-grade. But it means the cash flow quality underneath this distribution rests on a small handful of counterparties staying in place and renewing on similar terms, not on a broad, diversified rent roll the way a typical office or retail REIT would carry.
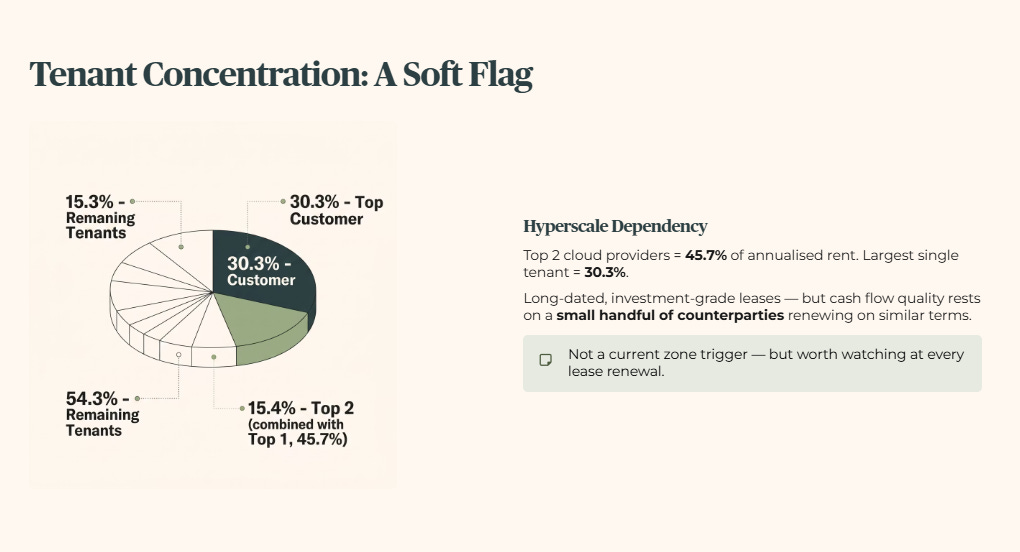
Worth keeping in view as a soft flag candidate the next time a lease renewal or credit event touches one of the top names, even though it isn’t yet weighted into this half’s zone call.
2. The Reality Check
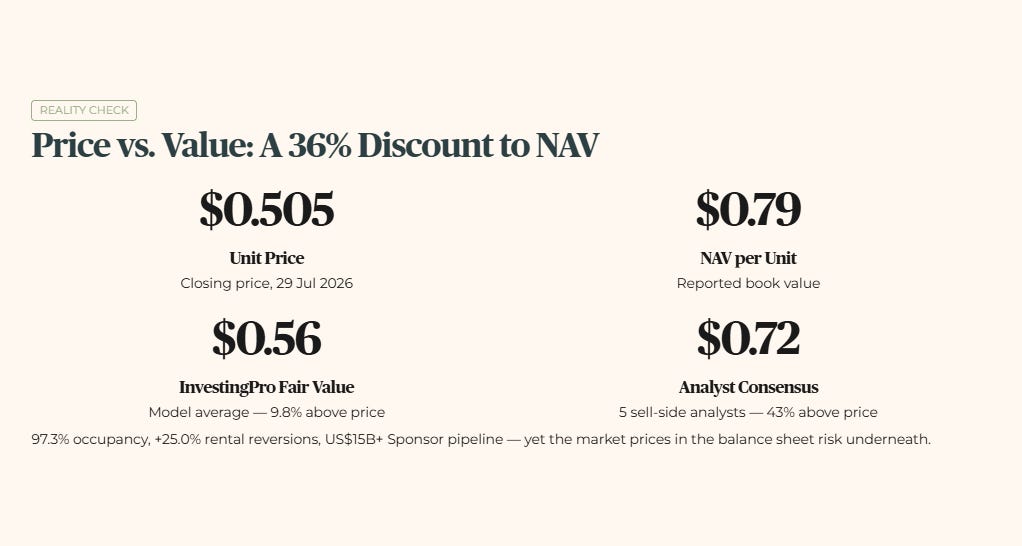
Management frames the half around 97.3% portfolio occupancy, positive rental reversions of 25.0%, and a Sponsor pipeline exceeding US$15 billion. Set against that story, the unit price tells a more cautious one.
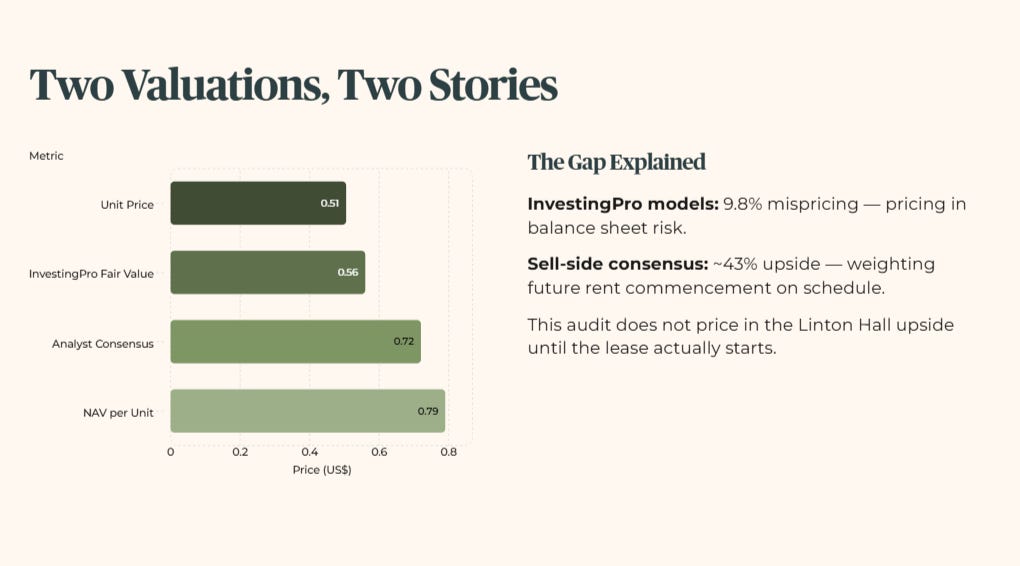
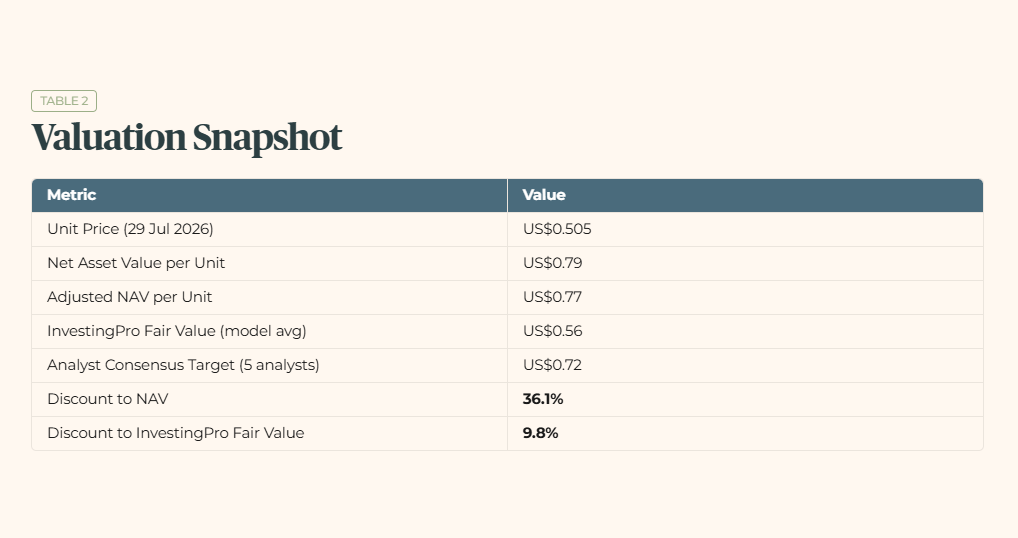
Digital Core REIT closed the period at US$0.505 per unit, against a reported Net Asset Value of US$0.79 per unit, and an adjusted NAV of US$0.77 per unit once distributable income is excluded. That’s a 36.1% discount to NAV, and a 9.8% discount to InvestingPro’s model-based Fair Value average of US$0.56.
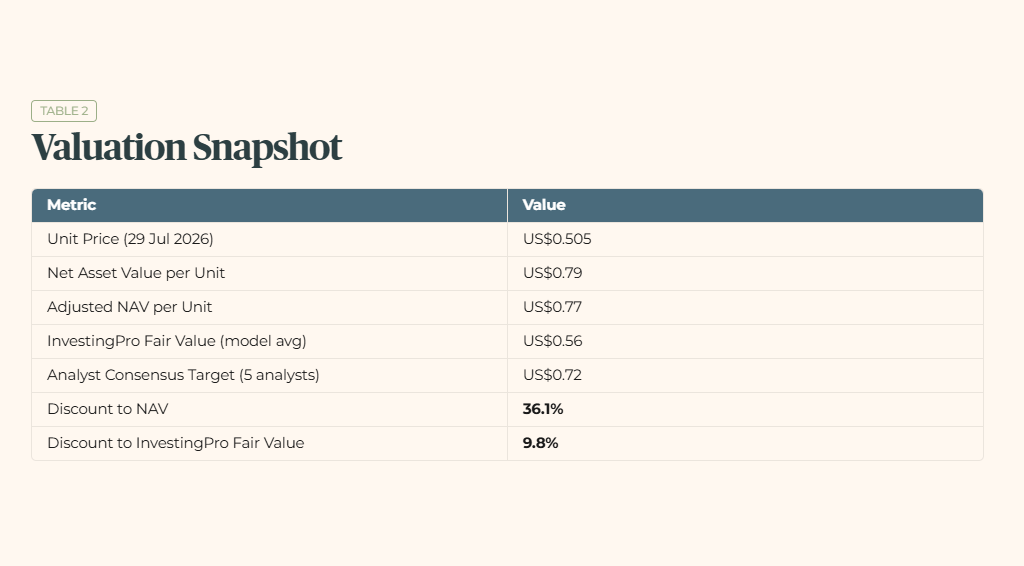
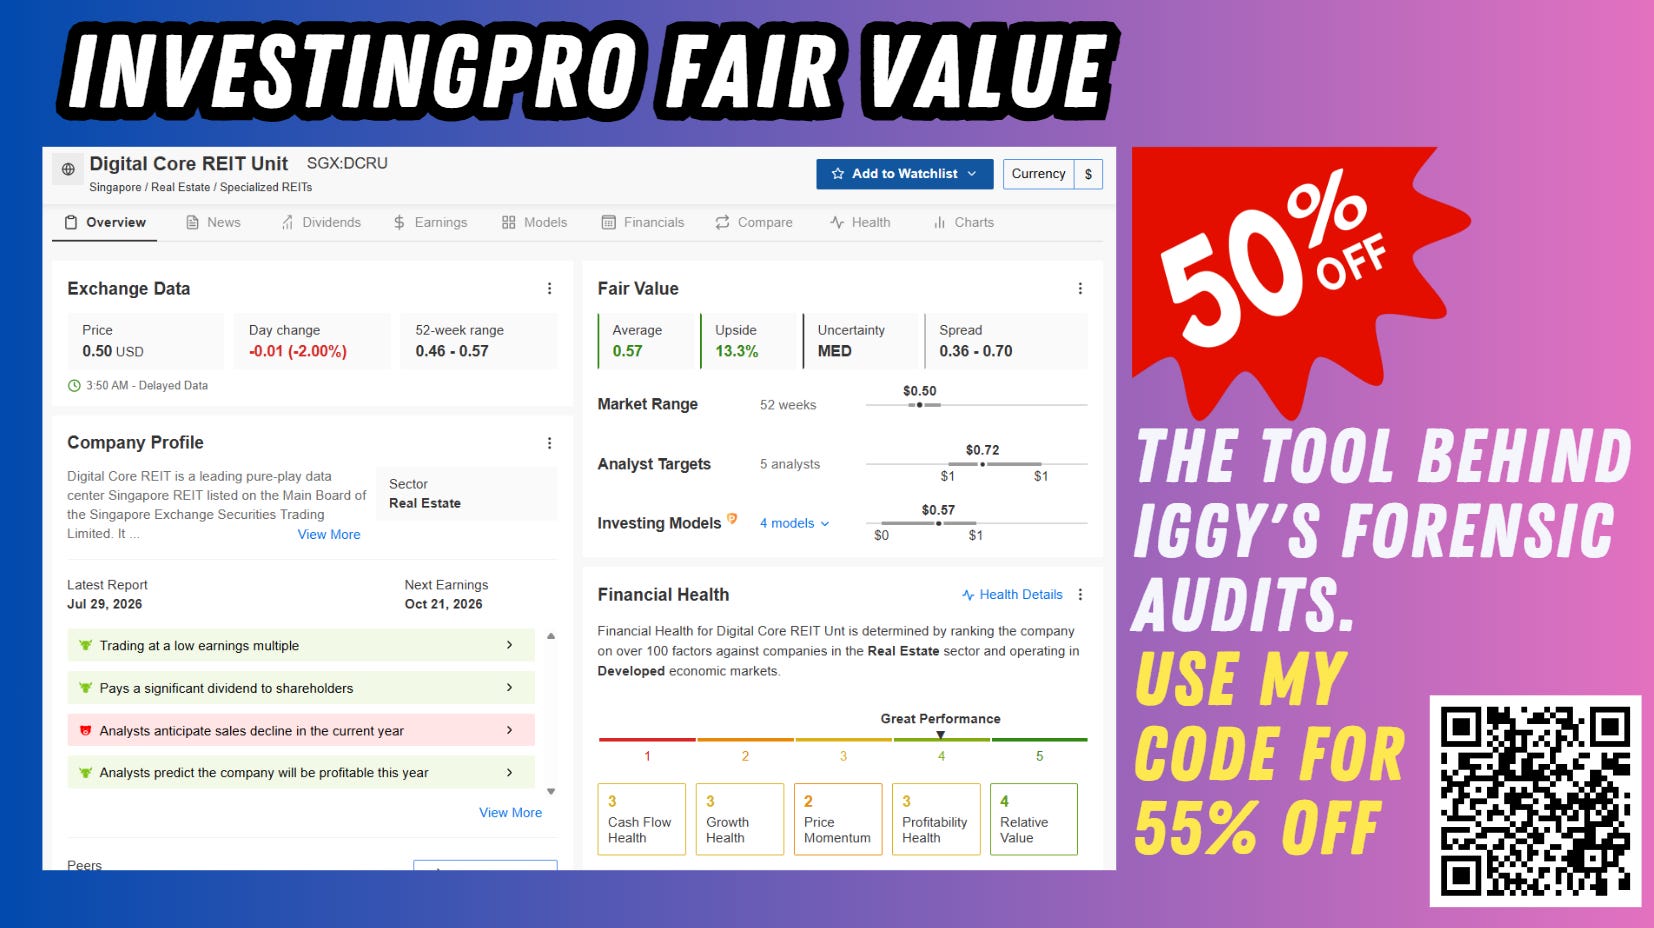
Worth separating two different numbers here, since they tell different stories, InvestingPro’s own valuation models put Fair Value at US$0.56, while the sell-side analyst consensus (five analysts covering the name) sits meaningfully higher at US$0.72.
The gap between those two figures is itself worth sitting with, InvestingPro’s models see a modest 9.8% mispricing, sell-side analysts see something closer to a 43% one. Peer comparison against other SGX-listed data centre names is omitted from this piece, the sourced data for a like-for-like comparison wasn’t available at the level of confidence this audit requires. A single-stock valuation read, as below, is the substitute per standing practice when peer data isn’t supplied.
Table 2: Valuation Snapshot
That gap between price and InvestingPro’s own Fair Value reflects the market pricing in the balance sheet risk sitting underneath the portfolio, an aggregate leverage of 39.2% and an interest coverage ratio of 3.2x. Management highlights a 35% net rent increase on the 8217 Linton Hall Road refurbishment, and that’s a genuine operational win, but the pro forma annual rent of US$18.08 million doesn’t commence until December 2026.
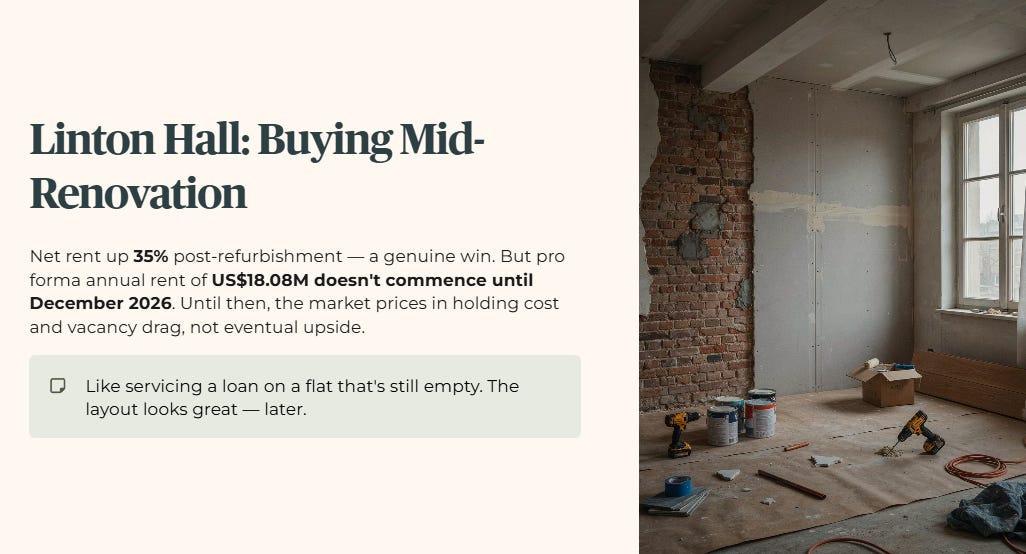
Until then, the market is pricing in the holding cost and the vacancy drag on that asset, not the eventual upside. The wider sell-side target likely reflects more weight on that future rent commencing on schedule, a reasonable view, but one this audit isn’t pricing in until the lease actually starts.
Think of it the way you’d think about buying a resale flat mid-renovation. The eventual layout and rent look better, but you’re servicing the loan every month while that particular unit sits empty.
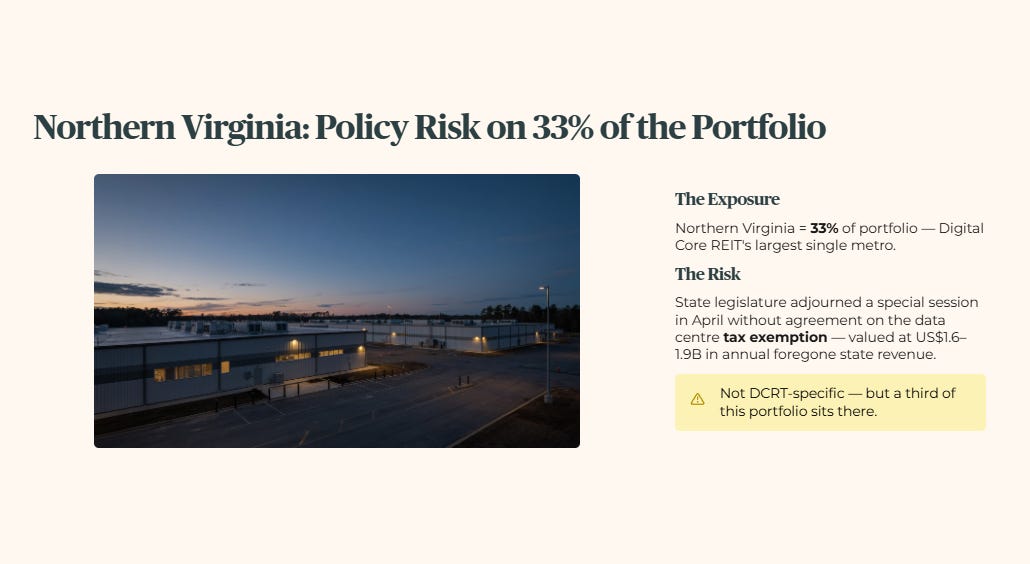
There’s a market-level risk sitting underneath the Linton Hall story too, and it’s specific to where that asset sits. Northern Virginia is Digital Core REIT’s largest single metro exposure at 33% of the portfolio, and it’s currently the centre of an unresolved fight over the state’s data centre tax exemption, an exemption that the presentation’s own market data section values at US$1.6 to 1.9 billion in annual foregone state revenue.
The state legislature adjourned a special session in April without agreement, and the outcome remains open. This isn’t a Digital Core REIT-specific problem, it’s a market-wide policy risk that touches every operator with meaningful Northern Virginia exposure, but given a third of this portfolio sits there, it’s a genuine forward risk, not just industry noise, and worth watching alongside the more immediate balance sheet gates.
3. The Scorecard and Yield Spread
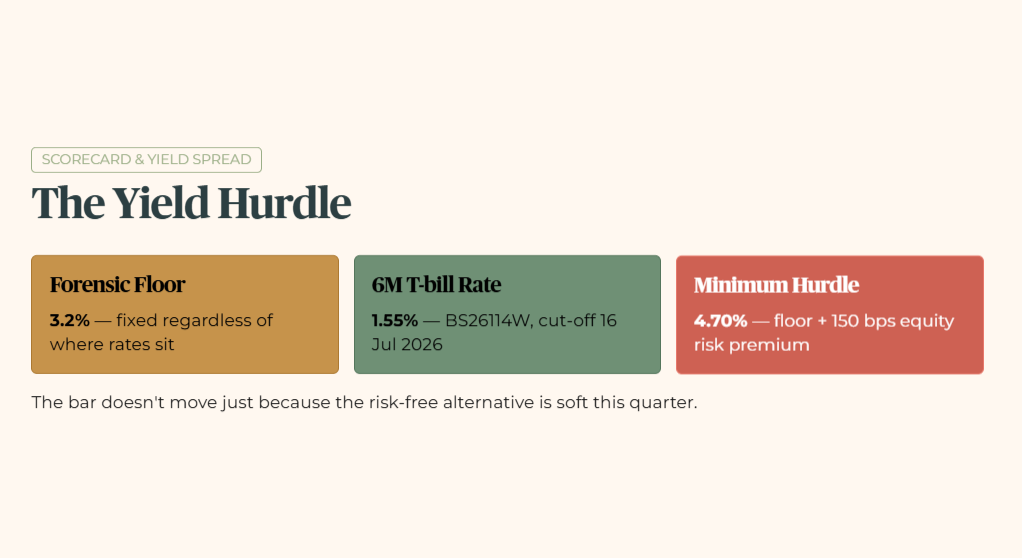
My stress-test floor stays at 3.2% regardless of where short-term rates sit. The 6-month Singapore T-bill (BS26114W, cut-off 16 July 2026) cleared at 1.55%, and I don’t lower my own bar just because the risk-free alternative is soft this quarter. The minimum yield hurdle stays at 4.7%, the 3.2% floor plus 150 basis points of equity risk premium.
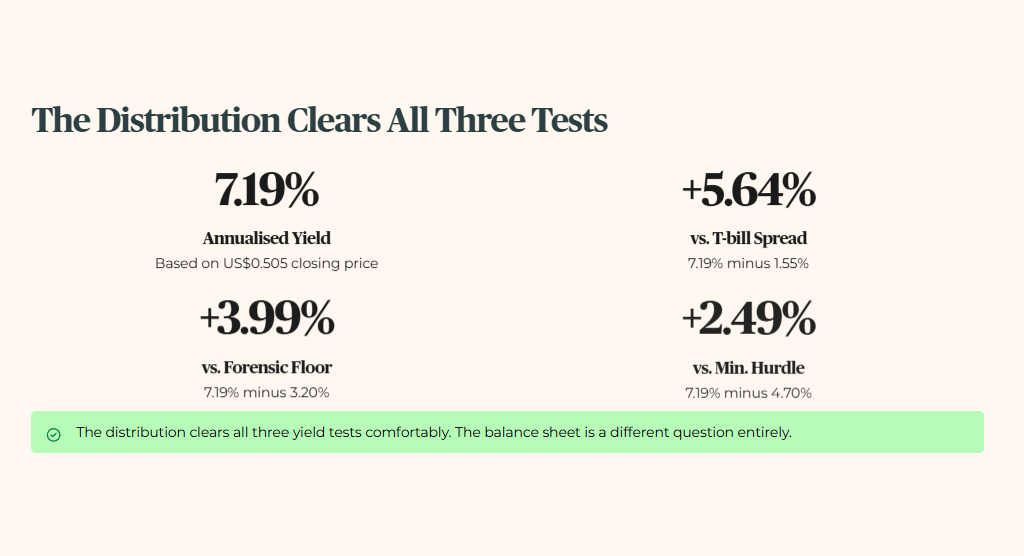
Digital Core REIT’s annualised distribution yield stands at 7.19%, based on the closing price of US$0.505.
6-Month T-bill Spread: 7.19% minus 1.55% equals +5.64% Iggy Forensic Floor Spread: 7.19% minus 3.20% equals +3.99% Minimum Yield Hurdle Spread: 7.19% minus 4.70% equals +2.49%
The distribution clears all three yield tests comfortably. That’s the part of this report that genuinely deserves the “strong half” framing. The balance sheet is a different question entirely.
The distribution clears all three yield tests comfortably, the 39.2% gearing breach and 3.2x interest coverage shortfall in the next section are what decide whether CPF and SRS capital actually belongs here.
