

DPU Down But Not Out: Why Mapletree Industrial Trust’s Q2 Numbers Tell a More Complex Story
Headlines screamed 5.6% DPU drop. They missed the real, 2.2% story.

Singapore investors watching their REIT payouts shrink might feel uneasy about Mapletree Industrial Trust’s latest results. The numbers look rough at first glance—DPU dropped 5.6% year-on-year to 3.18 cents. But here’s what most headlines miss: strip away the one-off gains from last year, and the decline is just 2.2%. That’s a very different story, especially when you factor in what MIT management has been doing behind the scenes to position this trust for the next growth phase.
I’m Iggy, your Singapore-based market analyst behind The Investing Iguana. I cut through the noise in SGX earnings reports to show you what really matters for your CPF and SRS portfolios. Today we’re going slide-by-slide through MIT’s 2Q and 1H FY25/26 financial results released on 29 October 2025. We’ll break down each metric, decode what’s driving the changes, and figure out whether this industrial REIT still deserves a spot in your income portfolio at current prices.
In This Article:

• Slide 1: Cover and Important Notice
• Slide 2: Key Highlights – The Numbers That Matter
• Slide 3: 2Q & 1H FY25/26 Financial Performance – Year-on-Year Comparison
• Slide 4: 2Q FY25/26 Quarter-on-Quarter Performance
• Slide 5: Statement of Financial Position
• Slide 6: Strong Balance Sheet and Capital Management
• Slide 7: Debt Maturity Profile and Currency Mix
• Slide 8: Interest Rate and Forex Risk Management
• Slide 9: Portfolio Update – Diverse Portfolio of 136 Properties
• Slide 10: Active Portfolio Rejuvenation – A Track Record of Growth
• Slide 11: Lease Expiry Profile – Income Visibility Extends to 2030 and Beyond
• Slide 12: Proactive Asset Management – Three-Pronged Strategy for North America
• Slide 13: Large and Diversified Tenant Base – No Concentration Risk
• Slide 14: Tenant Diversification Across Trade Sectors – Broad Economic Exposure
• Slide 15: Diversified Mix of Data Centres – Powered Shell, Fitted, and Hyperscale
• Slide 16: Rental Reversions in Singapore – Positive but Moderating
• Slide 17: Building a Climate-Resilient Portfolio – Sustainability Achievements
• Slide 18: Investment Update – Portfolio Rejuvenation Through Strategic Divestments
• Slide 19: Outlook – Navigating Global Uncertainties and Sector-Specific Trends
• Iggy’s Assessment: Hold for Income, Watch for North America Stabilization
Slide 1: Cover and Important Notice
Mapletree Industrial Trust released its Second Quarter and First Half Financial Year 2025/2026 results on 29 October 2025. The presentation should be read alongside the full SGXNET announcement for complete context.
The standard disclaimer reminds us that past performance doesn’t predict future returns. Units can fluctuate in value. MIT is structured as a REIT listed on SGX, focused on industrial properties in Singapore and data centres globally. The forward-looking statements carry inherent risks tied to economic conditions, interest rates, occupancy trends, and construction timelines.
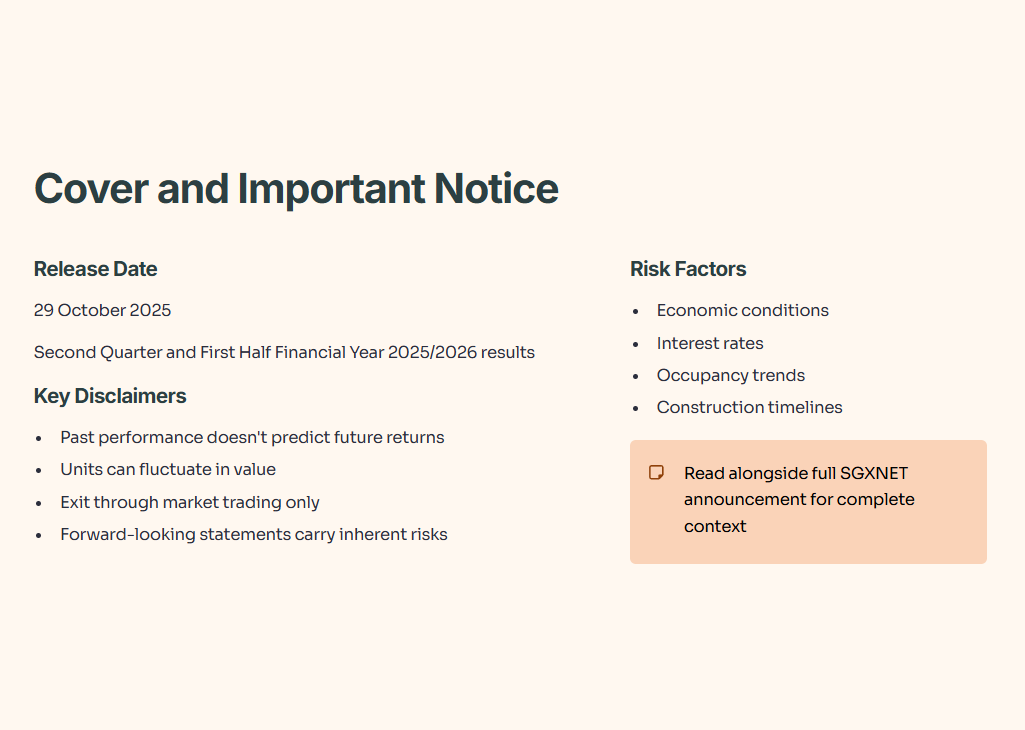
For Singapore investors, this notice matters because it frames the regulatory and risk environment. REITs trade daily on SGX, but you can’t redeem units directly with the manager. Your exit is through market trading, which means liquidity depends on trading volume. MIT’s industrial and data centre focus also means exposure to tech sector demand cycles and global economic shifts.
Slide 2: Key Highlights – The Numbers That Matter
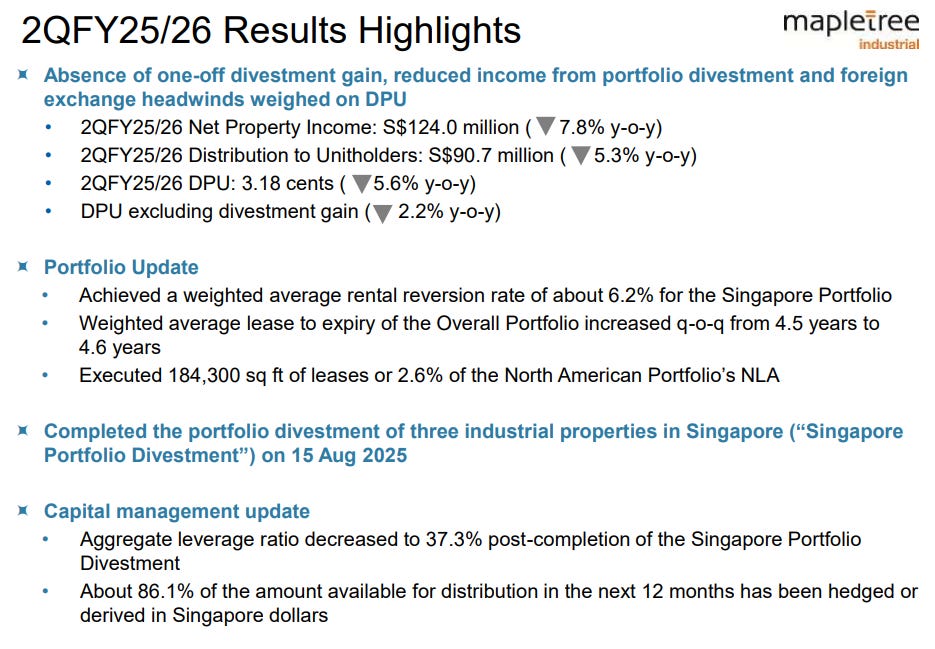
This slide lays out the headline performance for the quarter ended 30 September 2025. Let’s break down what moved and why.
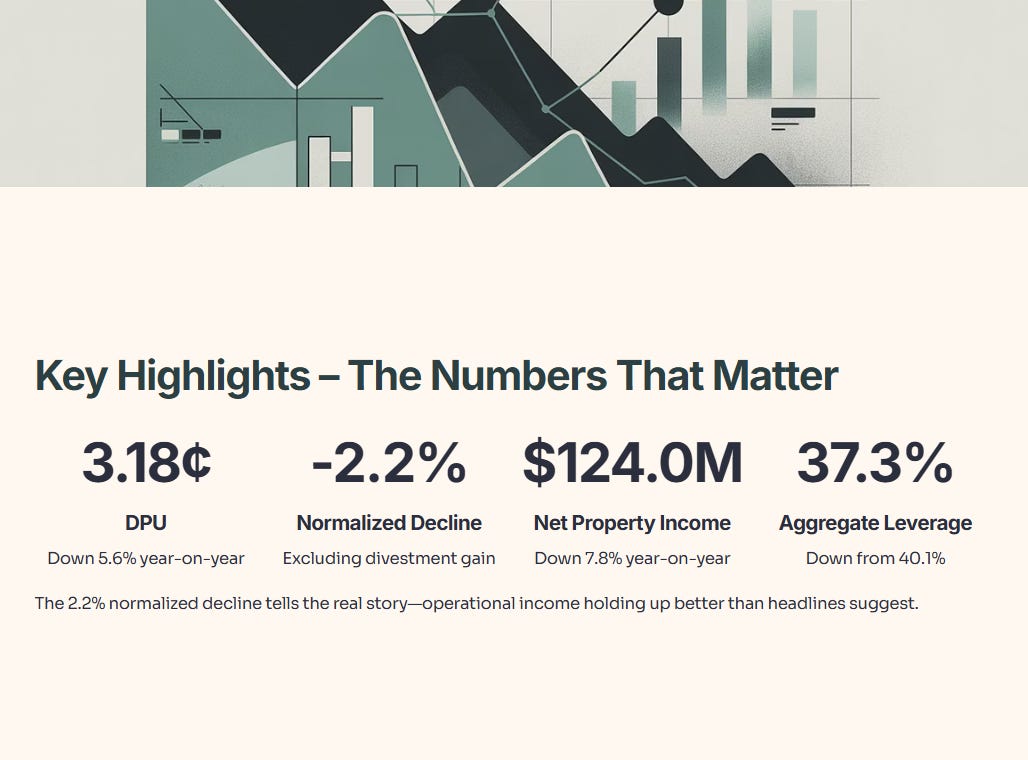
2Q FY25/26 Net Property Income: S$124.0 million (down 7.8% year-on-year)
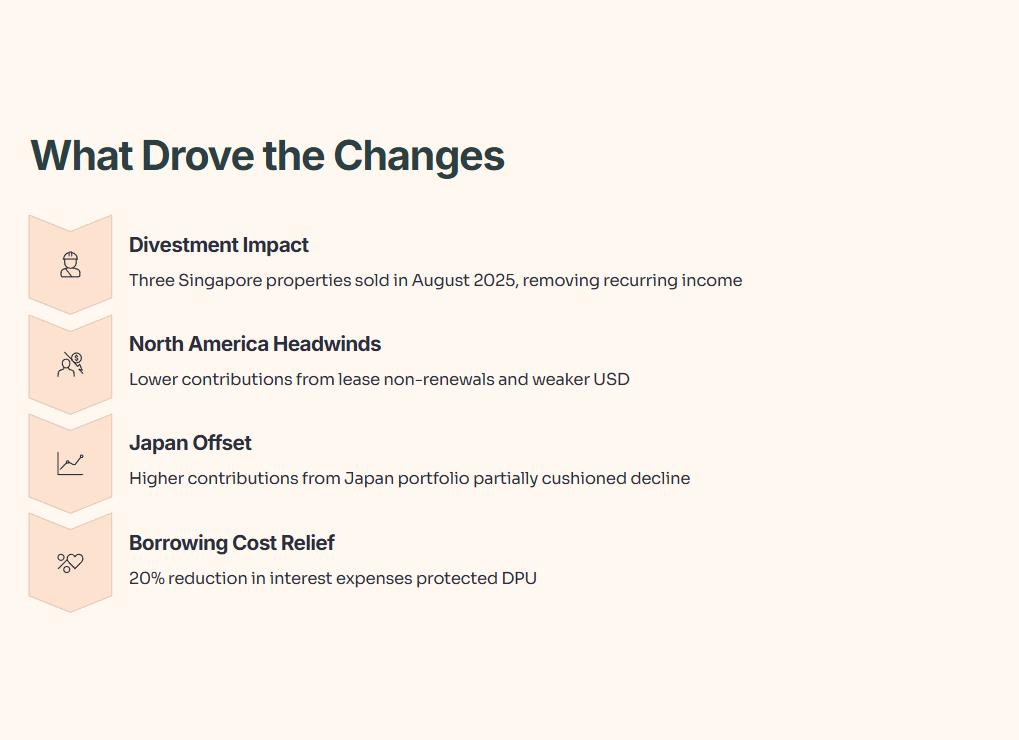
NPI is the core engine of any REIT. It’s what’s left after you subtract property operating expenses from gross rental income. MIT’s NPI fell by 7.8% compared to the same quarter last year. Three factors drove this drop: first, MIT completed the divestment of three Singapore industrial properties in August 2025, which removed recurring income from those assets. Second, the North American portfolio saw lower contributions due to lease non-renewals and a weaker USD against SGD. Third, these negatives were only partially offset by higher contributions from the Japan portfolio.
Why does this matter to you? NPI directly feeds into distributable income. When NPI drops, there’s less cash available to pay unitholders unless borrowing costs fall or other income sources step up.
2Q FY25/26 Distribution to Unitholders: S$90.7 million (down 5.3% year-on-year)
The actual cash distributed to unitholders dropped by 5.3%. This figure is slightly better than the NPI decline because borrowing costs came down significantly, cushioning the blow.
2Q FY25/26 DPU: 3.18 cents (down 5.6% year-on-year)
The distribution per unit is the number most income investors watch. At 3.18 cents, it’s down from 3.37 cents a year ago. But here’s the critical context: last year’s 3.37 cents included a one-off divestment gain from the Tanglin Halt Cluster. If you exclude that gain, last year’s DPU was 3.25 cents. That means the like-for-like decline is just 2.2%, not 5.6%.
Think of it this way: if you bought MIT expecting sustainable recurring income, the 2.2% decline is the relevant figure. The 5.6% headline number overstates the weakness because it includes a windfall gain that was never going to repeat.
DPU excluding divestment gain: down 2.2% year-on-year
This normalized view shows MIT’s operational income is holding up better than the headline suggests. The decline reflects the loss of income from divested properties and North American headwinds, but also the benefit of lower borrowing costs and Japan contributions.
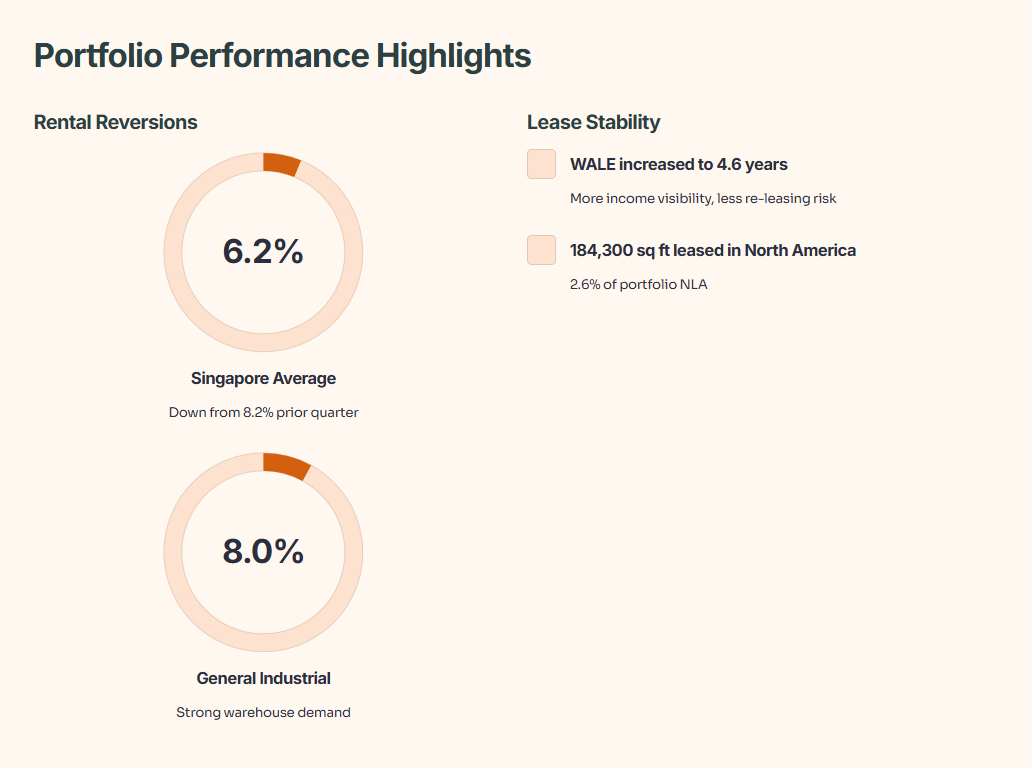
Portfolio Update: Rental Reversions and Lease Expiry
MIT achieved a weighted average rental reversion rate of about 6.2% for the Singapore portfolio. Rental reversion is the percentage change between old expiring rents and new renewal rents. A positive reversion means tenants are paying more when they renew. In Singapore’s tight industrial market, 6.2% is healthy but down from 8.2% in the prior quarter.
The weighted average lease to expiry (WALE) increased quarter-on-quarter from 4.5 years to 4.6 years. Longer WALE means more income visibility and less near-term re-leasing risk. For Singapore REITs, WALE above 4 years is considered solid.
MIT executed 184,300 square feet of leases in North America, representing 2.6% of the portfolio’s net lettable area. This sounds small, but it’s typical for long-lease data centre portfolios where most tenants stay put for years.
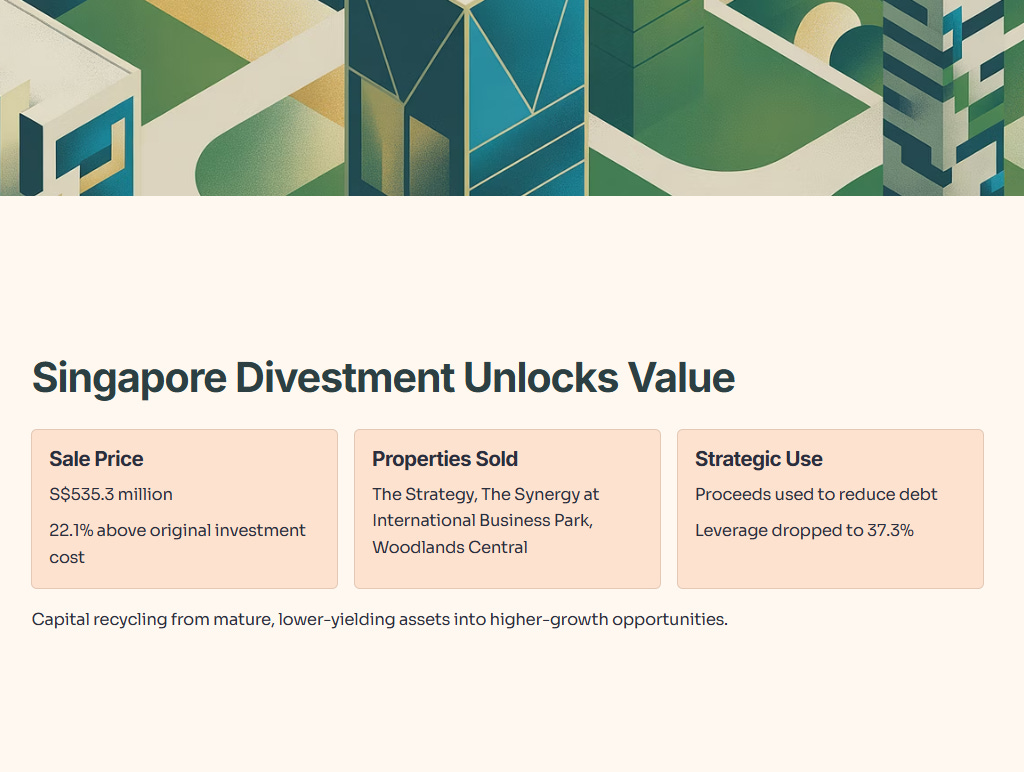
Singapore Portfolio Divestment Completed
MIT completed the sale of three industrial properties in Singapore on 15 August 2025. These were The Strategy, The Synergy at International Business Park, and a property at Woodlands Central. The combined sale price was S$535.3 million, which was used to reduce debt.
Why divest these assets? Management is recycling capital from mature, lower-yielding Singapore industrial assets into higher-growth opportunities. The divestment unlocked value—the sale price was 22.1% above original investment cost and 2.6% above the 31 March 2025 valuation.
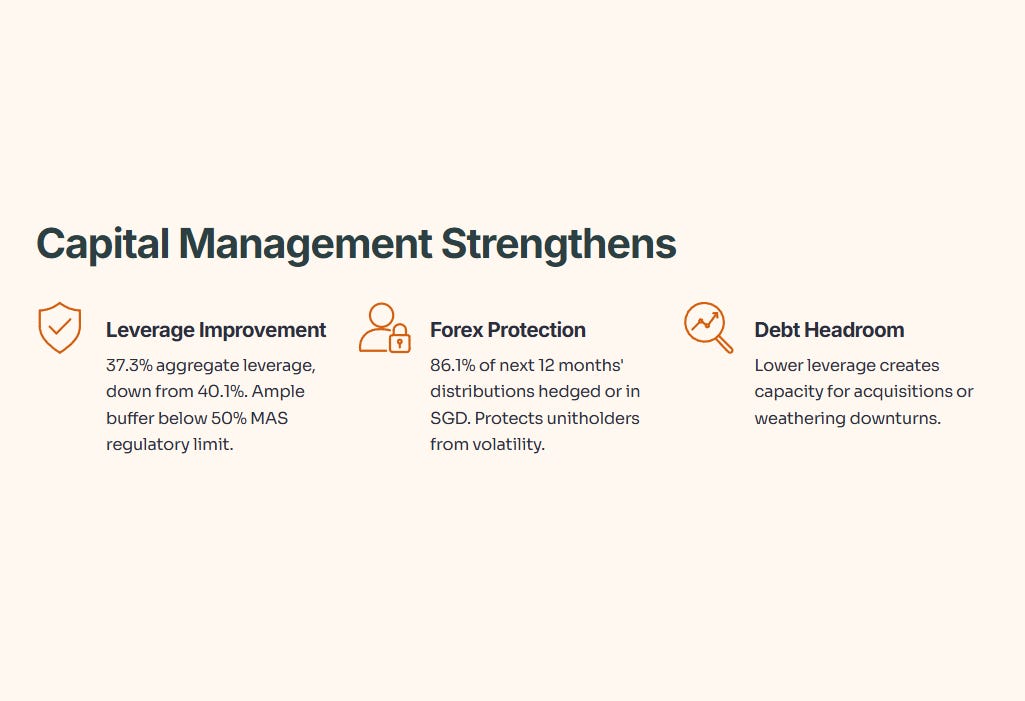
Capital Management Update
MIT’s aggregate leverage ratio decreased to 37.3% post-divestment, down from 40.1% in June 2025. Lower leverage gives MIT more debt headroom to pursue acquisitions or weather downturns. The MAS regulatory limit for REITs is 50%, so MIT has ample buffer.
About 86.1% of the amount available for distribution in the next 12 months has been hedged or derived in Singapore dollars. This protects MIT unitholders from forex volatility on distributions, which is critical given the trust’s 47.2% exposure to North American assets.
Slide 3: 2Q & 1H FY25/26 Financial Performance – Year-on-Year Comparison
This slide dives deep into the income statement drivers for both the quarter and the half-year. Let’s unpack the numbers line by line.
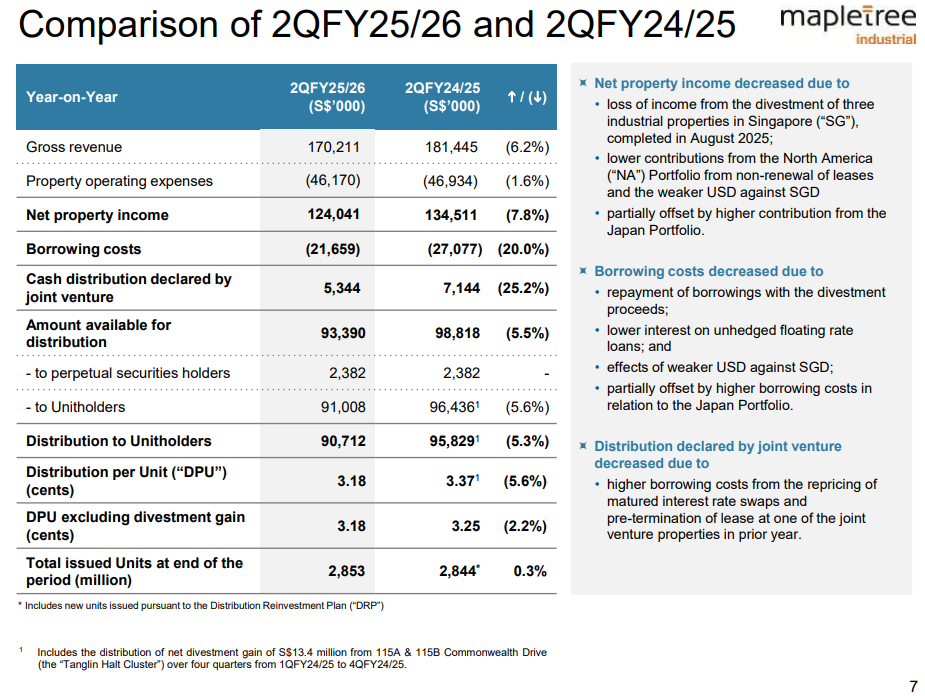
2Q FY25/26 Financial Performance
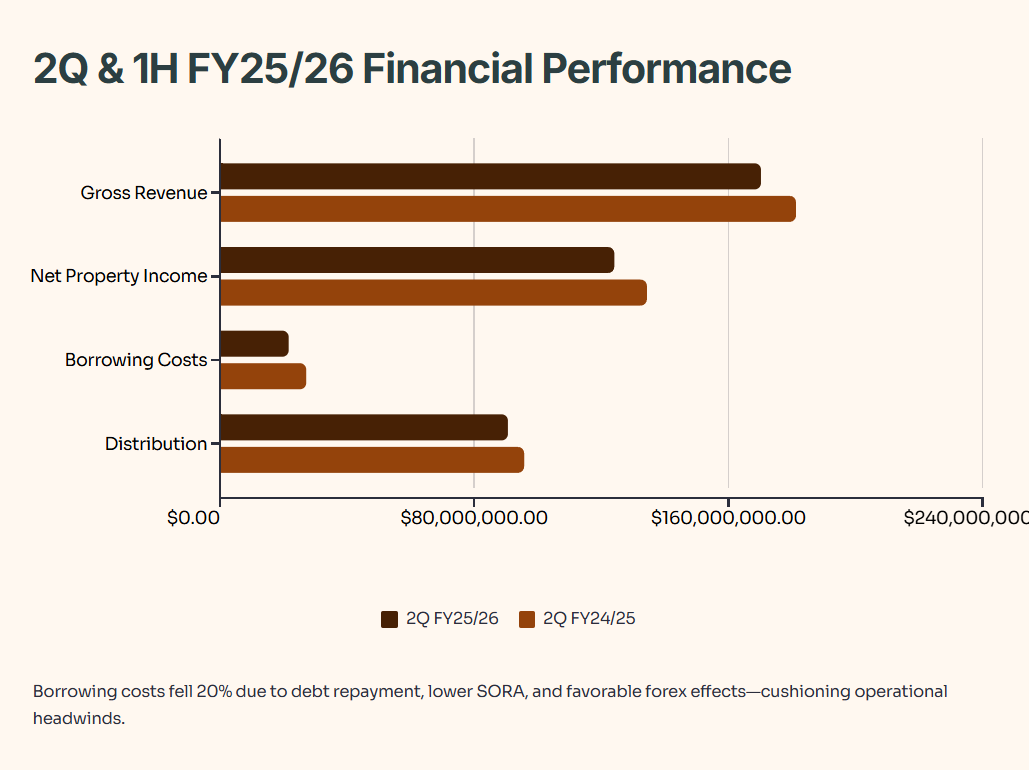
Gross Revenue: S$170.2 million (down 6.2% year-on-year)
Revenue dropped by 6.2% due to the loss of rental income from the three divested Singapore properties, lower contributions from North America (non-renewals and weak USD), partially offset by higher Japan contributions.
Property Operating Expenses: S$46.2 million (down 1.6% year-on-year)
Expenses declined slightly, but not enough to offset the revenue drop. This modest decline reflects the divested properties coming off the books.
Net Property Income: S$124.0 million (down 7.8% year-on-year)
As discussed earlier, NPI is the key profitability metric. The 7.8% decline is significant but not catastrophic. It’s driven by asset sales (strategic choice) and North America challenges (market headwind).
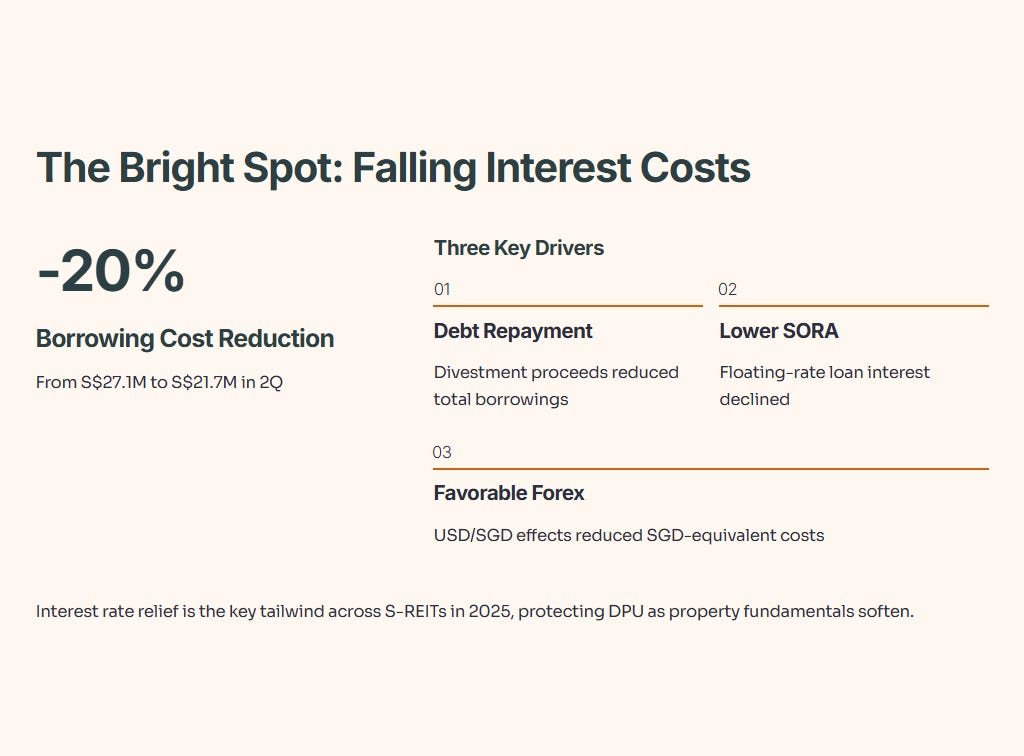
Borrowing Costs: S$21.7 million (down 20.0% year-on-year)
This is the bright spot. Borrowing costs fell by 20% due to three factors: debt repayment from divestment proceeds, lower interest on unhedged floating-rate loans (SORA has dropped), and favorable USD/SGD effects. This decline partially offset the NPI weakness and protected DPU.
For Singapore REIT investors, falling borrowing costs are the key tailwind in 2025. With SORA down from peak levels and Fed rate cuts underway, interest expenses are easing across the S-REIT sector.
Cash Distribution Declared by Joint Venture: S$5.3 million (down 25.2% year-on-year)
MIT holds a 50% stake in a joint venture with Mapletree Investments that owns 13 North American data centres. The JV distribution dropped because of higher borrowing costs from repricing matured interest rate swaps and a lease pre-termination in the prior year.
Amount Available for Distribution: S$93.4 million (down 5.5% year-on-year)
This is the pool of cash available to distribute. The 5.5% decline is smaller than the NPI decline thanks to lower borrowing costs.
Distribution to Unitholders: S$90.7 million (down 5.3% year-on-year)
After paying perpetual securities holders S$2.4 million, the remaining S$90.7 million went to unitholders. The 5.3% drop flows through to DPU.
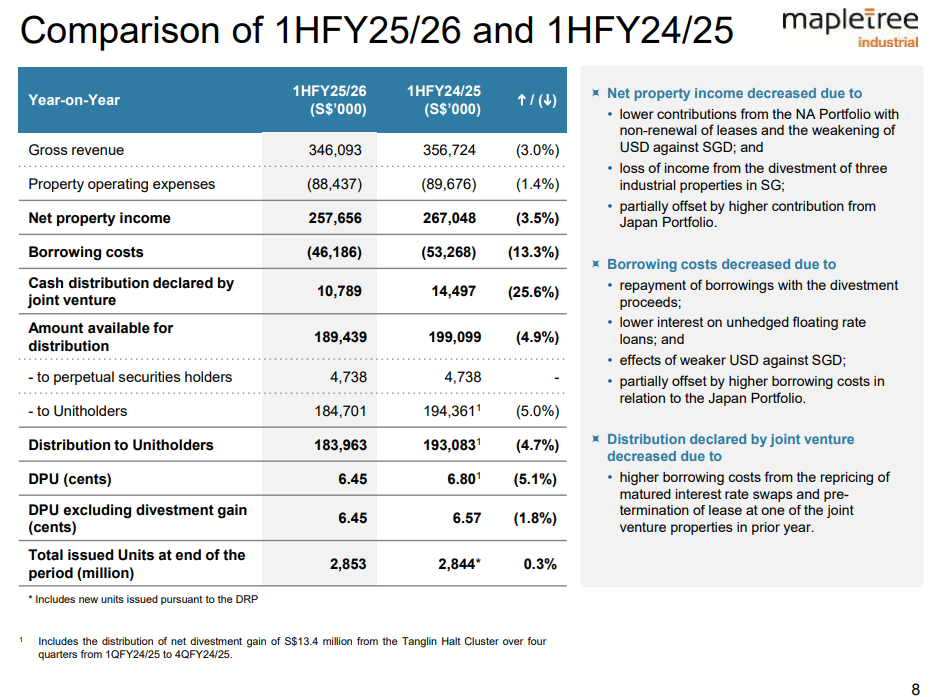
1H FY25/26 Financial Performance
The half-year numbers tell the same story with slightly different magnitudes.
Gross Revenue: S$346.1 million (down 3.0% year-on-year)
Revenue decline was less severe over the half because the divestment only impacted August and September. First quarter had a full contribution from the three properties.
Net Property Income: S$257.7 million (down 3.5% year-on-year)
NPI held up better on a half-year basis for the same reason.
Borrowing Costs: S$46.2 million (down 13.3% year-on-year)
The same factors—debt repayment, lower SORA, and forex—drove borrowing cost savings.
DPU: 6.45 cents (down 5.1% year-on-year)
For the half-year, DPU fell from 6.80 cents to 6.45 cents. Excluding last year’s divestment gain, the decline was just 1.8%.
Data Table: Year-on-Year Financial Comparison
The key takeaway: normalized DPU decline is modest because falling interest costs are cushioning operational headwinds. This is the story across most S-REITs right now—interest rate relief is arriving just as some property fundamentals soften.
Slide 4: 2Q FY25/26 Quarter-on-Quarter Performance
Let’s compare 2Q FY25/26 to the immediately preceding 1Q FY25/26 to spot trends.
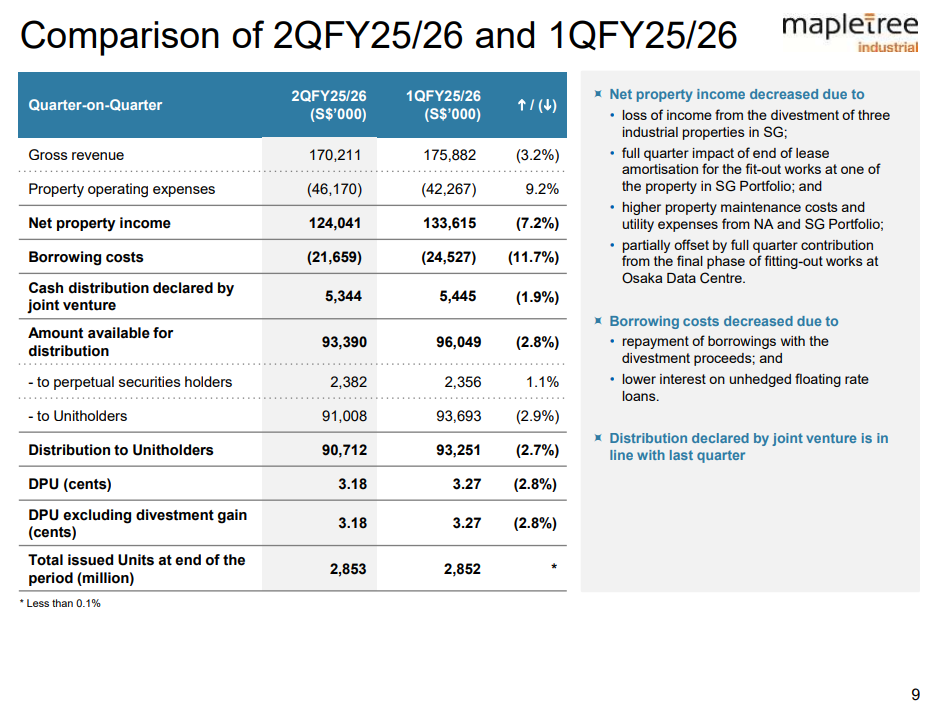
Gross Revenue: S$170.2 million (down 3.2% quarter-on-quarter)
Revenue fell sequentially because the three divested properties contributed zero revenue in 2Q after completion of sale in mid-August.
Property Operating Expenses: S$46.2 million (up 9.2% quarter-on-quarter)
Expenses jumped due to higher property maintenance costs and utility expenses in North America and Singapore, plus the full quarter impact of lease amortization ending at one Singapore property.
Net Property Income: S$124.0 million (down 7.2% quarter-on-quarter)
The combination of lower revenue and higher expenses hit NPI hard sequentially. This is partly seasonal and partly tied to the divestment timing.
Borrowing Costs: S$21.7 million (down 11.7% quarter-on-quarter)
Interest costs continued to decline thanks to debt repayment and lower floating rates. This trend should continue as more hedges mature and get replaced at lower rates, though management warns that hedge replacement costs are rising.
DPU: 3.18 cents (down 2.8% quarter-on-quarter)
The sequential DPU drop from 3.27 cents to 3.18 cents reflects the divestment impact and higher operating costs, partially offset by interest savings.
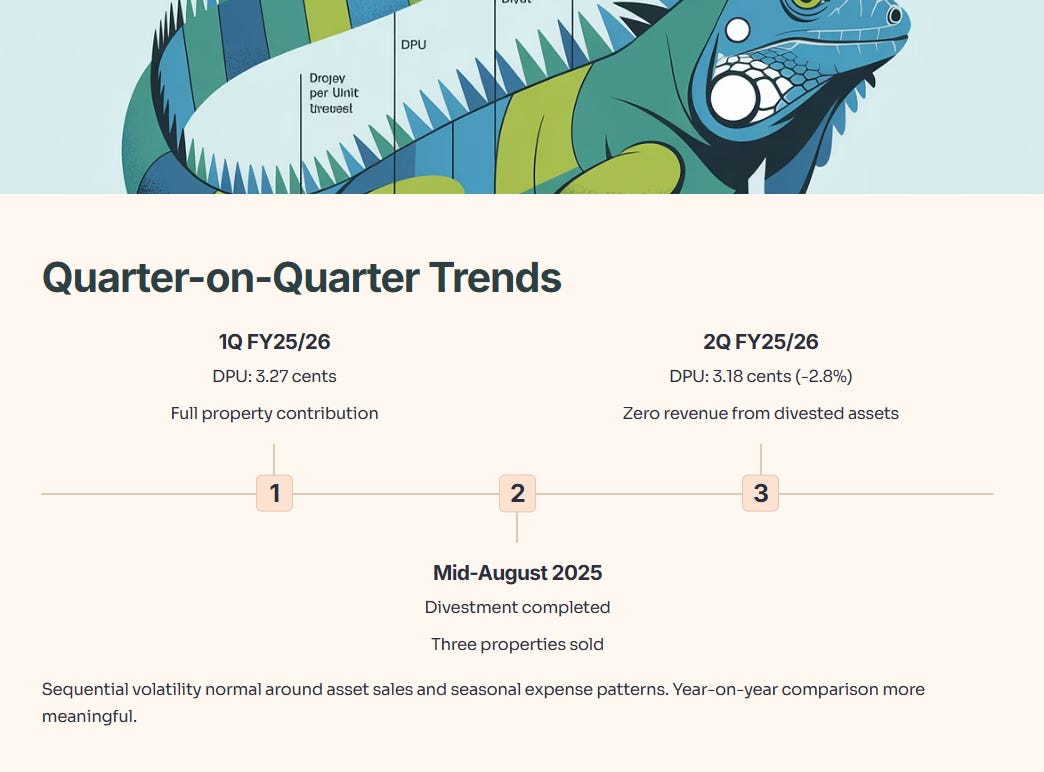
For investors, the quarter-on-quarter trend is less important than the year-on-year comparison. Sequential volatility is normal around asset sales and seasonal expense patterns.
Slide 5: Statement of Financial Position
This slide shows MIT’s balance sheet as of 30 September 2025 versus 31 March 2025 (end of prior financial year).
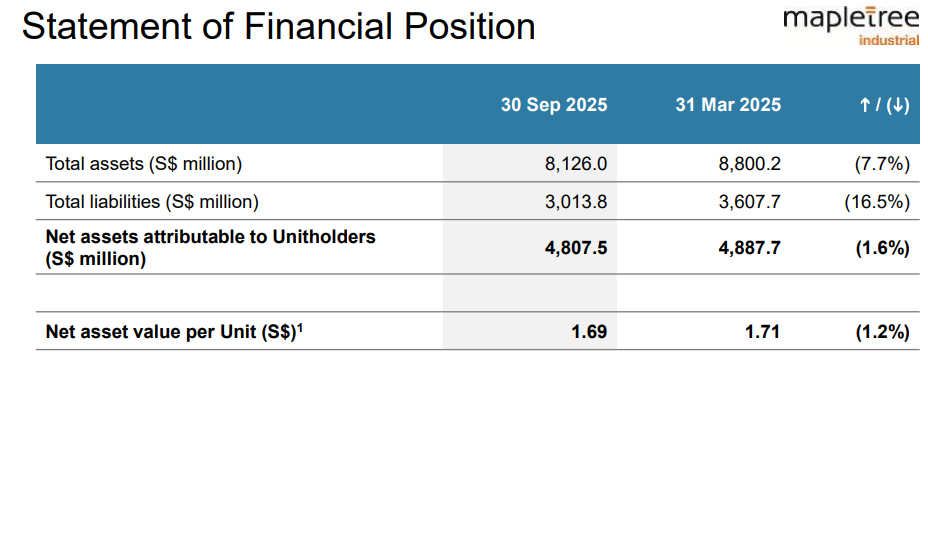
Total Assets: S$8.13 billion (down 7.7%)
Assets declined due to the divestment of three properties and forex translation effects from a weaker USD.
Total Liabilities: S$3.01 billion (down 16.5%)
Liabilities fell sharply because MIT used divestment proceeds to repay debt. This is exactly what you want to see—capital recycling to improve the balance sheet.
Net Assets Attributable to Unitholders: S$4.81 billion (down 1.6%)
Net asset value (NAV) dipped slightly. The reduction is driven by distributions paid out to unitholders, partially offset by positive valuation movements in some properties.
Net Asset Value per Unit: S$1.69 (down 1.2%)
NAV per unit fell modestly from S$1.71 to S$1.69. With MIT trading around S$2.22 as of late October 2025, the price-to-book ratio is about 1.31x.
Is that expensive or cheap? For industrial REITs, 1.3x P/B is reasonable but not a screaming bargain. Singapore REITs overall trade at 0.9x P/B on average, but MIT’s data centre exposure commands a premium given the long-term growth outlook for AI and cloud infrastructure.
Data Table: Balance Sheet Summary
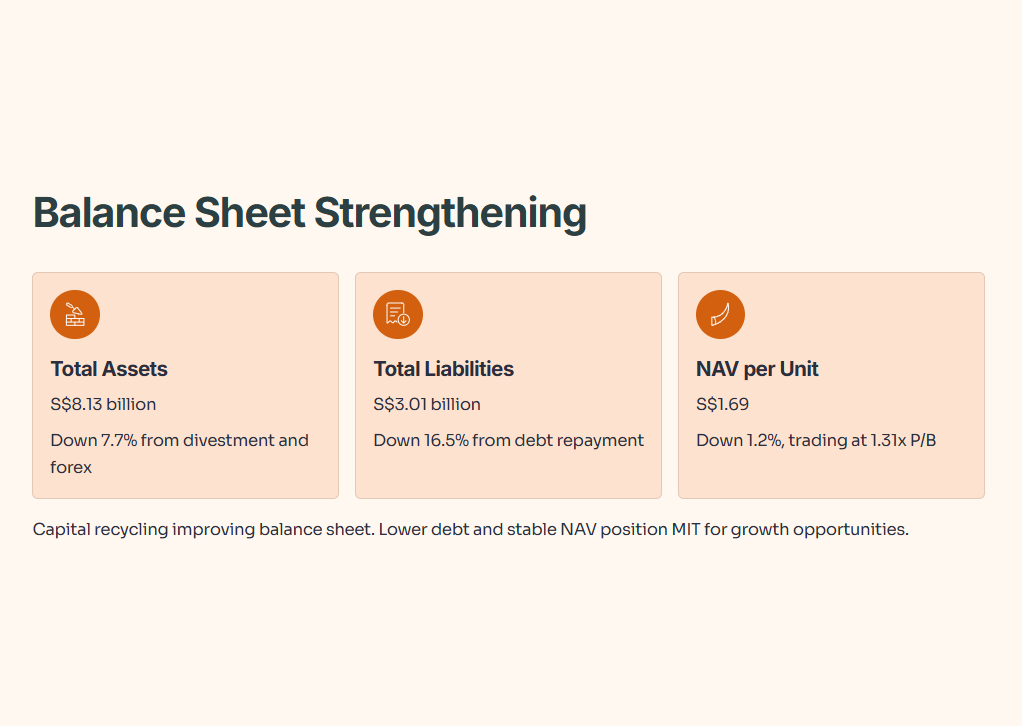
The balance sheet is strengthening. Lower debt and stable NAV position MIT to pursue growth opportunities when they arise.
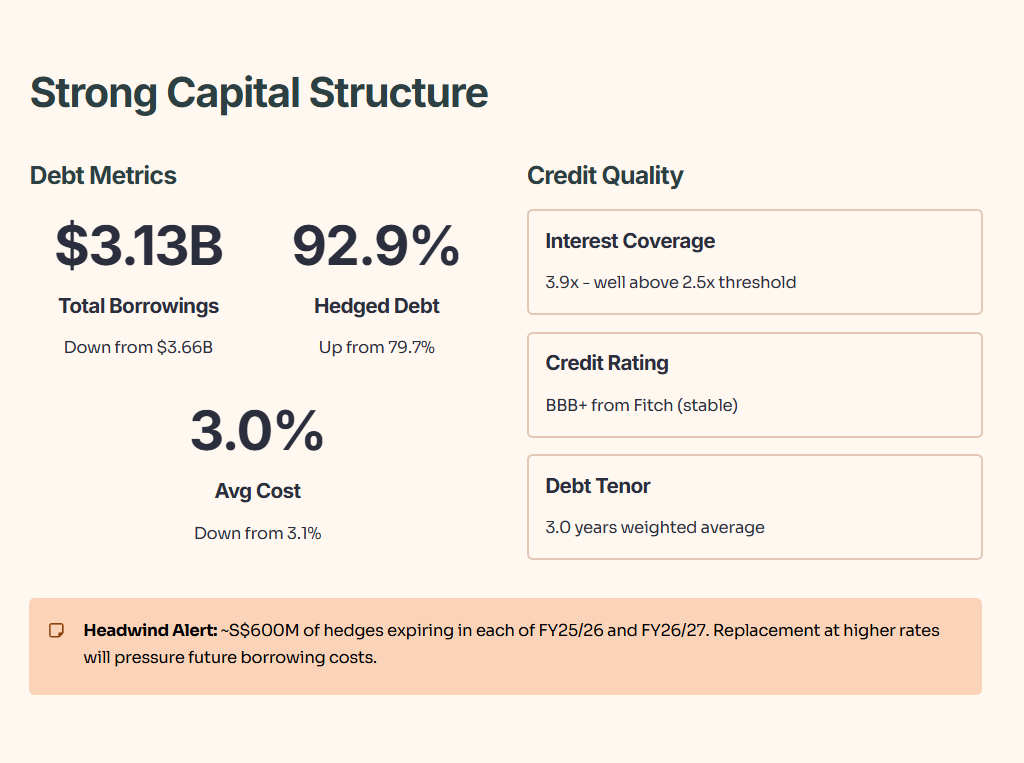
Slide 6: Strong Balance Sheet and Capital Management
MIT’s capital structure is the foundation of its ability to weather volatility and fund growth.
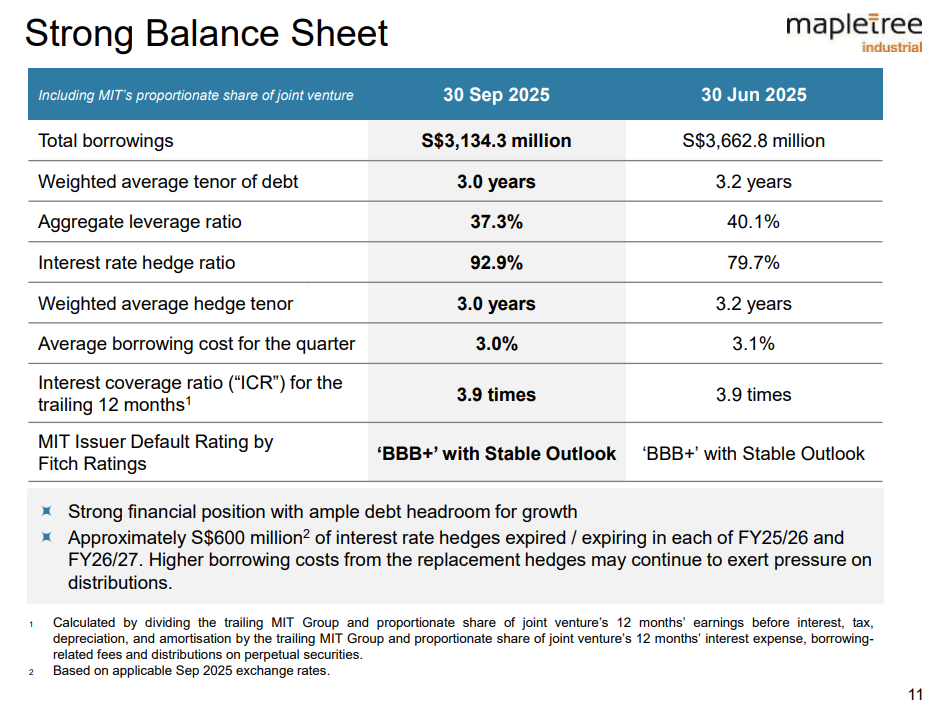
Total Borrowings: S$3.13 billion (down from S$3.66 billion in June 2025)
MIT repaid over S$500 million in debt using divestment proceeds. This reduced leverage and freed up debt headroom.
Aggregate Leverage Ratio: 37.3% (down from 40.1%)
Leverage dropped by nearly 3 percentage points, well below the 50% regulatory cap and in line with the S-REIT sector average.
Interest Rate Hedge Ratio: 92.9% (up from 79.7%)
MIT increased hedging to lock in rates. About 93% of debt is now hedged or fixed, reducing exposure to rate volatility. However, this comes at a cost—new hedges are more expensive than expiring ones, which will pressure future interest expenses.
Average Borrowing Cost: 3.0% (down from 3.1%)
The average cost of debt fell slightly in the quarter. But management warned that approximately S$600 million of interest rate hedges expired or will expire in each of FY25/26 and FY26/27. Replacing these at current market rates (which are higher than the old hedge rates) will push borrowing costs up in coming quarters.
This is the trade-off: near-term interest relief from falling SORA is being offset by the need to renew hedges at higher long-term rates. It’s a headwind unique to REITs that heavily hedged in the low-rate environment of 2020-2021.
Interest Coverage Ratio: 3.9 times
ICR measures how many times earnings can cover interest payments. A ratio of 3.9x is healthy and well above the 2.5x threshold that credit rating agencies watch. MIT’s BBB+ rating from Fitch is stable.
Weighted Average Debt Tenor: 3.0 years
Debt maturity averages 3 years, which is manageable. No more than 24% of debt matures in any single year, reducing refinancing risk.
For Singapore CPF investors, MIT’s balance sheet is investment-grade quality. The leverage is conservative, the ICR is strong, and refinancing risk is well-managed. The only concern is the rising cost of hedge renewals, but that’s a sector-wide issue, not MIT-specific.
Data Table: Capital Management Metrics
MIT’s capital position is improving. The trust has room to borrow for acquisitions if attractive opportunities emerge, especially in the data centre space where growth is accelerating.
Slide 7: Debt Maturity Profile and Currency Mix
MIT’s debt is well-distributed across maturities and currencies, reducing rollover and forex risk.
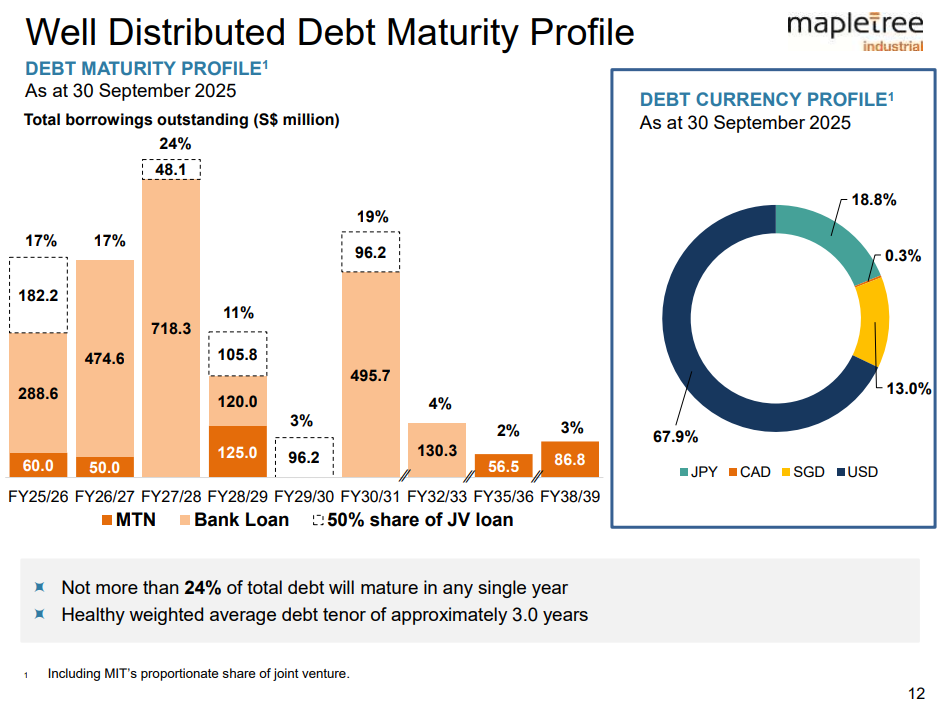
Debt Maturity Profile
No more than 24% of total debt matures in any single year through FY35/36. The largest maturities are in FY26/27 (17%), FY27/28 (24%), and FY25/26 (17%). This staggered profile avoids refinancing concentration risk.
The weighted average debt tenor of 3.0 years is healthy. It’s long enough to avoid constant refinancing but short enough to benefit when rates fall.
Debt Currency Profile
MIT’s debt is denominated in four currencies:
USD: 67.9%
SGD: 13.0%
JPY: 18.8%
CAD: 0.3%
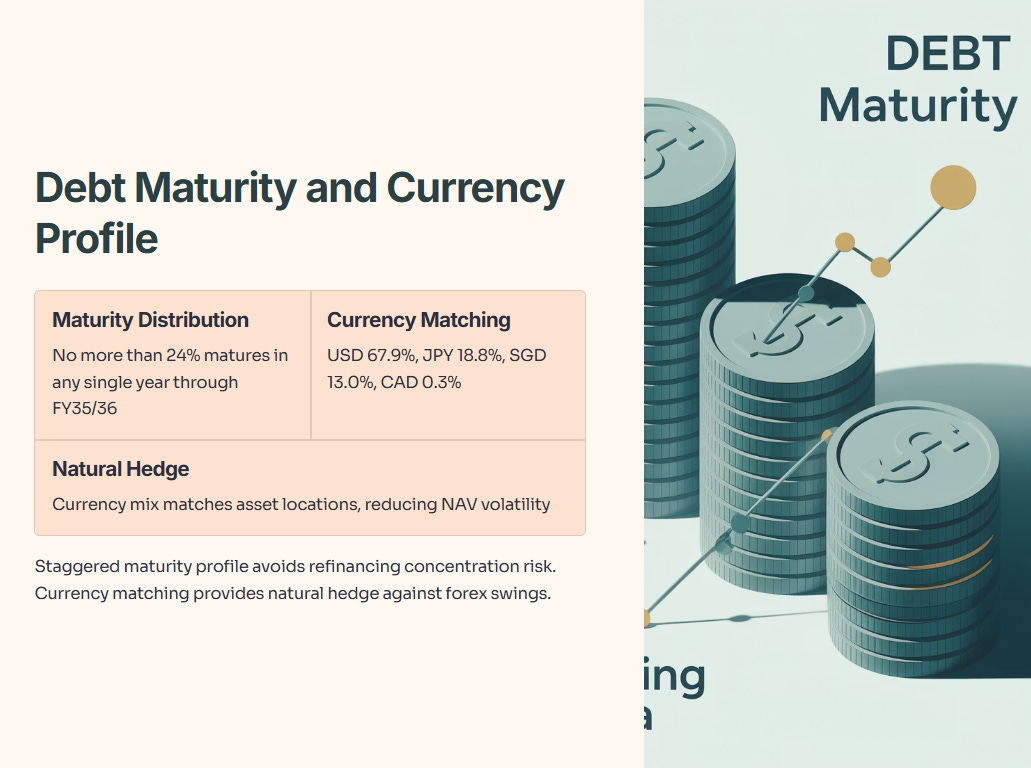
The heavy USD weighting matches MIT’s 47.2% exposure to North American assets. This provides a natural hedge—when USD strengthens, asset values rise, offsetting higher SGD-equivalent debt. When USD weakens (as it has recently), debt obligations shrink in SGD terms, cushioning the hit to North American rental income.
The JPY borrowing matches the Japan portfolio, which now comprises 7.6% of AUM following the Osaka and Tokyo data centre acquisitions.
For Singapore investors, this currency matching is good risk management. It reduces the volatility of NAV and distributions from forex swings.
Slide 8: Interest Rate and Forex Risk Management
MIT hedges aggressively to smooth out volatility from interest rates and currencies.
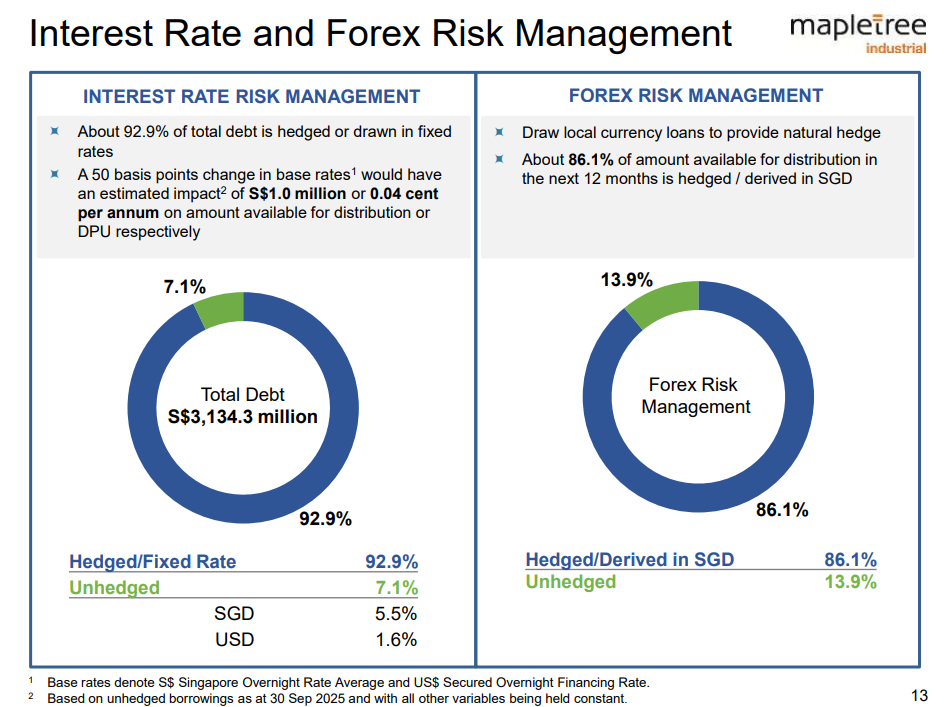
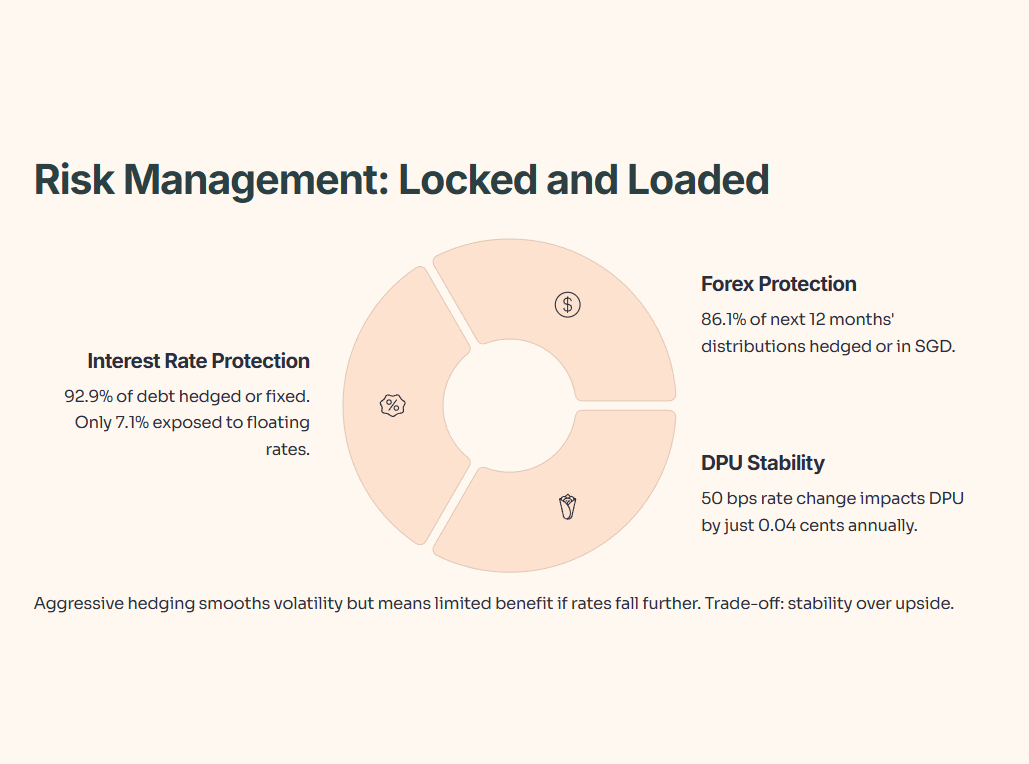
Interest Rate Risk Management
About 92.9% of total debt is hedged or drawn at fixed rates. Only 7.1% is exposed to floating rates (5.5% in SGD, 1.6% in USD). A 50 basis point change in base rates would impact DPU by just 0.04 cents per annum, or about S$1.0 million.
That’s minimal sensitivity. MIT has effectively locked in its borrowing costs for the next few years, which provides stability but also means it won’t fully benefit if rates fall further.
Forex Risk Management
About 86.1% of the amount available for distribution in the next 12 months is hedged or derived in SGD. This protects unitholder distributions from forex volatility.
MIT draws local currency loans where possible (USD for North American assets, JPY for Japan assets) to create natural hedges. Any remaining exposure is hedged via forward contracts.
For income-focused investors, this hedging is reassuring. Your quarterly distributions won’t swing wildly due to exchange rate moves.
Slide 9: Portfolio Update – Diverse Portfolio of 136 Properties
MIT’s portfolio spans three geographies and three property types, offering diversification and growth optionality.
