



CapitaLand China Trust Earns in Renminbi, Pays in Singapore Dollars. Three Questions 🦖
Malls were 97.2% full and business parks 85.7%, and the third quarter was weaker than the first nine months. Where does the weakness sit, and does it matter to you?
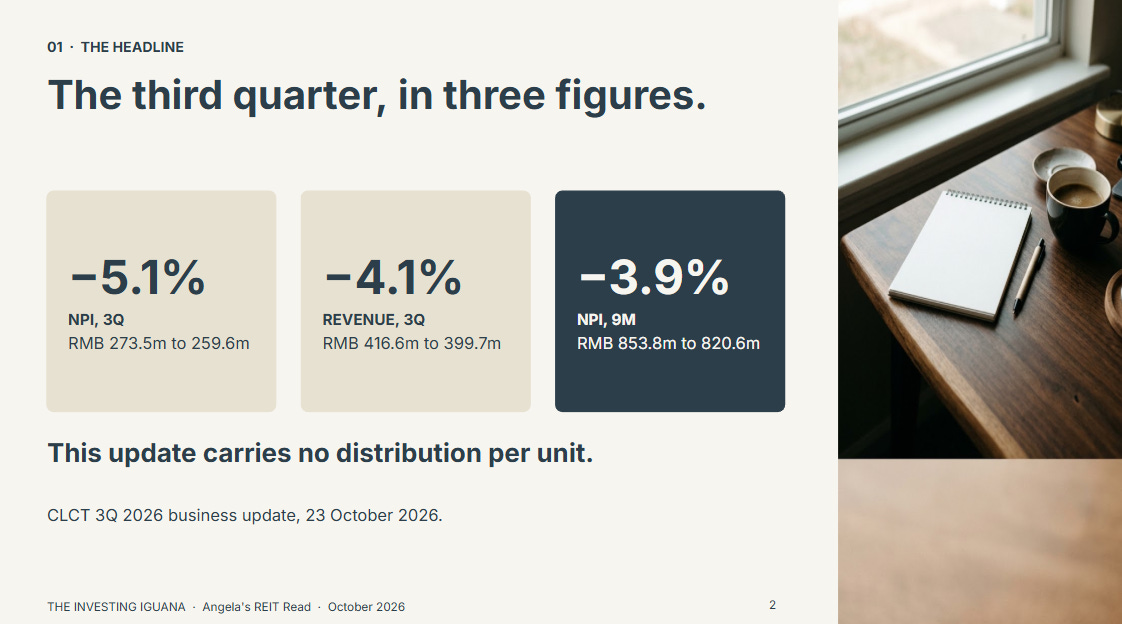
On 23 October, CapitaLand China Trust (CLCT) published its business update for the third quarter. It carries no distribution per unit, because CLCT gives that figure only with its half-year and full-year results. What it does carry is net property income, which fell 5.1% in the quarter to RMB 259.6 million, from RMB 273.5 million a year earlier. The trust’s own yield figure of 7.9% sits on the first page of the same deck, and it was calculated before this quarter began.
Many readers hold CLCT for the payout, and many hold it inside an SRS account or alongside a few other REITs. Two things make it different from a Singapore mall REIT. Its rent is collected in renminbi, and its payout reaches you in Singapore dollars. I read the full 44-page deck, and I take no view on whether anyone should buy, hold or sell. What I can do is show what the figures say, where the weakness sits and which dates matter next.
What This Piece Does
It sets out what earning in one currency and paying in another does to the figures in the deck, and how much of the 7.9% yield belongs to the period before this quarter.
It works through three questions: what the currency does, where the quarter weakened, and what has to be renewed and refinanced before the next full-year results.
It puts the deck’s own lease and debt schedules next to each other, with my own arithmetic labelled as mine.
The first two questions are free to read. The third, where the lease calendar meets the debt calendar, is in the members’ half. This piece assigns no zone and takes no view on any unit price. Nothing here is a recommendation.

What This Piece Does
Question 1: What Does Earning in Renminbi and Paying in Singapore Dollars Do to the Numbers?
Which currency does the trust earn in, and which does it pay in?
What did the currency do to the reported figures?
How much of the 7.9% is the trust’s own income?
🟠 Angela’s Observation
Question 2: Where Did the Third Quarter Weaken?
Which parts of the portfolio fell?
Is this a divestment effect or an operating one?
What do occupancy and rents say?
Question 3: What Has to Be Renewed and Refinanced Before the Next Full-Year Results?
How much of the rent comes up for renewal in 2027?
When does the debt fall due?
What does the manager say about the year ahead?
🟠 Angela’s Observation
What I Am Watching Next, Without Predicting
Iggy’s Forensic Read
Question 1: What Does Earning in Renminbi and Paying in Singapore Dollars Do to the Numbers?
Which currency does the trust earn in, and which does it pay in?
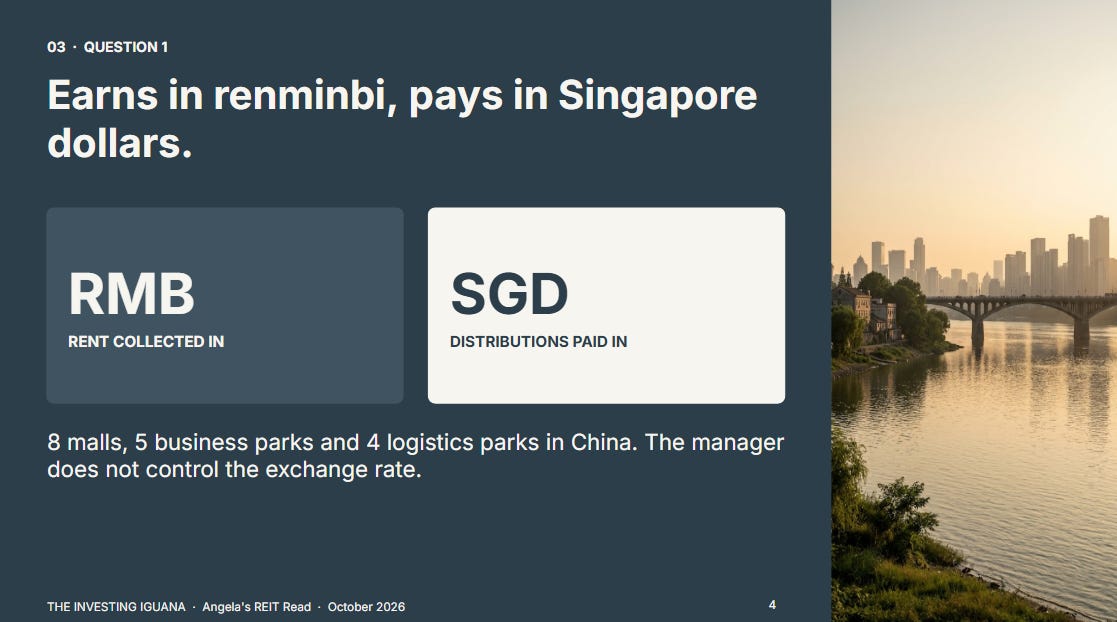
CLCT owns eight malls, five business parks and four logistics parks across China, with total assets of about SGD 4.6 billion at the end of June. The rent comes in as renminbi, and the deck reports revenue and net property income in renminbi. The units trade in Singapore dollars and the distributions are paid in Singapore dollars. Somewhere between the mall and your brokerage account, a conversion happens, and the rate at which it happens is not controlled by the manager.
What did the currency do to the reported figures?
The deck says the renminbi strengthened by 2.6% year on year against the Singapore dollar, and it uses that figure for its nine-month comparison. For the first nine months, net property income was RMB 820.6 million, down 3.9% from RMB 853.8 million. On a same-store basis, which leaves out CapitaMall Yuhuating (divested; the deck counts its contribution only in the first half of 2025), the decline was 0.8%.
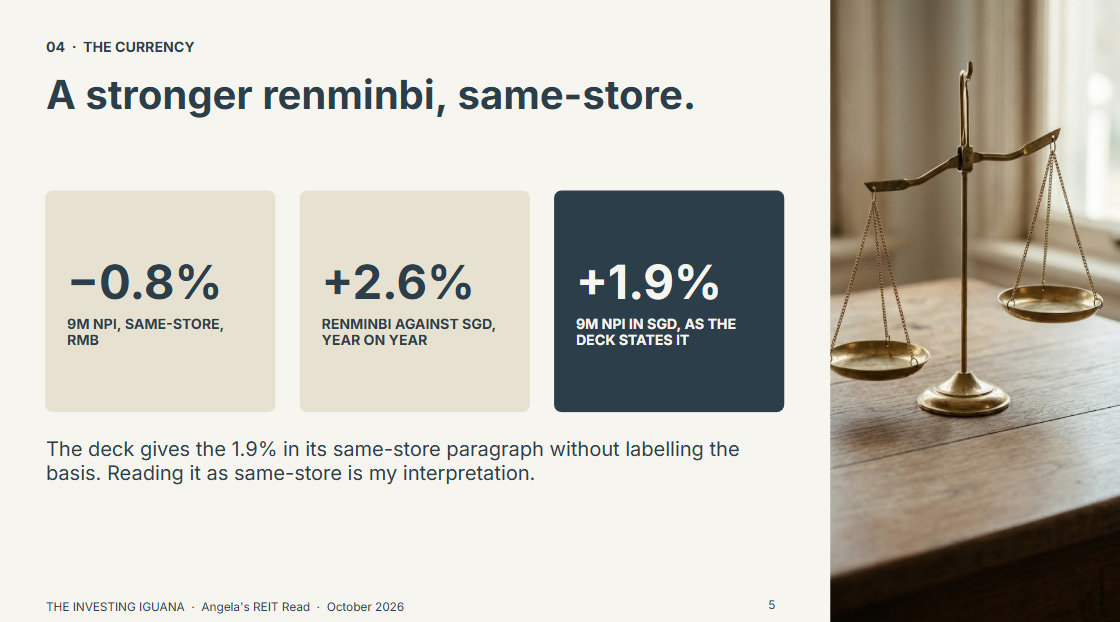
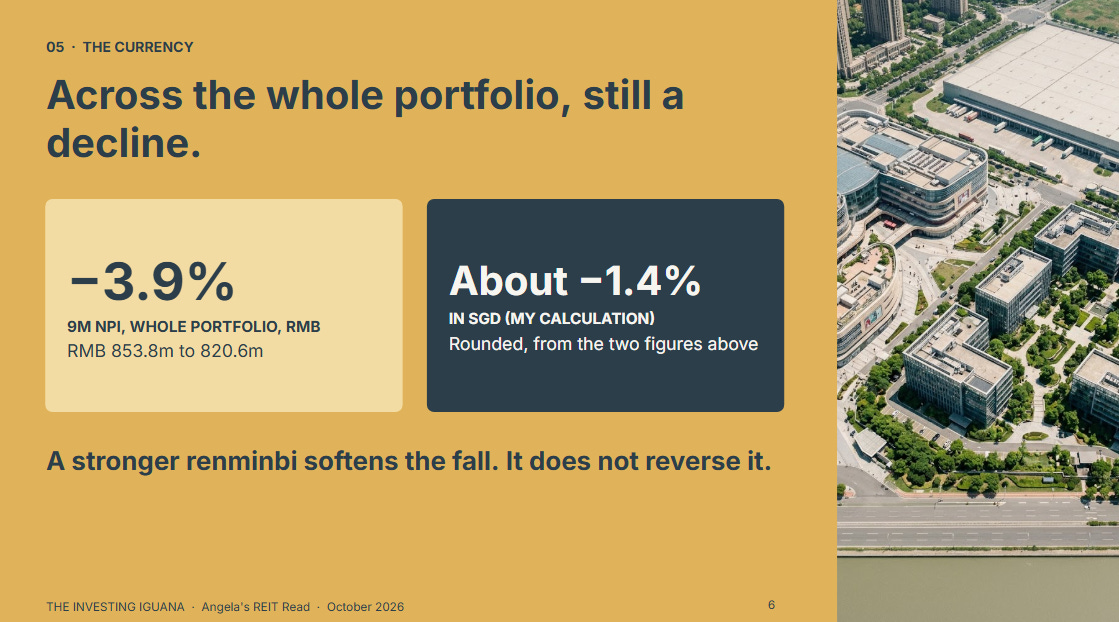
The deck then says that “in SGD terms, NPI increased by 1.9% YoY”. It states this in the same-store paragraph and does not label the basis. I read it as the same-store figure, because the arithmetic only works that way: a 0.8% fall combined with a 2.6% stronger currency gives about +1.8%. For the whole portfolio, a 3.9% fall combined with the same currency move gives about -1.4%. That is my own arithmetic on rounded figures, and the deck does not state it. So the currency helped the Singapore-dollar picture over nine months, and the picture was still a small decline overall.
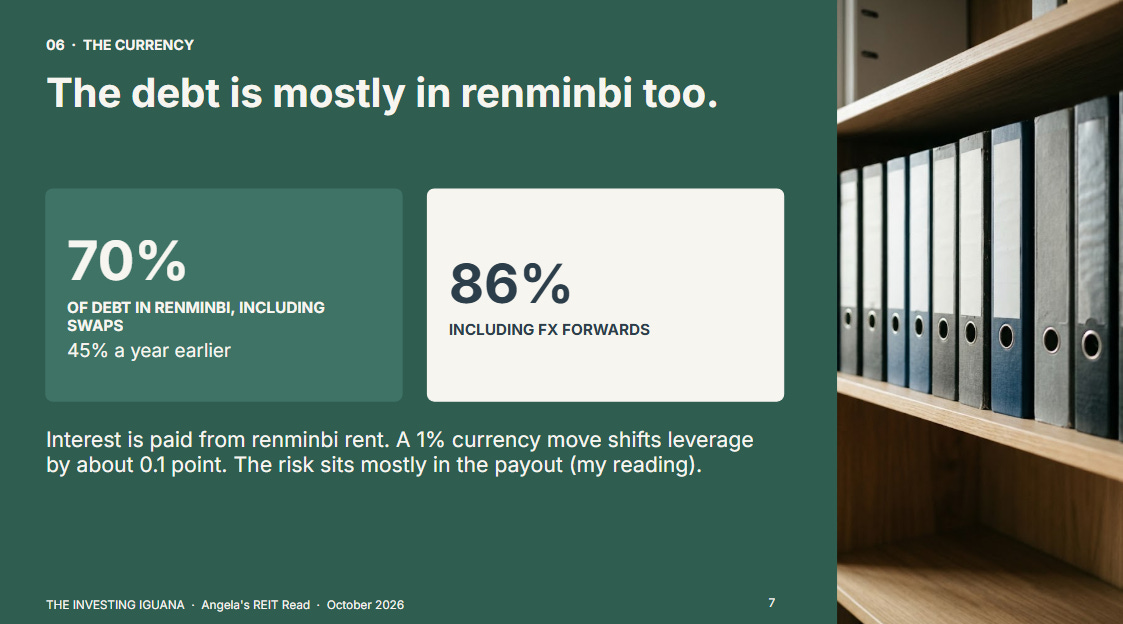
The effect on the debt side is the one most readers miss. The deck shows that 70% of the debt is denominated in renminbi, including cross-currency swaps, up from 45% a year earlier, and 86% if foreign exchange forwards are included. Renminbi debt is serviced out of renminbi rent, so a moving exchange rate matters less to the interest bill than to the distribution. The deck also gives a sensitivity: a 1% move in the Singapore dollar against the renminbi changes aggregate leverage by about 0.1 percentage point. That is small, and it tells you the balance sheet is not where the currency risk sits. The risk sits in the conversion of the payout.
How much of the 7.9% is the trust’s own income?
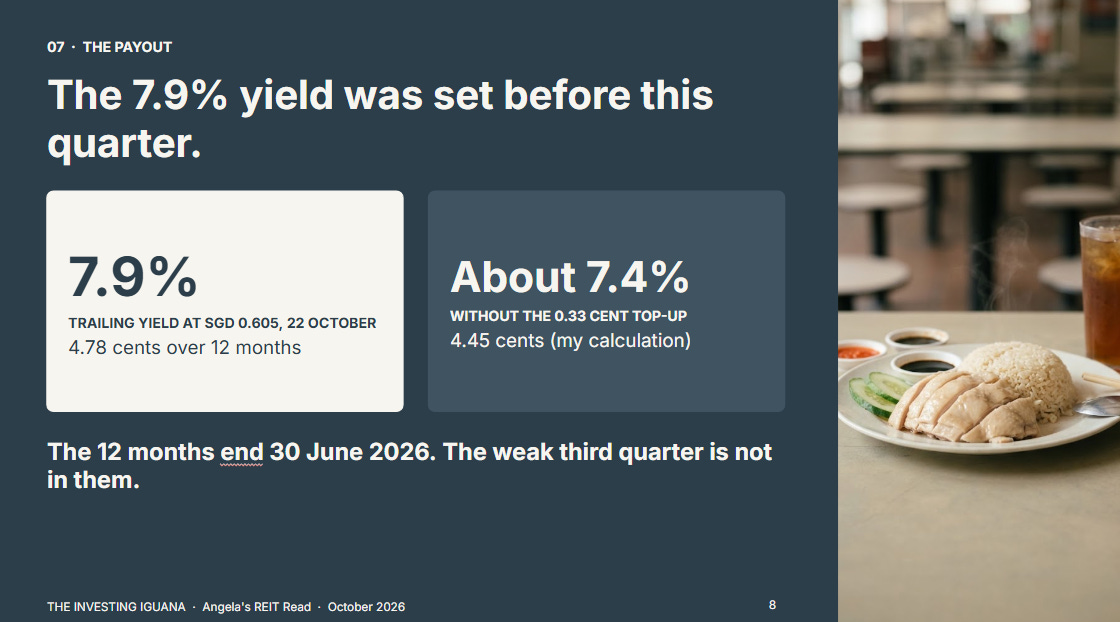
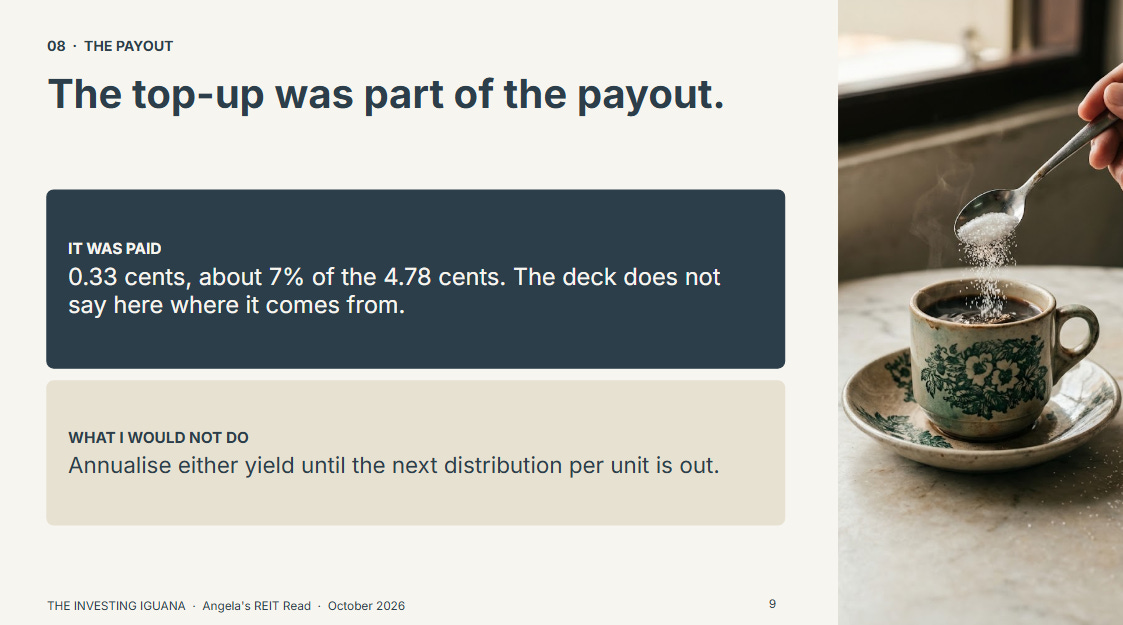
The 7.9% comes from a trailing twelve-month distribution of 4.78 Singapore cents, over a unit price of SGD 0.605 on 22 October. Two details in the deck’s footnote matter. The twelve months run from 1 July 2025 to 30 June 2026, so the weak third quarter is not in it. And the 4.78 cents includes a distribution top-up of 0.33 Singapore cents, which is about 7% of the total. The deck does not say here where the top-up comes from. Without it the figure is 4.45 cents, which is about 7.4% at the same price. Both percentages are my arithmetic on the deck’s inputs, and the price will have moved since 22 October.
The pushback I expect is fair: a yield is a yield, and a top-up is cash. It is cash, and it was paid. What matters is that a payout supported partly by a top-up and a payout supported entirely by rent are different things to carry forward, and the next full-year results will show which one this is. I would not annualise either figure until the next DPU is out.
🟠 Angela’s Observation
Before a trip to Xiamen, my husband checked the Singapore dollar rate three times in one week. Each answer changed what he thought the trip would cost, though nothing about the trip had changed. A trust that earns in renminbi lives with that every quarter, with revenue of about RMB 400 million in the quarter instead of a hotel bill. What I notice is how easily a reader takes an income figure in one currency and a payout in the other and compares them without converting. When I look at a 7.9% yield, do I know which currency the earnings behind it were made in?
That settles what the currency does. The next question is where the quarter itself weakened.
Question 2: Where Did the Third Quarter Weaken?
Which parts of the portfolio fell?
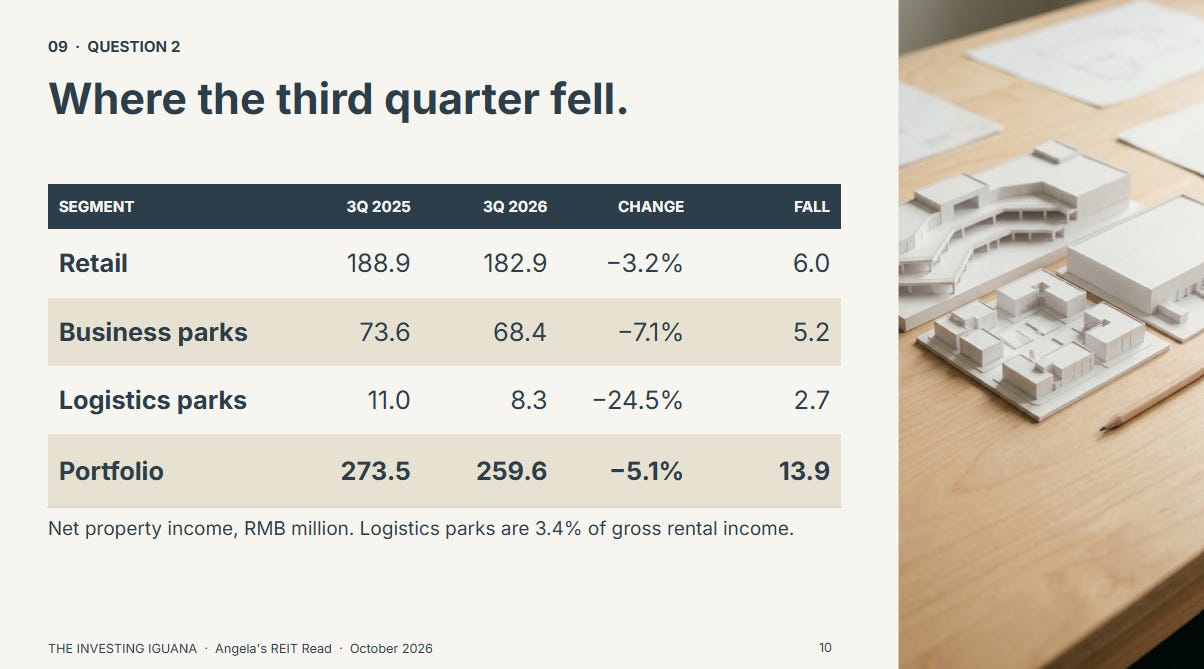
Gross revenue fell 4.1%, from RMB 416.6 million to RMB 399.7 million. Net property income fell faster than revenue, so the share of revenue kept as income eased from about 65.7% to 64.9%, which is my arithmetic. Retail accounts for the largest part of the RMB 13.9 million fall because it is by far the largest segment. The percentage falls are larger in business parks and logistics parks, but logistics parks are only 3.4% of gross rental income, so a 24.5% drop there is RMB 2.7 million. The deck explains its nine-month declines by property. It does not give a property-level explanation for the quarter alone, so I will not attribute the quarter’s figures to named malls or parks.
Is this a divestment effect or an operating one?
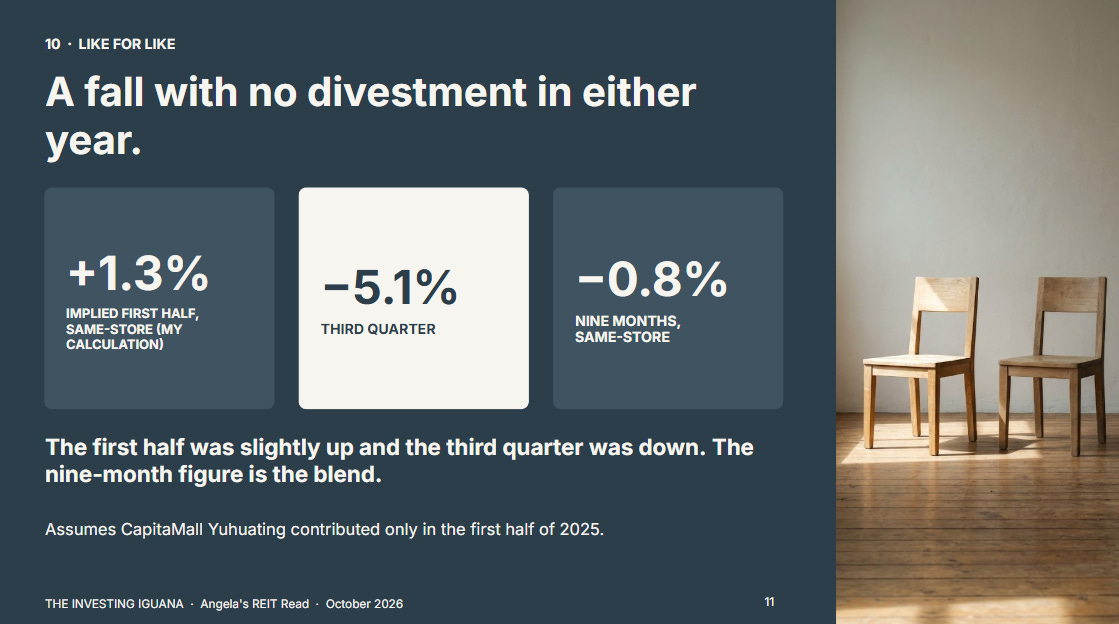
The segment slides for the third quarter show retail, business parks and logistics parks only, with no CapitaMall Yuhuating line in either year. So the 5.1% is like for like, which the nine-month figure of 3.9% is not. I worked out what that implies. Nine-month net property income for 2025 was RMB 853.8 million, less RMB 26.7 million from Yuhuating, which leaves RMB 827.1 million. Take away the third quarter of 2025 and the first half was RMB 553.6 million. For 2026, RMB 820.6 million less RMB 259.6 million leaves RMB 561.0 million for the first half. That is about 1.3% higher on a same-store basis. I assume here that Yuhuating contributed only in the first half of 2025, as the deck’s definition implies. On that reading, the first half was slightly up, the third quarter was down 5.1%, and the nine-month same-store figure of -0.8% is the blend of the two.
What do occupancy and rents say?
Retail occupancy was 97.2% at 30 September, against 97.1% a year earlier. CapitaMall Xinnan was the lowest at 89.1%, and the deck says its decline earlier in the year came from repositioning space toward food and beverage and experiential tenants. Tenant sales rose 3.5% over nine months, against China retail sales growth of 1.1% in the same nine months, which the deck cites, and 8.4% if automobile sales are excluded. Shopper traffic rose 1.9%.
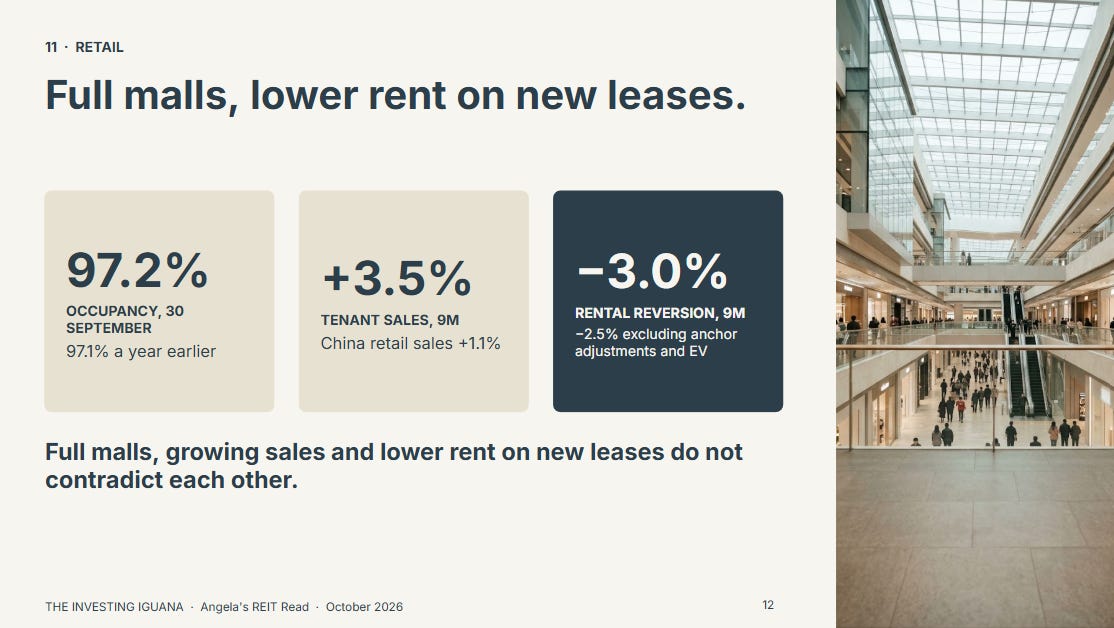
Rents are where retail gave ground. Nine-month rental reversion, which compares the average rent of new leases with the average rent of the leases they replace, was -3.0%. Excluding two planned anchor adjustments and a third item the deck labels EV, it was -2.5%. The deck describes the anchor changes as lease actions to upgrade two major anchor spaces. So a mall can be 97% full, with sales and traffic growing, while the income per square metre it collects is lower than before. Those two facts do not contradict each other.
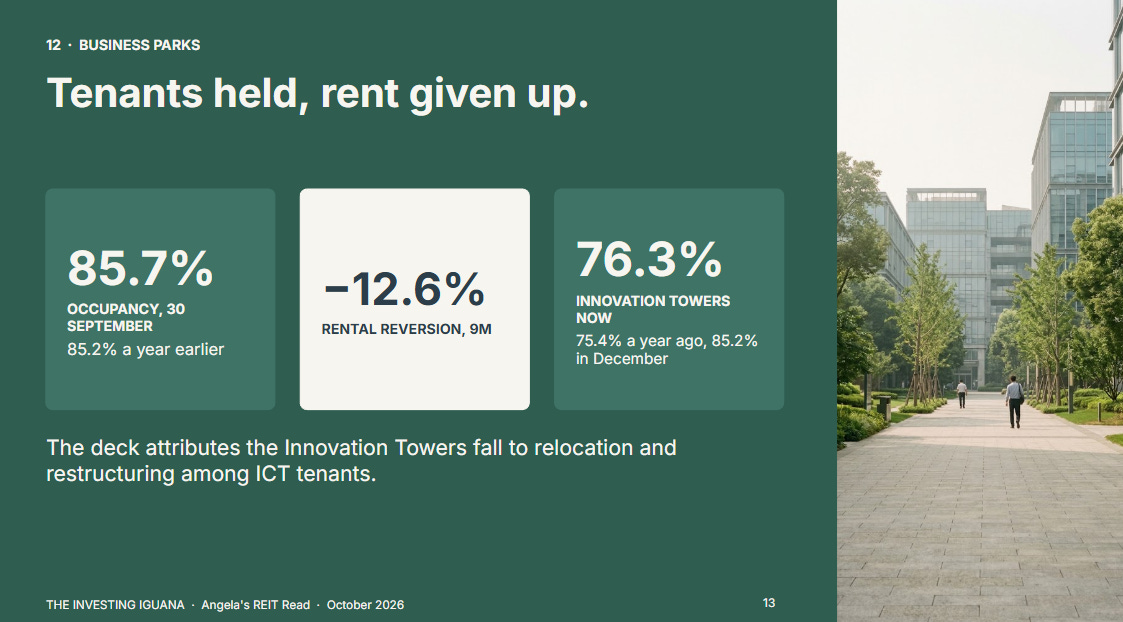
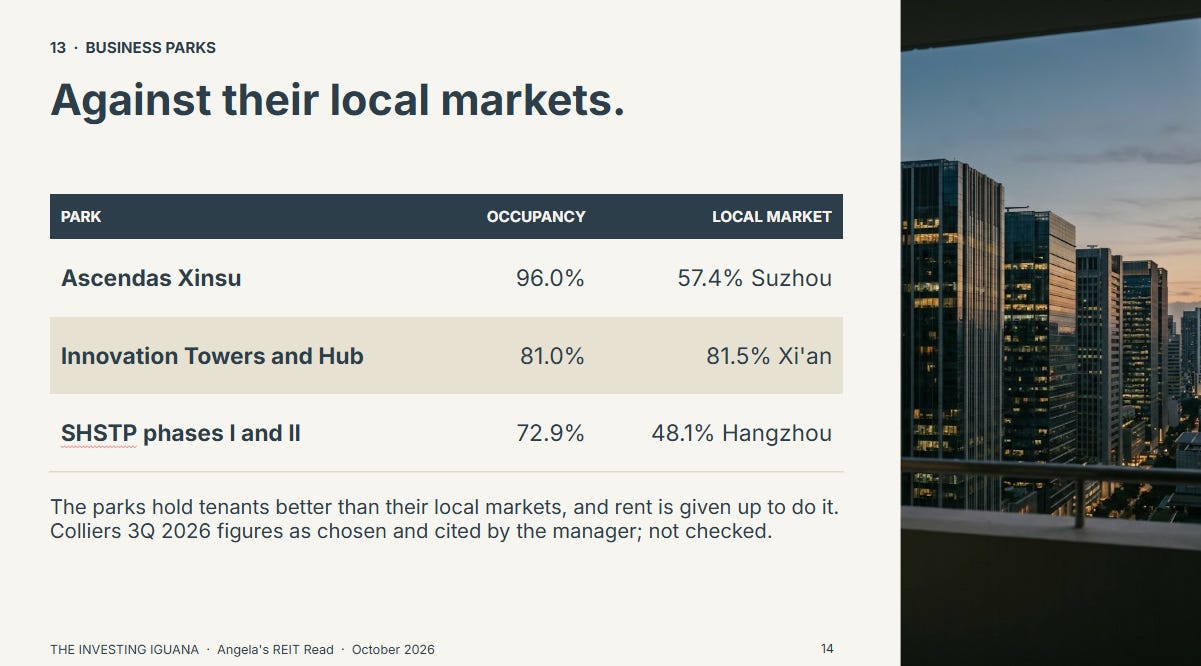
Business parks had occupancy of 85.7%, up from 85.2% a year earlier, with a reversion of -12.6% over nine months. One property moved sharply: Ascendas Innovation Towers was 75.4% a year ago, 85.2% in December, 82.2% in March, 80.1% in June and 76.3% now, and the deck attributes the fall to relocation and restructuring among information and communications technology tenants. The deck also compares its parks with local markets, using Colliers data for the third quarter. Ascendas Xinsu was 96.0% against a Suzhou submarket of 57.4%. Innovation Towers and Innovation Hub combined were 81.0% against 81.5% for Xi’an. The two Singapore-Hangzhou Science and Technology Park phases combined were 72.9% against 48.1% for Hangzhou. Those figures say the business parks hold their tenants better than their local markets do, and they say rents are being given up to do it. I have not checked the Colliers numbers, and the comparison was chosen by the manager.
Logistics parks were 98.6% occupied, and their nine-month reversion improved from -24.5% for the whole of 2025 to -1.3%. Those two figures share a number with the 3Q income fall of 24.5% by coincidence, and they measure different things.
The pushback I expect is the obvious one: if the malls are this full, why is income down? From the deck, the answer is lower rent on new leases and lower rates at several malls. It names CapitaMall Xinnan, Grand Canyon, Wangjing and Aidemengdun for the nine months. I cannot split the retail revenue decline between those malls and the divested one, because the deck gives the nine-month retail revenue decline of 5.1% only on the all-in basis. For the third quarter alone, retail revenue fell 2.9%, from RMB 294.8 million to RMB 286.3 million.
What the Paid Half Adds
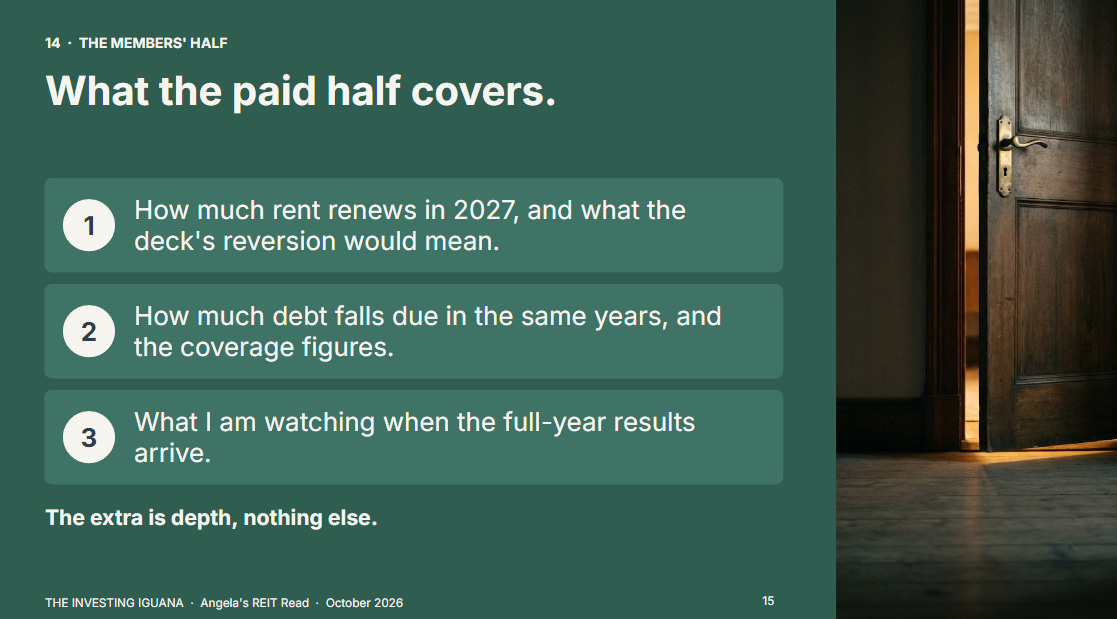
The free half shows what the currency does and where the quarter weakened. The paid half sets the lease calendar against the debt calendar: how much of the rent comes up for renewal in 2027, what the deck’s own reversion figures would mean if they repeated on those leases, how much debt falls due in the same years, and which of the deck’s coverage numbers I would look at first. It also sets out what I am watching for when the full-year results arrive. The extra is depth, nothing else.
The Substack Only Plan, US$8/month, gives the full written analysis, portfolio walkthroughs and analyst cheatsheets.
The YouTube Only Plan, S$5/month, gives the full-length Members Edition video.
The YouTube/Substack Combo, S$12/month, gives all of it.

🔒 What’s Next
The deck says 41.5% of retail rent and 40.5% of business park rent comes up for renewal in 2027. The next section puts the deck’s own reversion figures on that, and sets it beside the debt due in the same year.
