



Wilmar’s Net Profit Swung From a Loss to US$281m. Its Core Profit Fell 25.2%. Read Both Lines
Core net profit was US267.3millionagainstUS357.2 million, and operating cash flow fell 63.7%. At S$3.14 the trailing yield is 4.78%, but net debt is 0.91 times owners’ equity
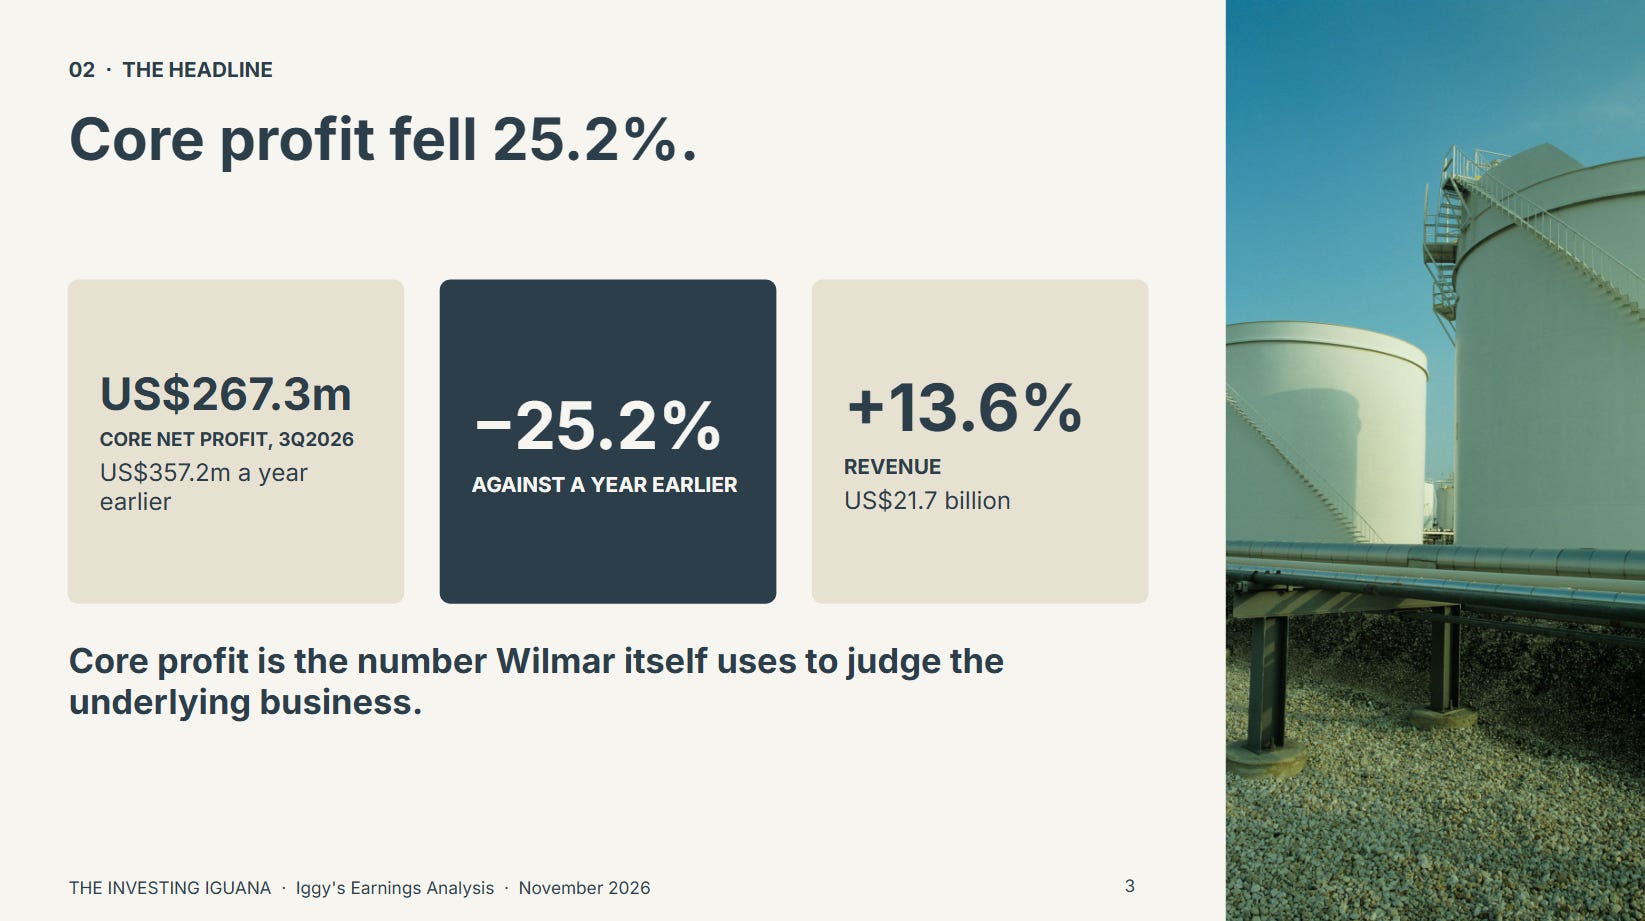
Wilmar International reported its third-quarter results on the evening of 28 October, and the headline reads well. Net profit was US$281.0 million, against a loss of US$347.7 million in the same quarter last year. Revenue rose 13.6% to US$21.7 billion. Both numbers come from Wilmar’s own summary, and the number that Wilmar itself uses to judge its underlying business points the other way: core net profit fell 25.2% to US$267.3 million.
If you own Wilmar, you have seen the price fall about 12% over the past week, and you are owed an account of what the quarter says. If you are looking at it for the first time, a yield near my hurdle and a profit that swung from a loss are two facts that need to be read side by side. In my piece of 19 October I said the thing to check on 28 October was the gap between core and net profit. That gap has reversed, and it is where I start. I am not telling either of you what to do.
What This Piece Does
It sets out the two profit numbers, the year-earlier charge that distorts the comparison, and what Wilmar gives as the reasons for the fall in core profit.
It shows what happened to cash flow, and how the yield tests against my hurdle at today’s lower price.
It shows how Wilmar tests against my other thresholds, which of them I could and could not refresh from a two-page summary, and what I will watch next.
The first part is free. The balance sheet tests, the soft flags, the test-by-test table that sets the label and my closing read are in the paid half.
No view on share price direction. Nothing here is a recommendation.

What This Piece Does
The Two Numbers
Core profit and net profit have traded places
Iggy’s Insights
What Wilmar gives as the reasons
Cash Flow Fell Much Faster Than Profit
Where Wilmar Sits on My Framework
What the Payout Looks Like at SGD 3.14
What the Paid Half Adds
What the Balance Sheet Carries
Net gearing eased to 0.91x, and net debt rose since December
Interest cover could not be refreshed
How much falls due within a year
Why no soft flag is triggered
Where the Tests Land
Iggy’s Insights
Legacy Holders vs. Fresh Capital
What I Would Watch Next
Iggy’s Forensic Read
Sources
The Two Numbers
Net profit rose from a loss, and core profit fell
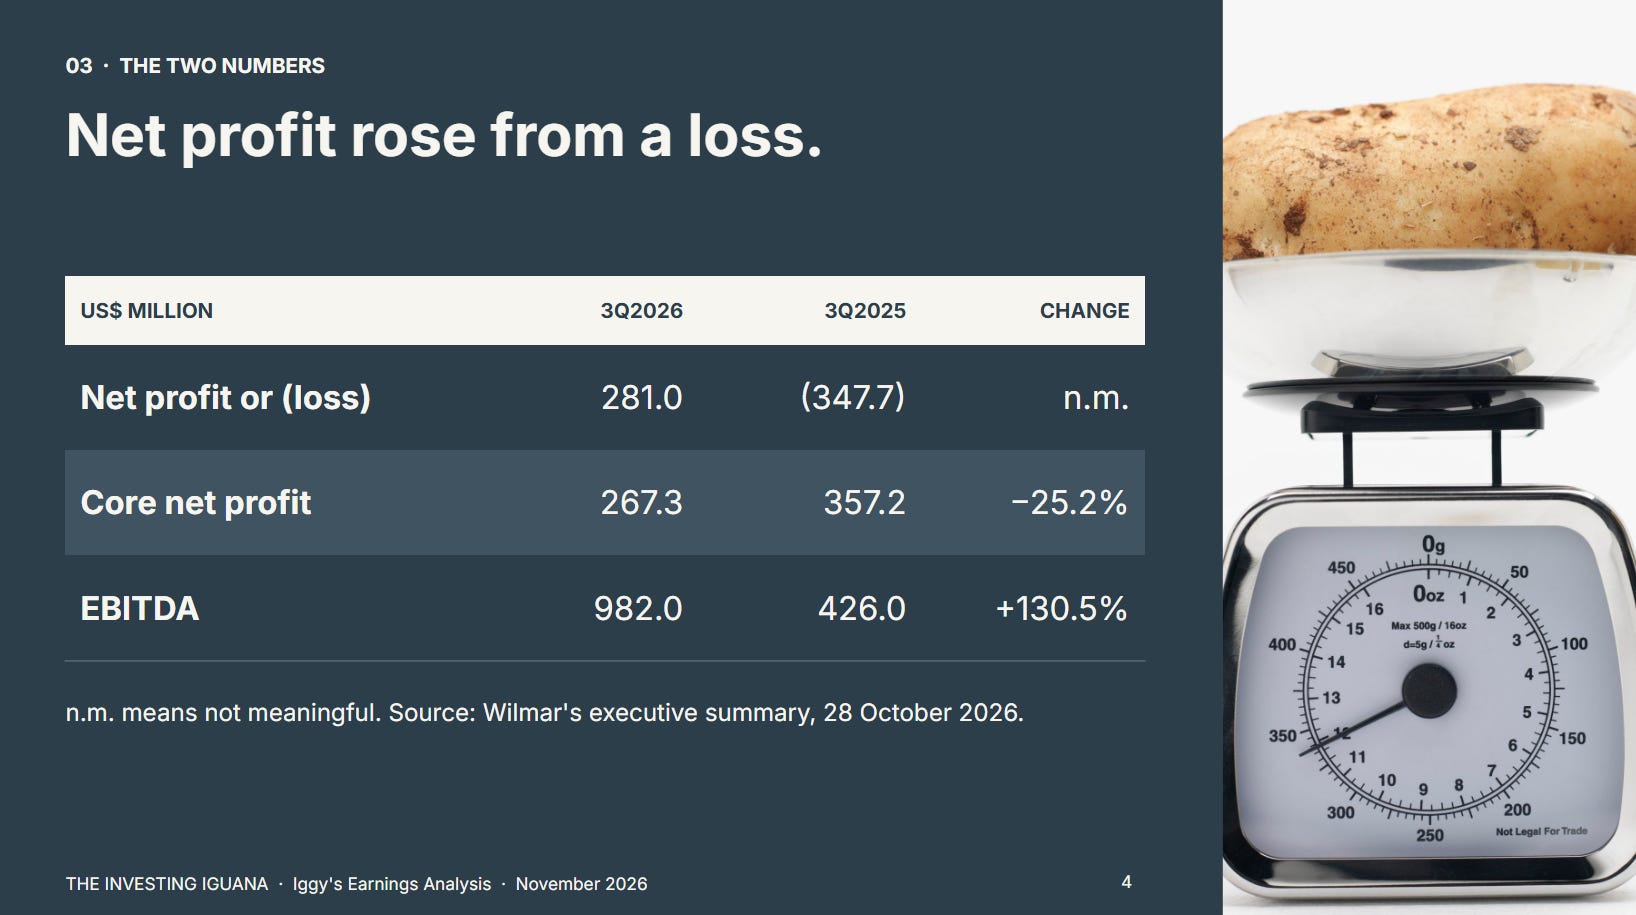
Source: Wilmar International, Executive Summary for the period ended 30 September 2026, 28 October 2026. n.m. means not meaningful.
The loss a year earlier came from a one-off. Wilmar recognised a US$712.3 million compensation expense to the Indonesian government in the third quarter of 2025. Take that out and, in Wilmar’s words, net profit for the quarter declined 22.9% to US$281.0 million from US$364.6 million. So the fair way to read net profit is down about a fifth year on year, and the swing from a loss is a feature of the comparison, not of the quarter.
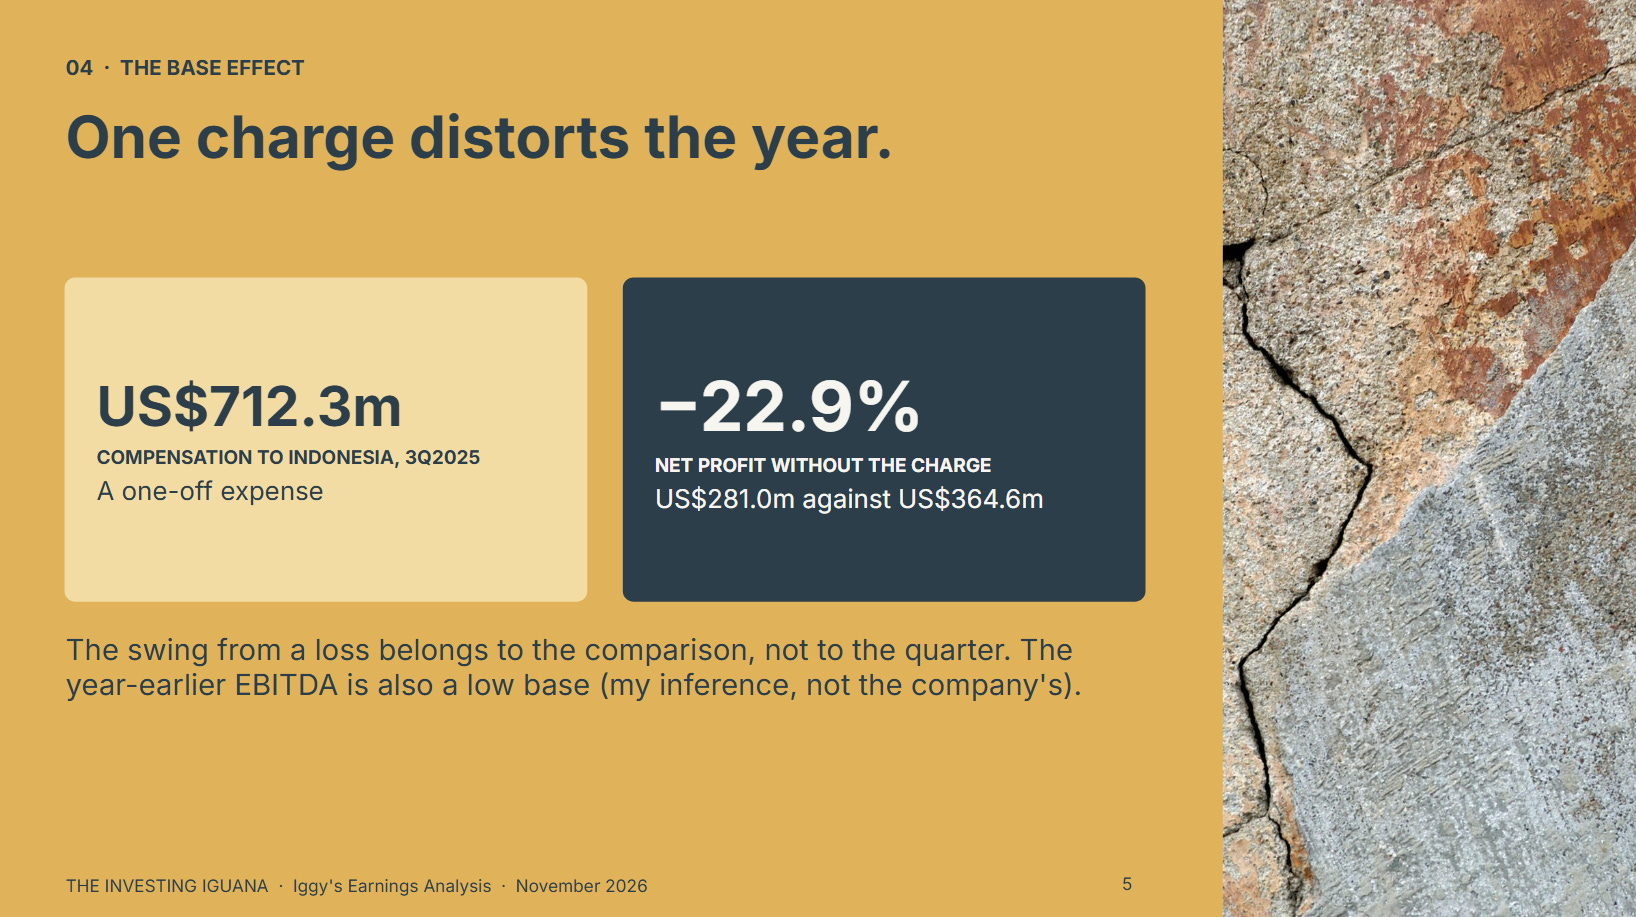
The year-earlier EBITDA of US$426.0 million is also a low base. The summary does not say what is in it, and my inference, not the company’s, is that the same charge sits there, which would explain much of the 130.5% rise.
Core profit and net profit have traded places
In the first half of 2026, core net profit was US$641.5 million and net profit was US$608.9 million, so core profit was above net profit by US$32.6 million (my calculation, from my Ledger). In the third quarter, net profit of US$281.0 million was above core profit of US$267.3 million by US$13.8 million (my calculation). Nine-month core profit less the first-half figure gives US$267.3 million, which matches the third-quarter figure, so the two reports agree.
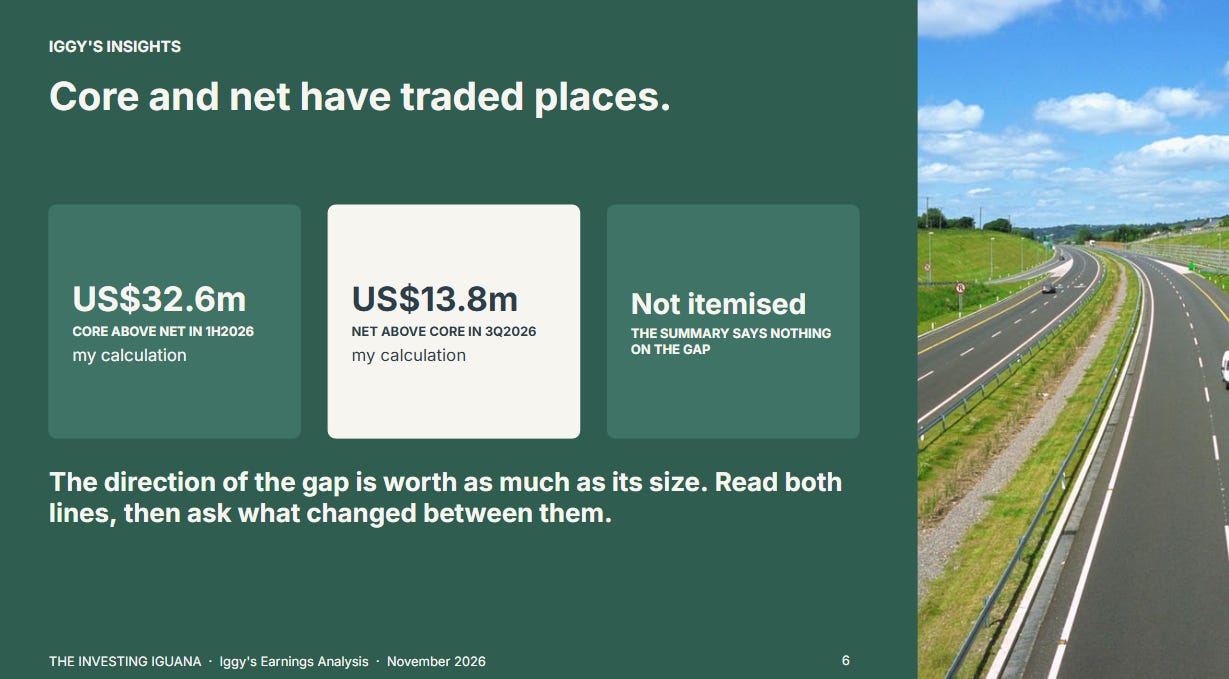
The summary does not itemise the gap this quarter. In the first half, the items were mostly losses: a fair-value loss on investment securities of US$21.3 million, a foreign-exchange loss on intercompany loans of US$8.6 million, and interest on the Sugar Australia acquisition funding of US$12.9 million, partly offset by gains. I do not know what makes up the US$13.8 million this quarter, and I will not guess.
🦖 Iggy’s Insights
When a company reports a core number next to a net number, the direction of the gap is worth as much as its size. In the first half core was above net, which told you one-off items had cost money. This quarter net is above core, which tells you the one-off items gave something back. Neither is wrong, but a reader who looked only at the net line would have seen a rise from a loss and missed the 25.2% fall in the number the company calls underlying. Read both lines, then ask what changed between them.
What Wilmar gives as the reasons
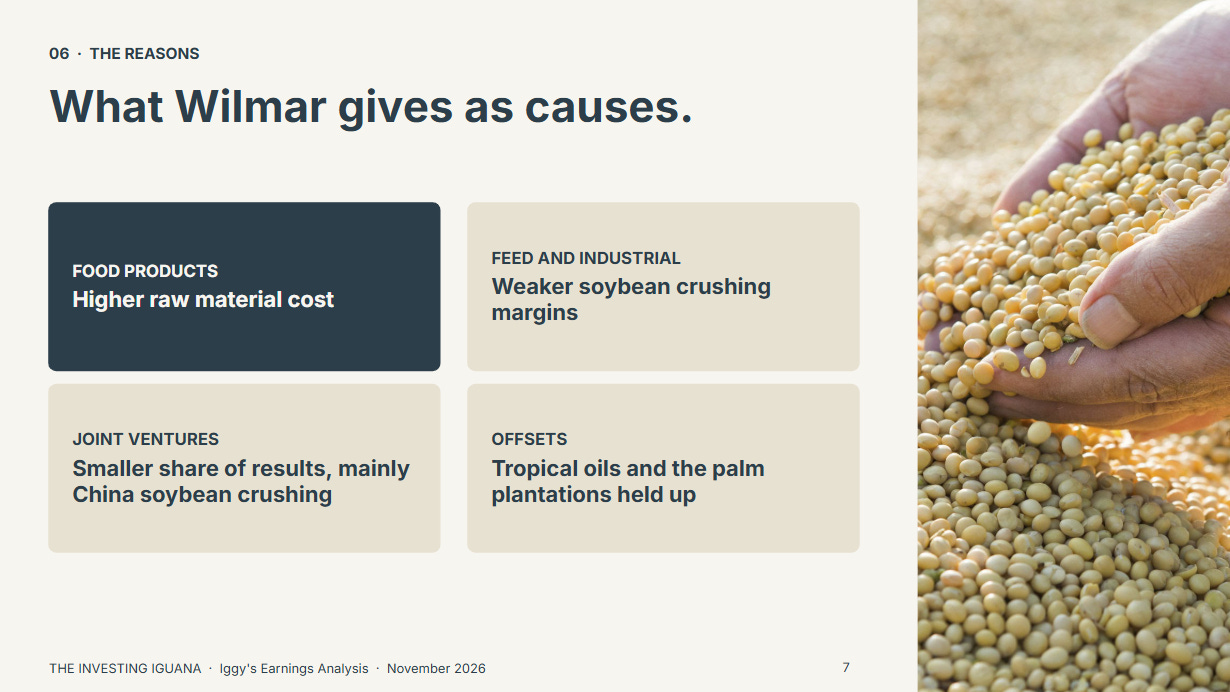
Wilmar names three. The Food Products segment was hit by higher raw material cost. The Feed and Industrial Products segment was hit by weaker soybean crushing margins. The share of results of joint ventures and associates declined, mainly because of weaker performance from the group’s soybean crushing investments in China. Against that, tropical oils performed satisfactorily despite lower sales volume, and the palm plantation business benefited from steady palm oil prices and higher production volume.
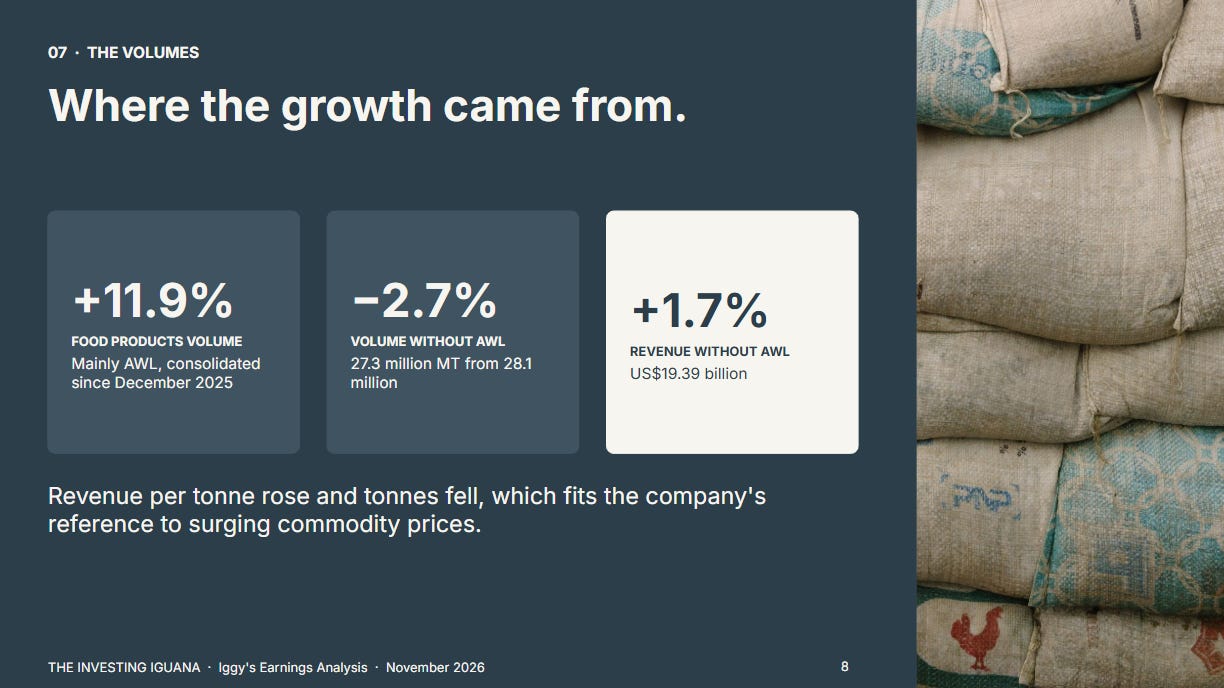
Volumes show where the growth came from.
Source: Wilmar International, Executive Summary, 28 October 2026.
Wilmar says the rise in Food Products volume was mainly due to consolidating AWL Agri Business since December 2025. Excluding AWL, overall volume for the two segments fell 2.7% to 27.3 million MT from 28.1 million MT, even though revenue on that basis grew 1.7% to US$19.39 billion from US$19.07 billion.
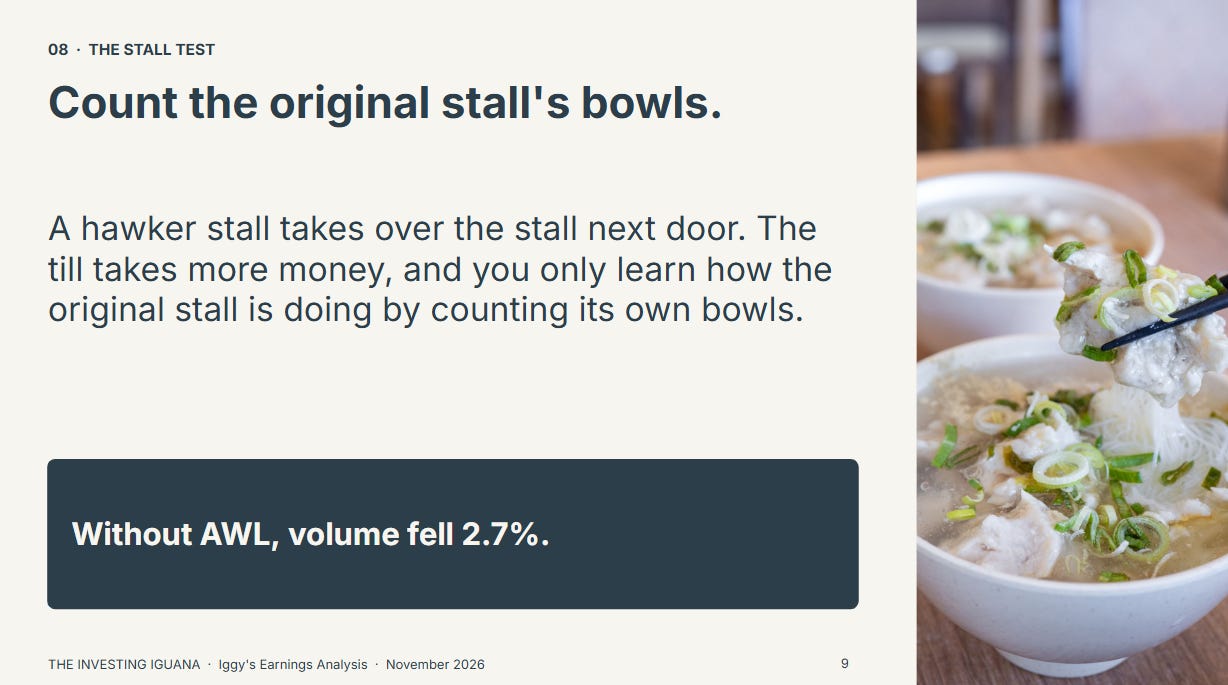
Think of a hawker stall that takes over the stall next door: the till takes in more money, but you only learn how the original stall is doing by counting its own bowls. Revenue per tonne rose while tonnes fell, which fits the company’s reference to surging commodity prices.
Cash Flow Fell Much Faster Than Profit
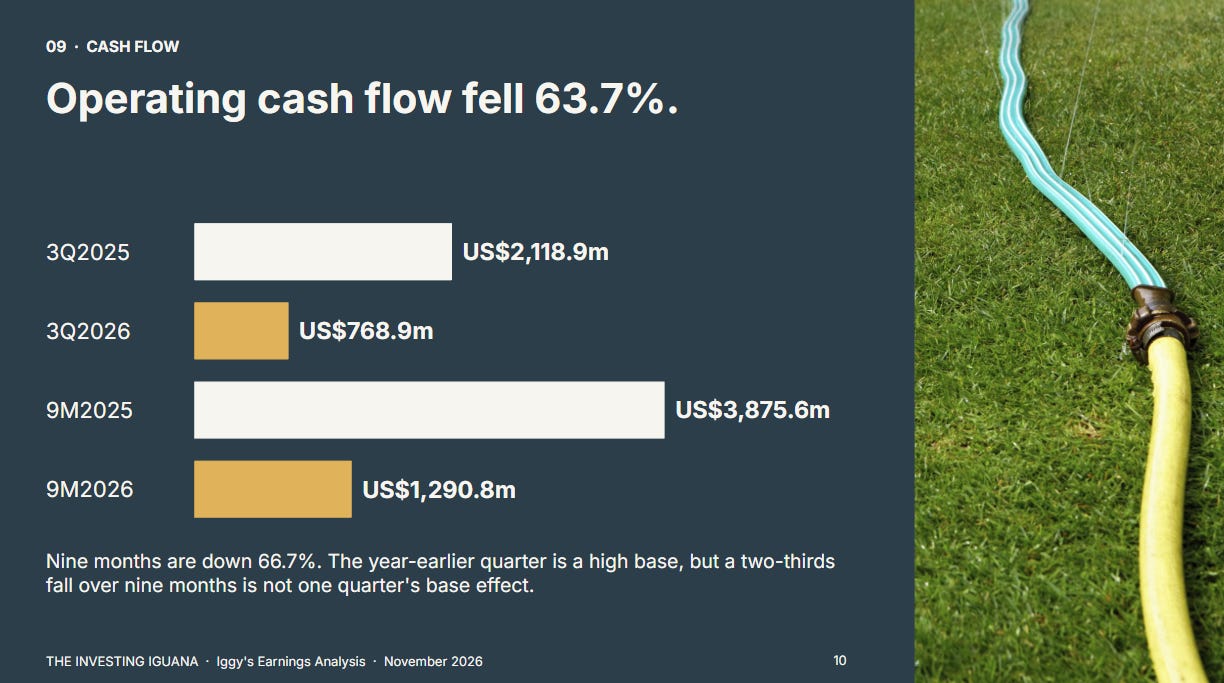
Net cash from operating activities was US$768.9 million in the quarter, against US$2,118.9 million a year earlier, a fall of 63.7%. Over nine months, it was US$1,290.8 million against US$3,875.6 million, down 66.7%.
The line before working-capital changes tells a different story: US$1,142.9 million in the quarter against US$237.2 million, and US$3,231.9 million over nine months against US$2,066.3 million, up 56.4%. Wilmar explains the gap by saying the increase in commodity prices led to higher working-capital requirements. The difference between the two nine-month lines is US$1.94 billion (my calculation), and I cannot tell from the summary how much of it is working capital and how much is other items such as tax paid.
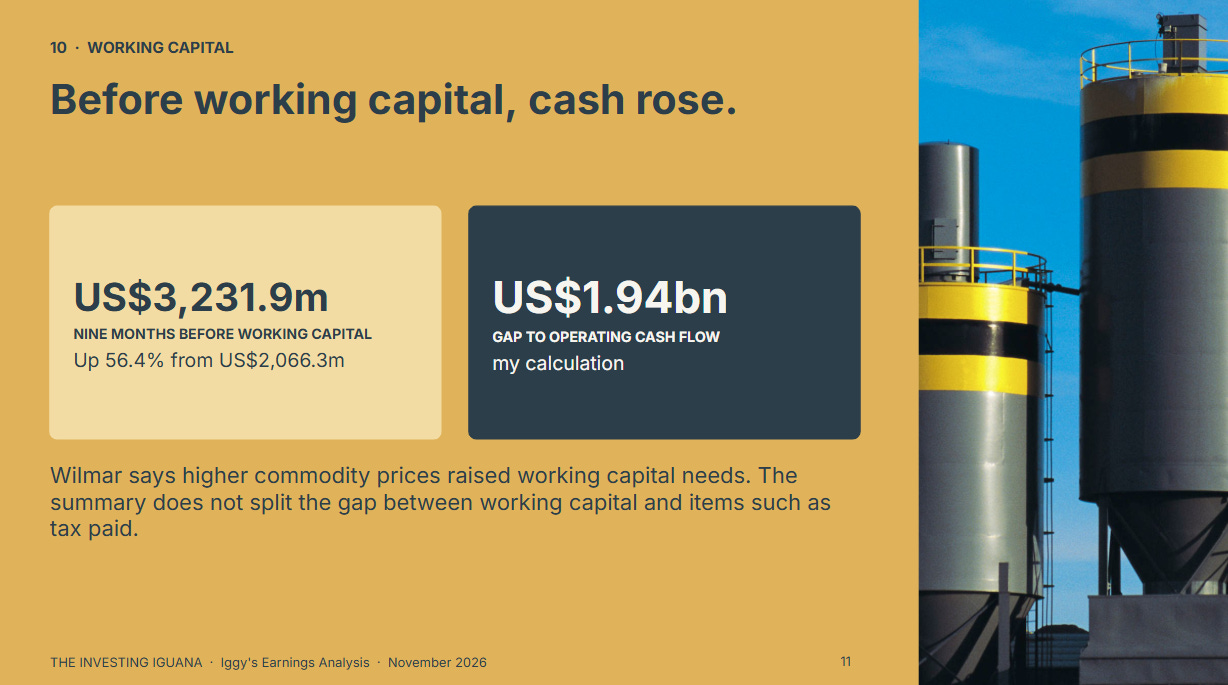
The year-earlier operating cash flow of US$2,118.9 million is a high base, so the fall is steeper than the underlying trend alone. The nine-month fall of two-thirds is not a base effect of one quarter, and it is the fact in this release I would least like to leave out. When a trader’s inventory costs more to carry because prices rose, profit can look healthy while cash goes into stock, and the stock has to be sold at those higher prices later to bring it back.
Where Wilmar Sits on My Framework
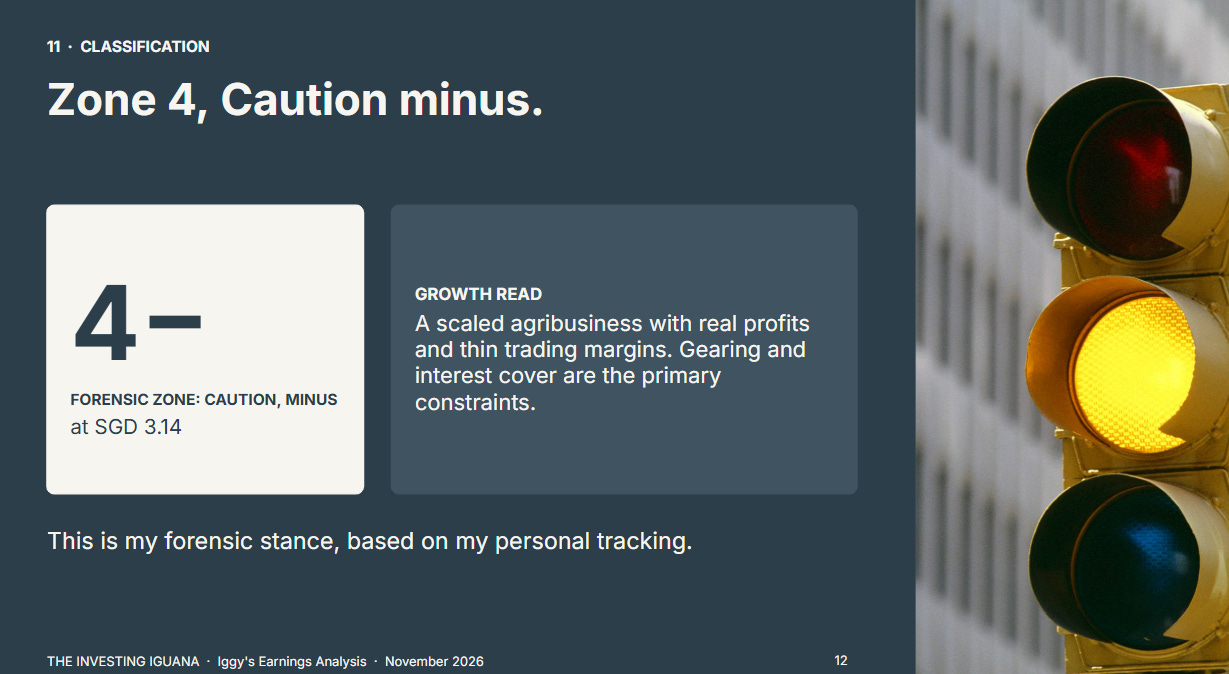
Iggy’s Forensic Zone: Zone 4, Caution - (Growth Read: a scaled agribusiness with real profits and thin trading margins, gearing and interest cover are the primary constraints)
The zone reflects the 28 October summary and my last full set of statements, and will be recalculated against the price on the day I next cite it. Zone 4 describes how my framework is calibrated. It is not an instruction to anyone. The framework is built around a reader drawing income in retirement, so it applies fixed tests to every company.
Someone with many years before drawdown may reasonably sit through the swings it is built to flag, and someone using money beyond what retirement income needs may reasonably hold a company to a different standard. The paid section shows which tests set the label and by how much.
What the Payout Looks Like at SGD 3.14
The price is SGD 3.14 on InvestingPro’s page as captured on 29 October. It is a delayed quote that shows a fall of SGD 0.13, or 3.98%, on the day, so I treat it as an intraday reference and not a close. Adding the day’s fall back gives a previous close of about SGD 3.27 (my calculation). The shares trade between SGD 3.02 and SGD 4.02 over 52 weeks, and the page shows a fall of SGD 0.44, or 12.29%, over the past week. That is a price of about SGD 3.58 a week earlier, my calculation from the page.
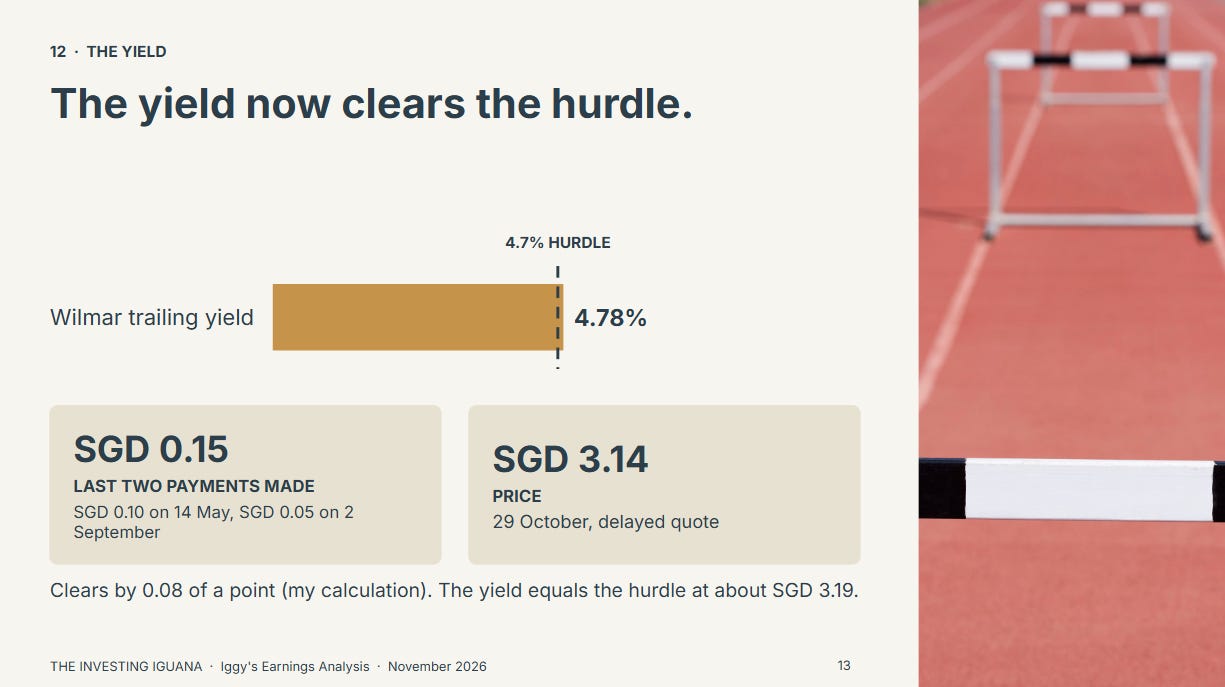
My yield basis is the last two half-year dividends actually paid, which InvestingPro’s dividend history shows as SGD 0.10 paid on 14 May 2026 and SGD 0.05 paid on 2 September 2026, SGD 0.15 in total. At SGD 3.14 that is a yield of 4.78%, my arithmetic. It clears my 3.2% forensic floor, the yield below which a company is Zone 5, by a wide margin and my 4.7% hurdle by about 0.08 of a percentage point. The yield would equal the hurdle at about SGD 3.19, so a rise of about 1.6% in the price takes it back below. In my piece of 19 October the same dividend gave 4.36% at SGD 3.44, a miss of about 0.34 of a point. Nothing about the dividend has changed. The yield now clears because the price fell 8.7% from that level (my calculation).
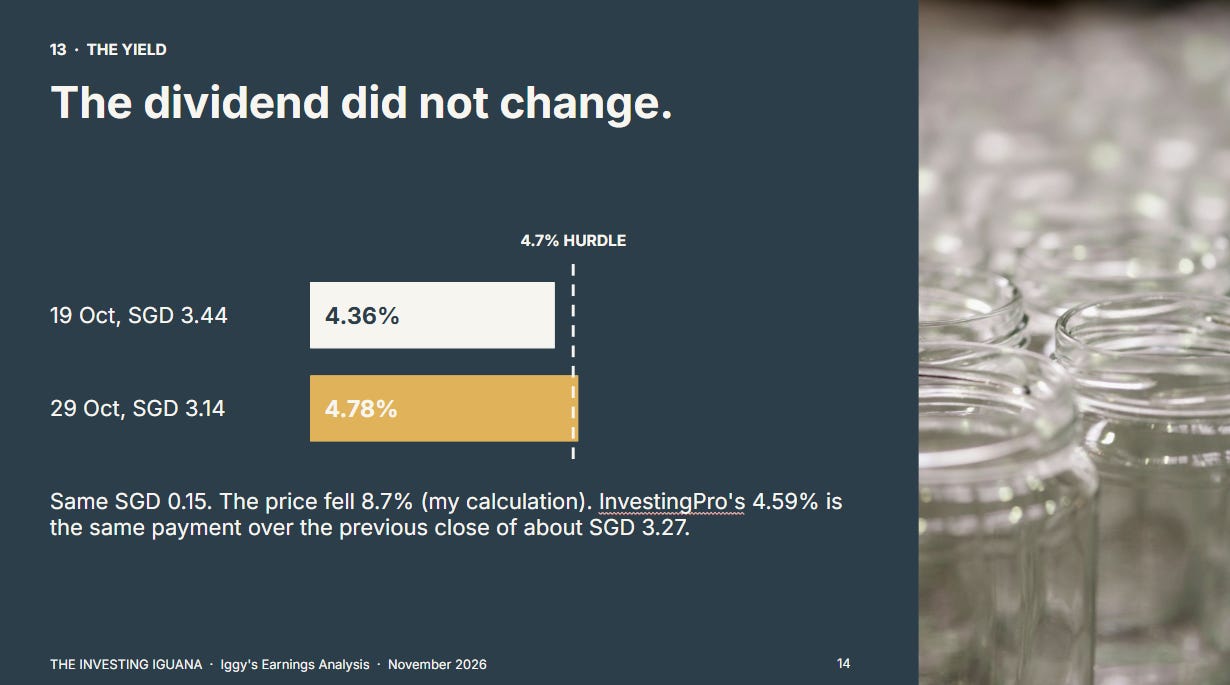
InvestingPro’s dividend page shows a yield of 4.59% on the same SGD 0.15. That is the dividend over the previous close of about SGD 3.27, so the two figures agree and the difference is the price date. A yield that passes by this little on a price that moved 12% in a week is a margin, and I read it as one.
What the Paid Half Adds
The free half has set out the two profit numbers, the cash flow fall, and how the yield tests at the lower price. What it has not shown is why the label stays where it is even though the yield now passes.
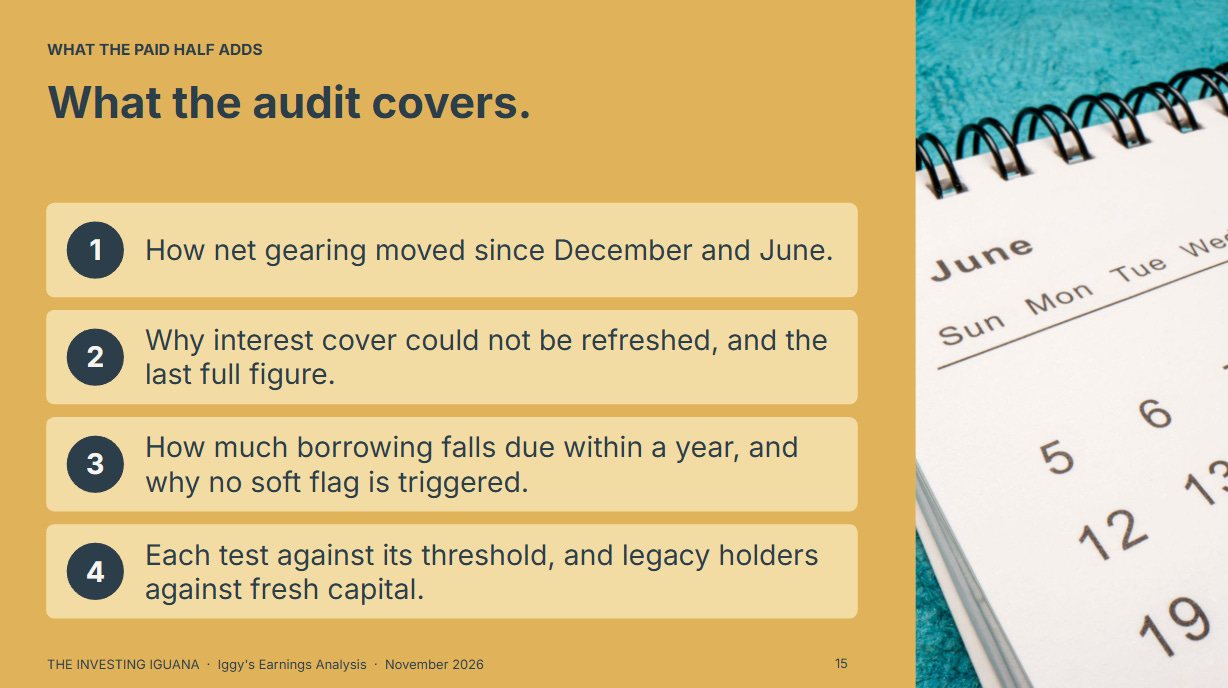
The paid half (below the paywall) sets out how net gearing moved since December and June, why I could not refresh interest cover from a two-page summary and what the last full figure was, how much of Wilmar’s borrowing falls due within a year, and why no soft flag is triggered this quarter even though core profit fell. It then shows each test against its threshold in one table, works through what the payout means for someone who bought at a different price, and sets out what I will watch next.
The Substack Only Plan, US$8 a month, gives you the full written analysis, the portfolio walkthroughs and the analyst cheatsheets.
The YouTube Only Plan, S$5 a month, gives you the full-length Members Edition video.
The YouTube/Substack Combo, S$12 a month, gives you all of it.
🔒 What’s Next
The yield now clears my hurdle by a few hundredths of a point. The balance sheet figures in the next section show why that does not move the label.
