



Keppel’s Core Profit Rose Over 20% and Group Profit Fell 40%. What the Dividend Rests On
The update separates the New Keppel from the assets being sold. Ordinary dividends follow the first, specials follow the sales, and about SGD 940 million of SGD 3.7 billion announced is complete.
Keppel reported its third-quarter and nine-month business update on the morning of 29 October, and it carries two profit numbers that point in opposite directions. The New Keppel, the part of the group the company wants to be judged on, had net profit more than 20% higher over nine months. Keppel’s overall net profit, with the assets being sold and the discontinued operations included, was 40% lower. Both figures are from the company’s own slides, and the company says the first one sets the ordinary dividend.
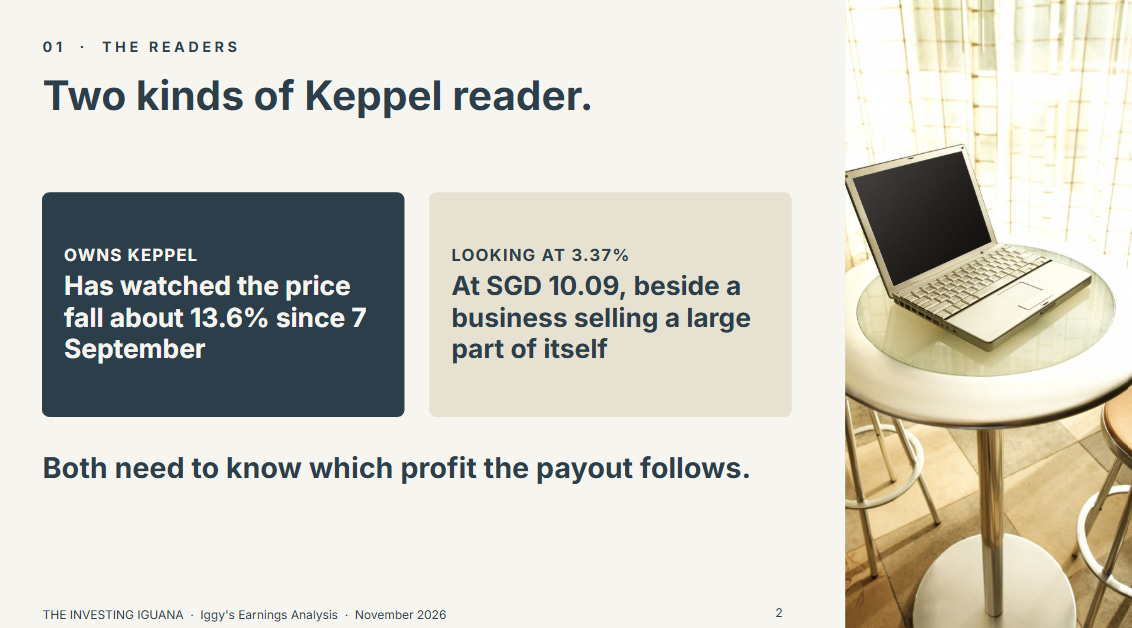
If you own Keppel, the price has fallen about 13.6% since my entry of 7 September, from SGD 11.68 to SGD 10.09 (my calculation), and the question in front of you is which of the two profits your payout follows. If you are looking at it for the first time, a 3.37% ordinary yield sits beside a business that is selling a large part of itself, and the two facts need to be read together. I am not telling either of you what to do.
What This Piece Does
It sets out the two profit numbers, what the company gives as the reason for the gap, and where the growth in the New Keppel came from.
It shows what pays the ordinary dividend and what pays the special dividend, how much of the asset sales is actually complete, and how the yield tests against my floor and hurdle at today’s price.
It shows how Keppel tests against my other thresholds, which of them I could and could not refresh from a business update, and what I will watch next.
The first part is free. The balance sheet tests, the cash flow against the dividend, the soft flags, the test-by-test table that sets the label and my closing read are in the paid half.
No view on share price direction. Nothing here is a recommendation.

What This Piece Does
The Two Profit Numbers
Where the Growth in the New Keppel Came From
Two Dividends, Two Funding Sources
How much of the asset sales is complete
What 10% to 15% could look like
Where Keppel Sits on My Framework
What the Payout Looks Like at SGD 10.09
What the Paid Half Adds
What the Balance Sheet Carries
Leverage on the data I could get
The basis question
Interest cover could not be refreshed
Cash Flow Against the Dividend
Where the Tests Land
Legacy Holders vs. Fresh Capital
What I Would Watch Next
Iggy’s Forensic Read
The Two Profit Numbers
The update gives growth rates, and the two sets point in different directions
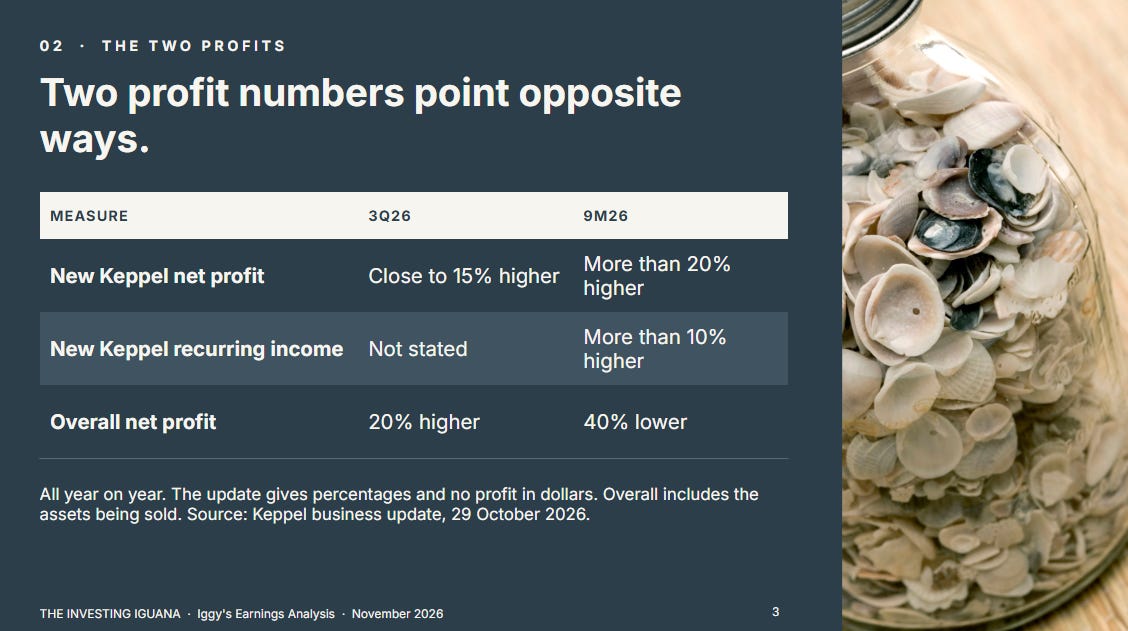
Source: Keppel Ltd, 3Q & 9M 2026 Business Update, 29 October 2026.
The update gives these as percentages and does not state profit in dollars. That limits what I can do. I can show you the direction and the company’s explanation, and I cannot show the ordinary dividend against New Keppel profit in dollars. I will not estimate it.
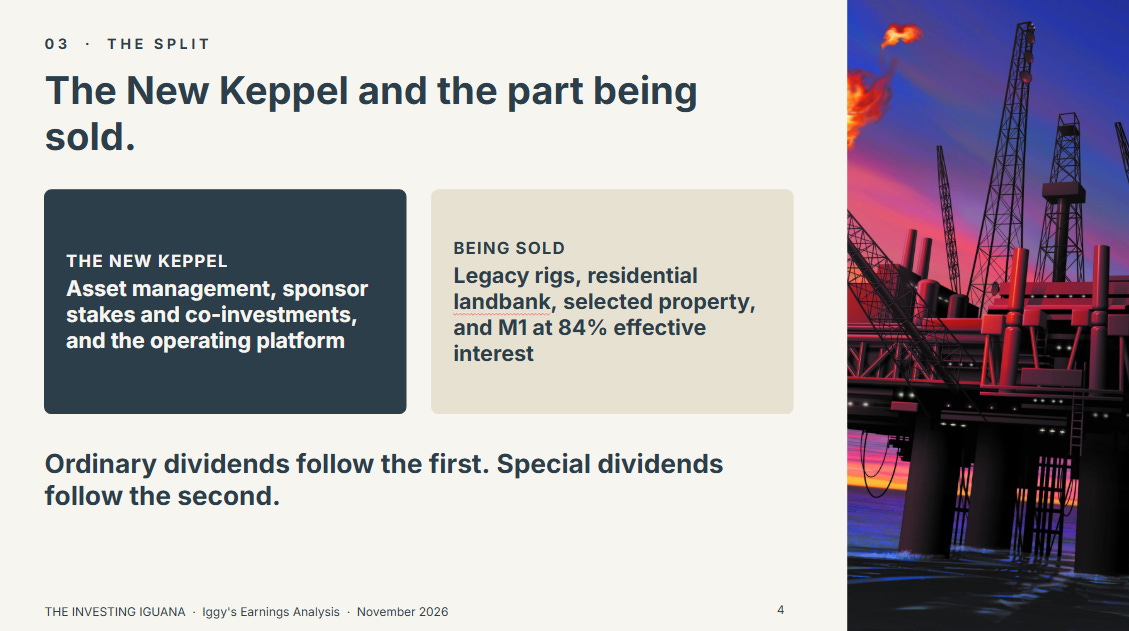
The “New Keppel” excludes the Non-Core Portfolio for Divestment and the Discontinued Operations. The non-core portfolio is mainly the legacy offshore rigs, the residential landbank, selected property developments and investment properties, hospitality and logistics assets, and M1 (at 84% effective interest). The company’s strategy is to be an asset-light global asset manager and operator, and these are the assets it is selling.
What the company says explains the gap
For the nine months, the company says the lower overall profit results from a 4% reduction in the gross asset value of the non-core assets that remained on its books, mainly because of impairments, depreciation, and operating and holding costs. The comparison is the September 2026 gross asset value against the December 2025 value adjusted as if the deals completed during the nine months had completed on 31 December 2025.
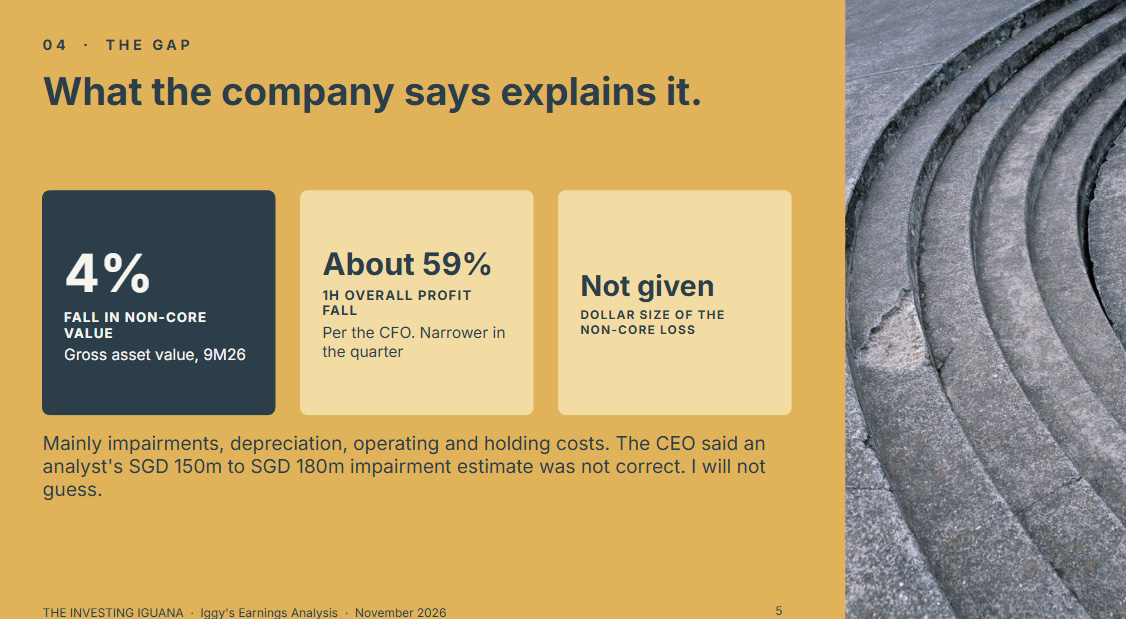
On the call, an analyst took the 20% and 40% figures, straight-lined the second half of 2025, and arrived at a non-core impairment of SGD 150 million to SGD 180 million for the quarter. The chief executive said the arithmetic was not correct and that a business update is directional. The chief financial officer added that the first-half decline in overall profit was about 59% and that the year-on-year reduction had come down in the quarter. The chief executive also said the 4% fall is not all impairment: holding costs and operating losses are in it.
I do not have the dollar size of the non-core loss, and the update does not give it. What the company has done is commit to reporting the change in non-core gross asset value going forward, so the market can follow how much of the unsold pile erodes while it waits for buyers.
🦖 Iggy’s Insights
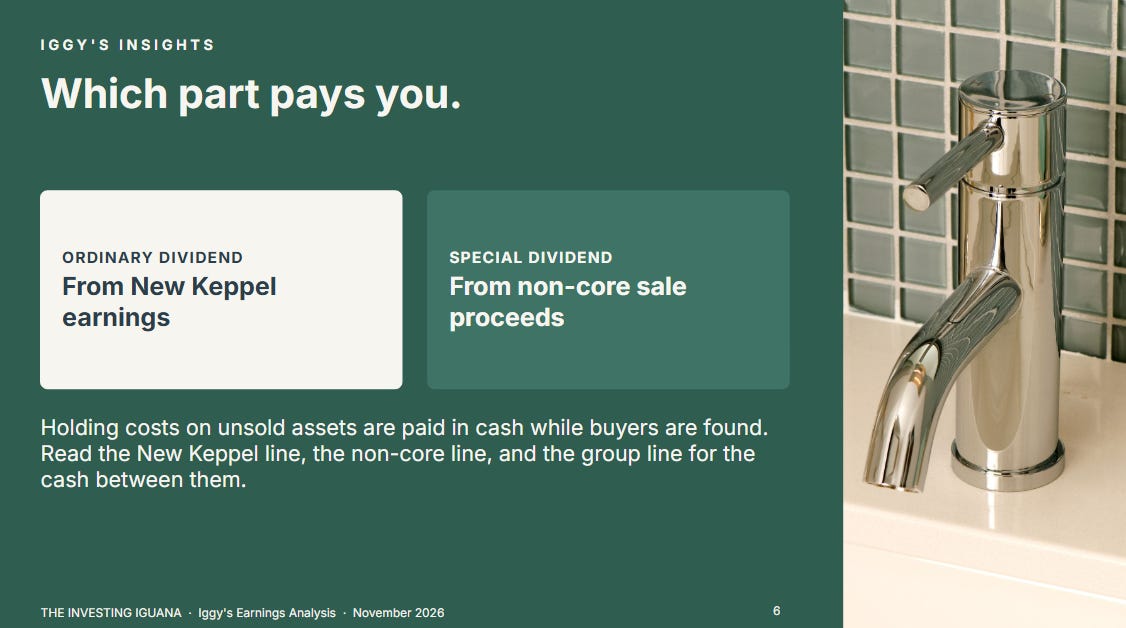
When a company splits itself into a part it wants valued and a part it is selling, the useful question is which part pays you. Keppel has answered it: ordinary dividends from New Keppel earnings, special dividends from the proceeds of non-core sales.
That makes the 4% fall in non-core value a statement about the specials, because every dollar of holding cost or impairment is a dollar that will not come back as sale proceeds. It does not change the ordinary dividend directly, but it does not leave the group’s cash untouched either, since holding costs are paid in cash while the assets wait for buyers. Read the New Keppel line for the ordinary dividend, the non-core line for the special, and the group line for the cash that sits between them.
Where the Growth in the New Keppel Came From
Asset management is the engine of the story, and the figures are good. Fees rose 18% to SGD 354 million over nine months. New funds under management of SGD 19.5 billion were added in the year to date, and the SGD 100 billion target was passed in July. Asset management net profit grew 30% and the earnings from sponsor stakes and co-investments grew 2.9 times, although the update does not give the base for the second figure.
The split of the fee growth is the part I would not skip.
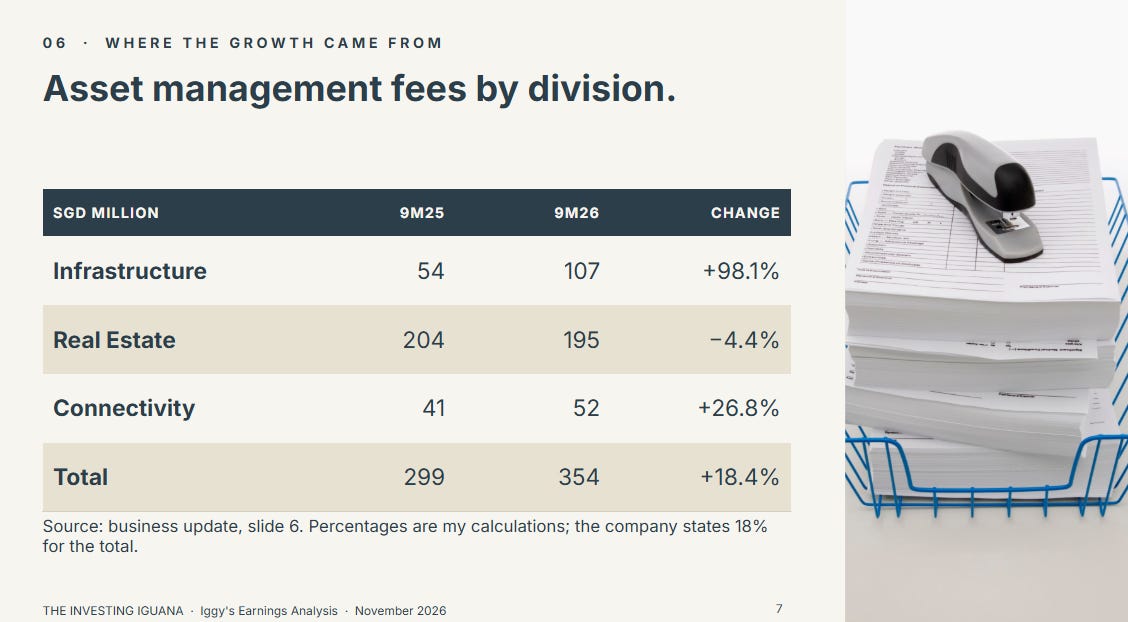
Source: Keppel Ltd, 3Q & 9M 2026 Business Update, slide 6. Percentages are my calculations; the company states 18% for the total.
Nearly all of the increase is in Infrastructure, where fees almost doubled, and Real Estate fees fell.
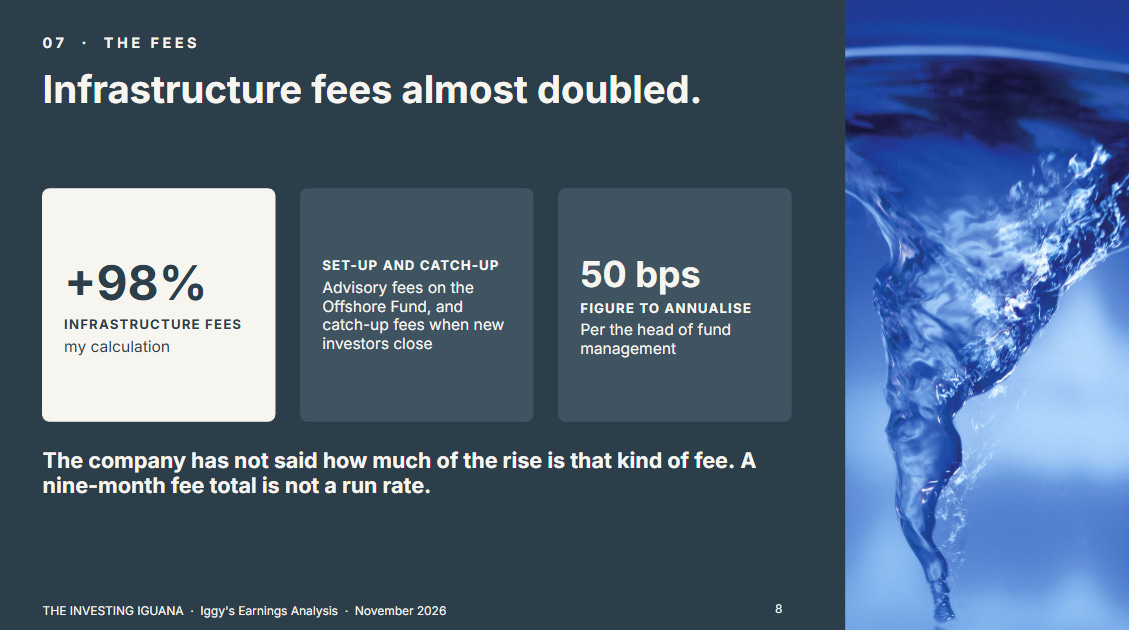
Asked about the jump, the head of fund management said it included advisory fees earned on setting up the Keppel Offshore Fund and catch-up fees that are recorded when new investors close, because fees are charged on committed capital back to the first closing date. The company has not said how much of the SGD 53 million increase in Infrastructure fees is of that kind. An analyst put the third quarter alone at about SGD 154 million, which would be around 60 basis points of funds under management. The head of fund management said 50 basis points is the figure to use when annualising. On the SGD 100 billion passed in July, 50 basis points is SGD 500 million a year (my arithmetic), and funds under management at the end of September were not disclosed. They will be at the year-end.
So the growth is real, and the company itself points to some fee income that comes with fund launches and closings and does not repeat every quarter. That does not mean the trend is weak. It means a nine-month fee total is not a run rate.
Two Dividends, Two Funding Sources
Think of a kopitiam owner who runs a busy drinks stall and is closing the old stall at the back. The takings from the drinks stall pay the monthly allowance to the family. The proceeds from selling the back stall’s equipment pay the occasional red packet. Until the equipment sells, the back stall still costs rent.
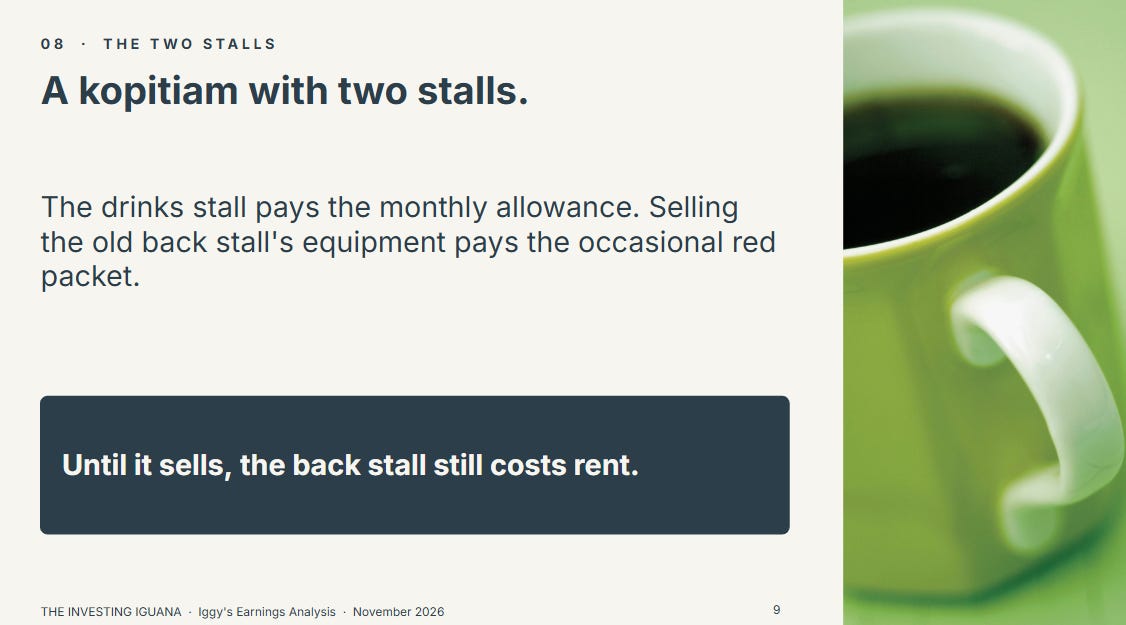
That is the structure Keppel described. The chief executive said the ordinary dividends will be determined by earnings from the New Keppel, and the company aims to pay special dividends of 10% to 15% of the realised proceeds from non-core asset monetisation.
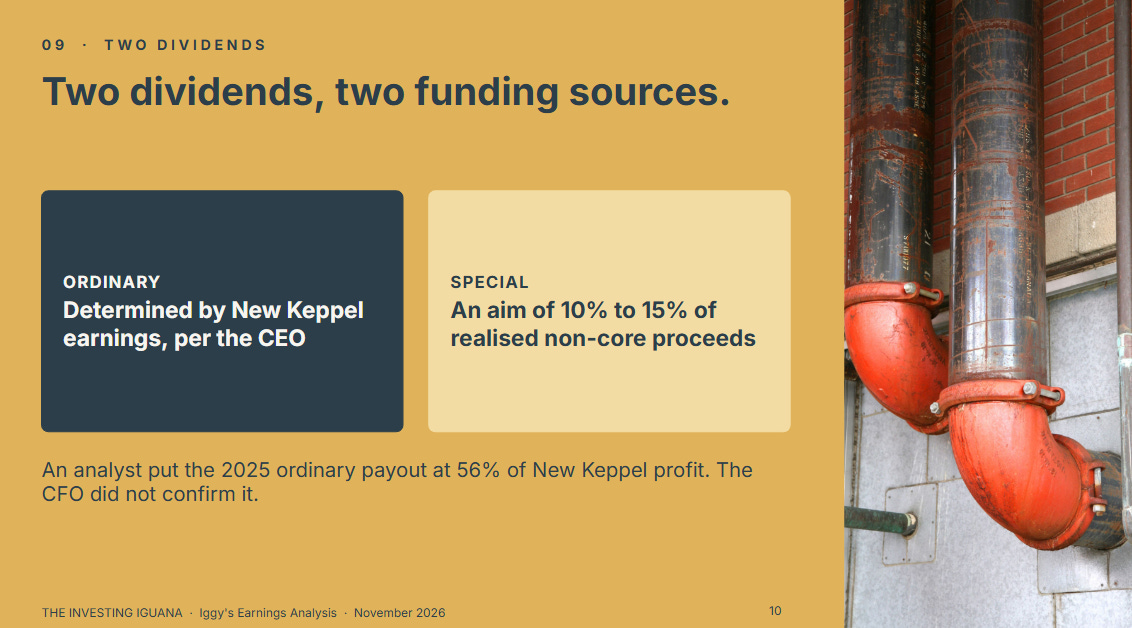
An analyst on the call put the 2025 ordinary dividend at a 56% payout of New Keppel profit. The chief financial officer did not confirm that number. He said the payout on ordinary dividends had been consistent over the last couple of years and that the dividends are based on New Keppel earnings. I treat 56% as an analyst’s figure.
How much of the asset sales is complete
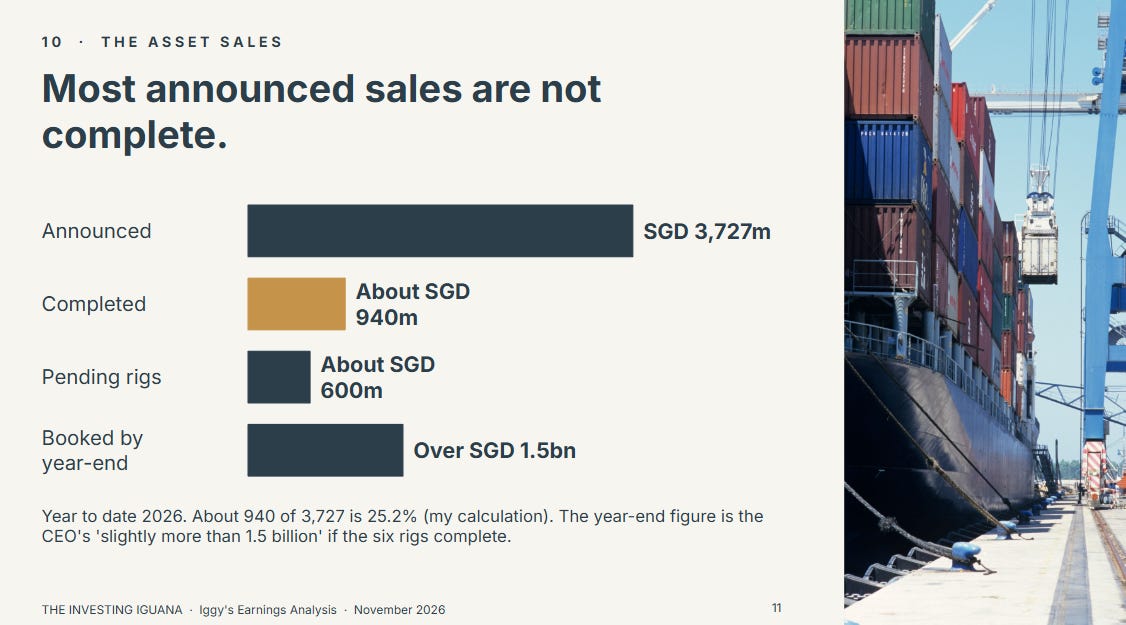
Source: Keppel Ltd, 3Q & 9M 2026 Business Update, slides 2, 4 and 13; call transcript.
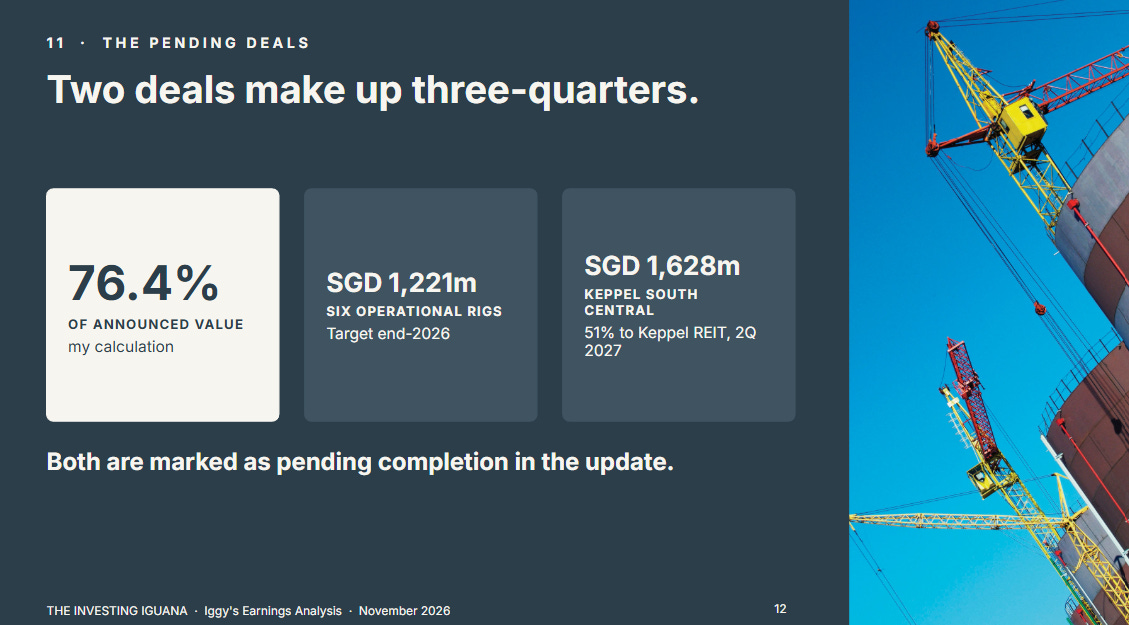
About 940 million of 3,727 million is 25.2% (my calculation). Two deals account for 2,849 million of the 3,727 million announced, which is 76.4%: the six operational rigs at 1,221 million and Keppel South Central at 1,628 million, both marked in the update as pending completion. Keppel South Central, a 51% stake sold to Keppel REIT, completes in the second quarter of 2027, according to the chief executive.
Three details change how I read these numbers.
First, only half of the value of the six rigs and half of Keppel South Central is booked on completion, because the company keeps the other half. The chief executive said a special dividend still applies to the retained half when it is monetised later. That supports the specials over a longer period, and it also means the half that is booked now is not the whole of the 3.7 billion.
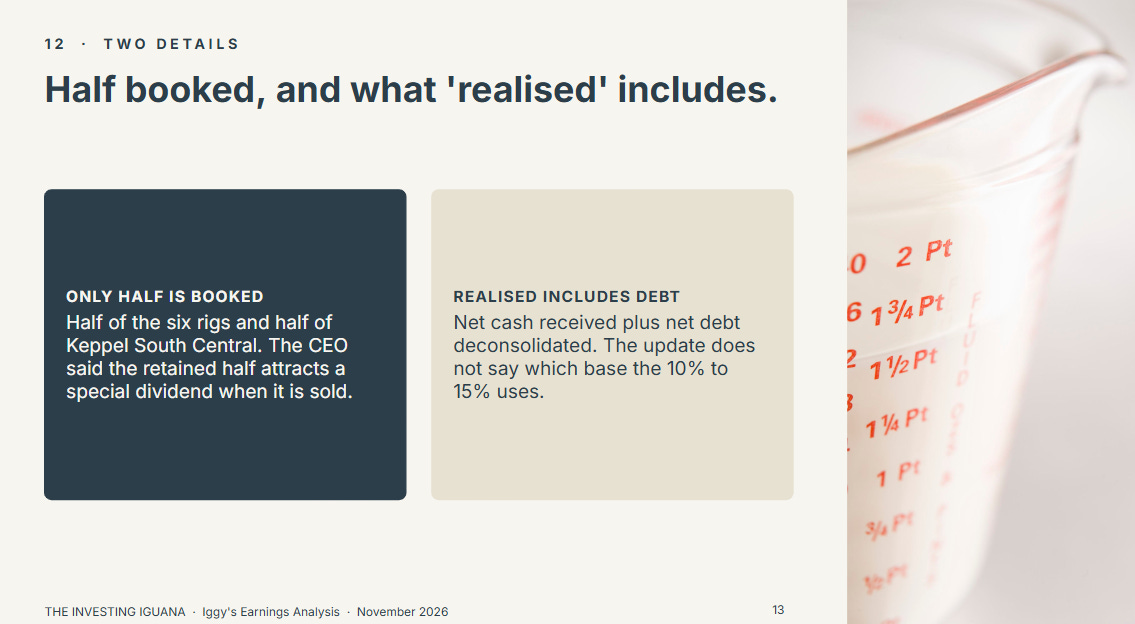
Second, the company’s glossary defines “completed and realised” as the net cash consideration received plus the net debt that is deconsolidated, and “announced” as the gross consideration plus the net debt deconsolidated. So the 940 million is not all cash, and the 940 million and the 3.7 billion are not on an identical basis. The update does not say whether the 10% to 15% applies to that figure or to cash received.
Third, the company’s goal is to monetise all the non-core assets before 2030, which on the chief executive’s arithmetic means about SGD 2 billion to SGD 3 billion a year. Asked how it would keep that pace in 2027 when the large items have mostly been sold, he said there is a full year ahead, that further monetisation is expected, and he did not name further assets.
What 10% to 15% could look like
This is arithmetic on the company’s stated aim, not a forecast, and the base is the open question. The last special dividend, completed on 8 May 2026, was 2 cents a share in cash plus one Keppel REIT unit for every nine shares, and cost SGD 213.4 million in total according to Keppel’s notice of that date. The two illustrations below use the share count of about 1,793 million implied by InvestingPro’s market value at SGD 10.09.
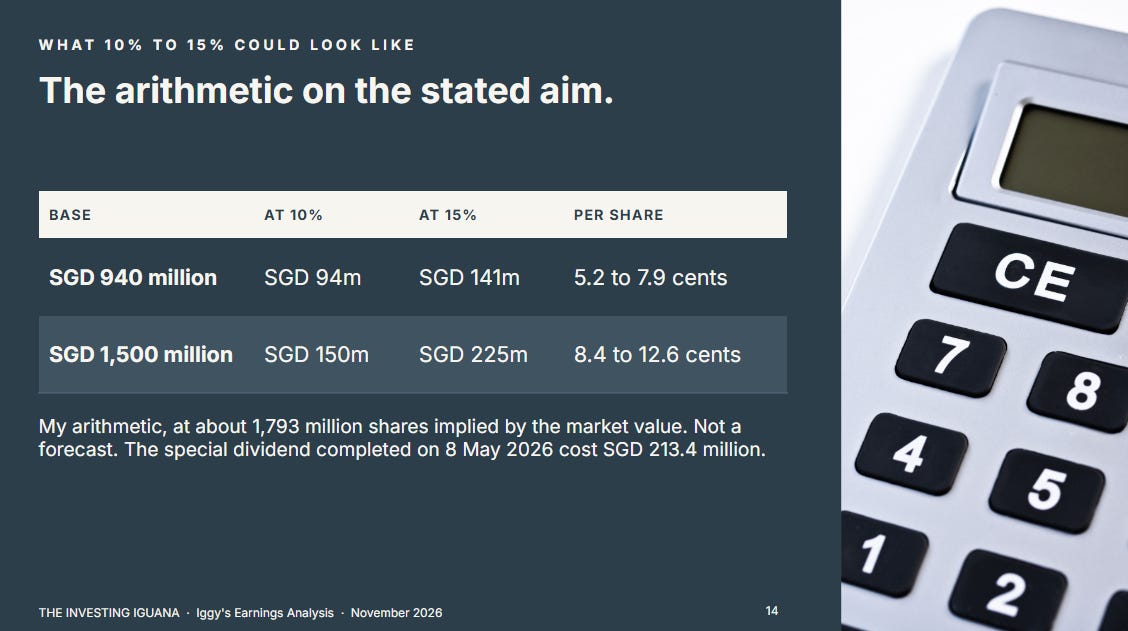
These are my calculations. If the percentage applies to a figure that includes deconsolidated debt, the cash that backs it is smaller. If the retained halves are monetised later, further specials follow. Either way the special dividend depends on sales that have to complete, which is why I keep it out of my yield.
Where Keppel Sits on My Framework
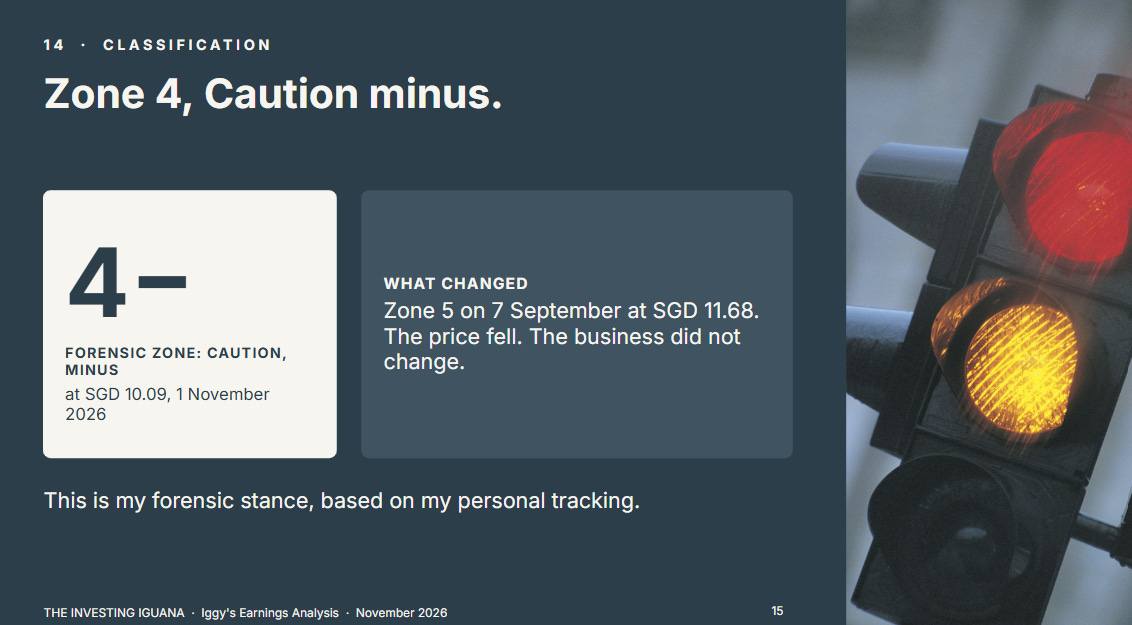
Iggy’s Forensic Zone: Zone 4, Caution - (Growth Read: a Singapore conglomerate part-way through becoming an asset manager and operator, with the ordinary dividend resting on the part that is growing, leverage that cannot yet be split between the part that stays and the part being sold, and a special dividend that depends on sales that are mostly not yet complete)
The zone reflects the 29 October update, InvestingPro’s 30 June balance sheet figures and the price as at 1 November 2026, and will be recalculated against the price on the day I next cite it. It was Zone 5 in my entry of 7 September, and it has moved because the price fell from SGD 11.68 to SGD 10.09, which lifted the yield above my floor.
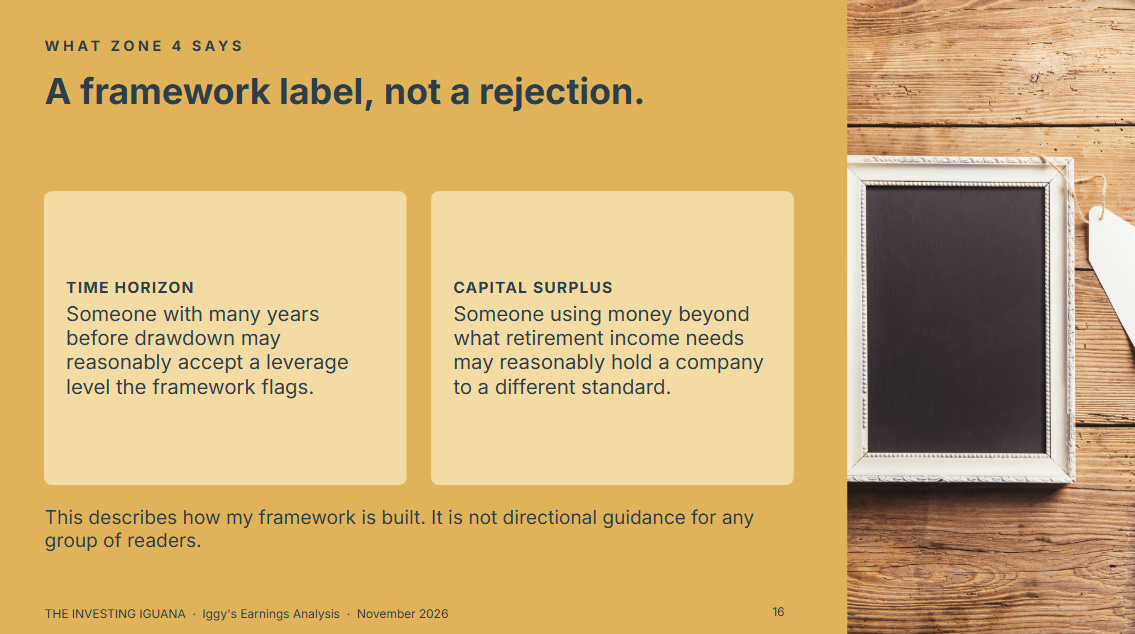
The business did not change in that time. Zone 4 describes how my framework is calibrated and is not an instruction to anyone. The framework is built around a reader drawing income in retirement, so it applies fixed tests to every company. A reader with many years before drawdown may accept a leverage level the framework flags, and a reader using money beyond what retirement income needs may reasonably hold a company to a different standard. The paid section shows which tests set the label and by how much.
What the Payout Looks Like at SGD 10.09
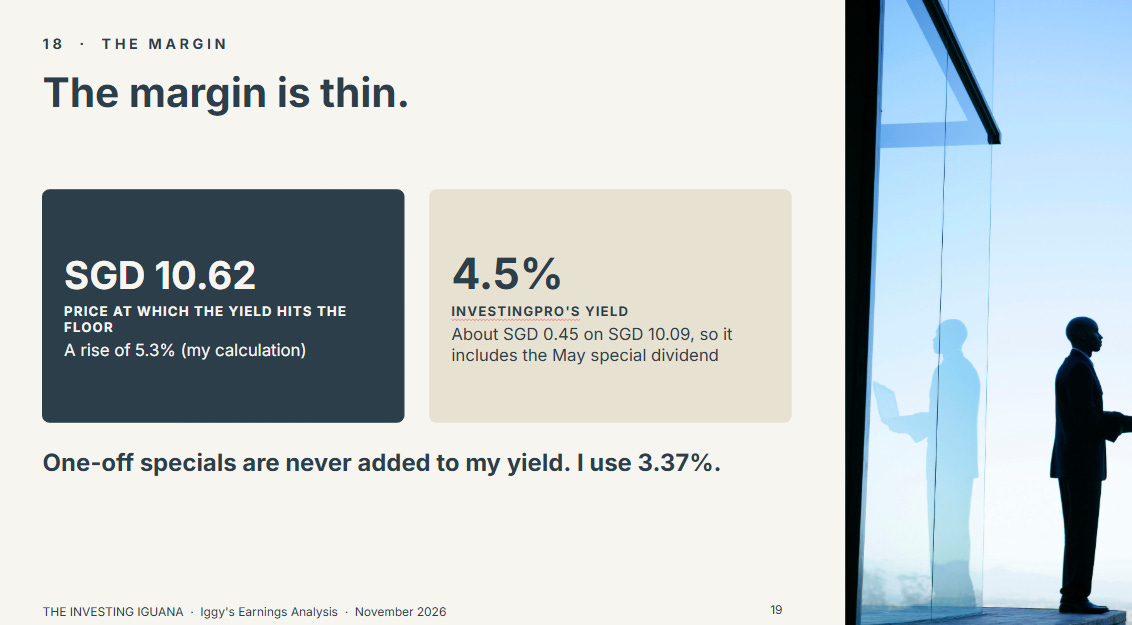
The price is SGD 10.09 on InvestingPro’s page as captured on 1 November 2026, with the market shown as closed. It is a fall of SGD 0.15, or 1.46%, on the day, so the previous close was SGD 10.24 (my calculation). The page does not date the close, and I take it to be Friday 30 October. The shares have traded between SGD 9.81 and SGD 13.25 over 52 weeks, so SGD 10.09 is 2.9% above the low and 23.8% below the high (my calculations).

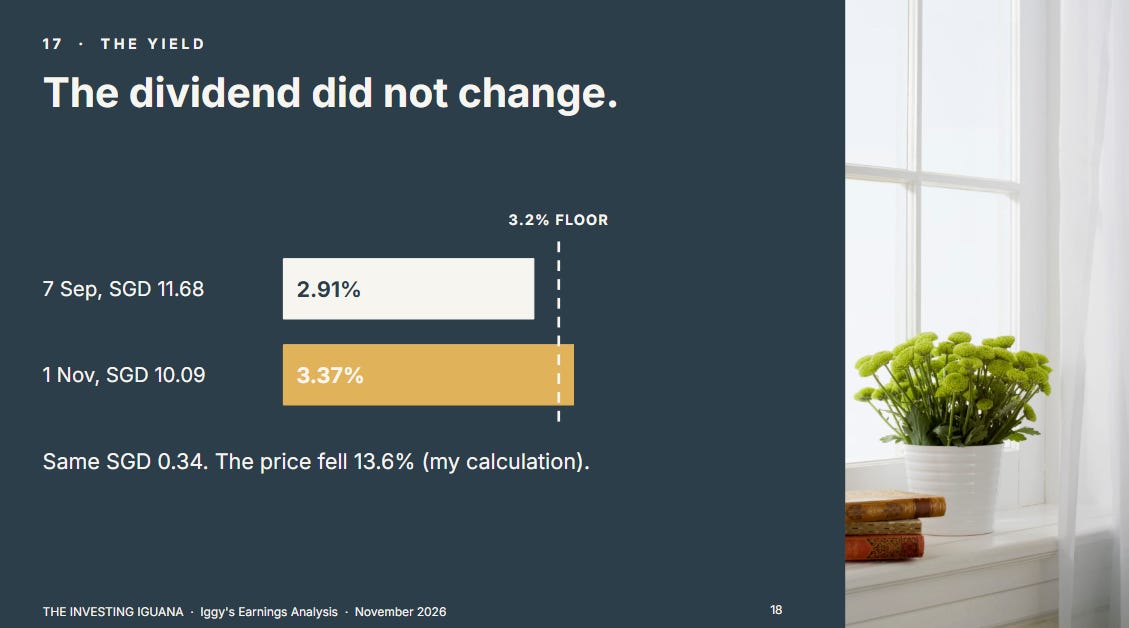
My yield basis is the last two ordinary payments actually made: SGD 0.19, the final dividend for 2025, paid on 8 May 2026, and SGD 0.15, the interim dividend for 2026, paid on 21 August 2026, SGD 0.34 in total. At SGD 10.09 that is 3.37% (my arithmetic).
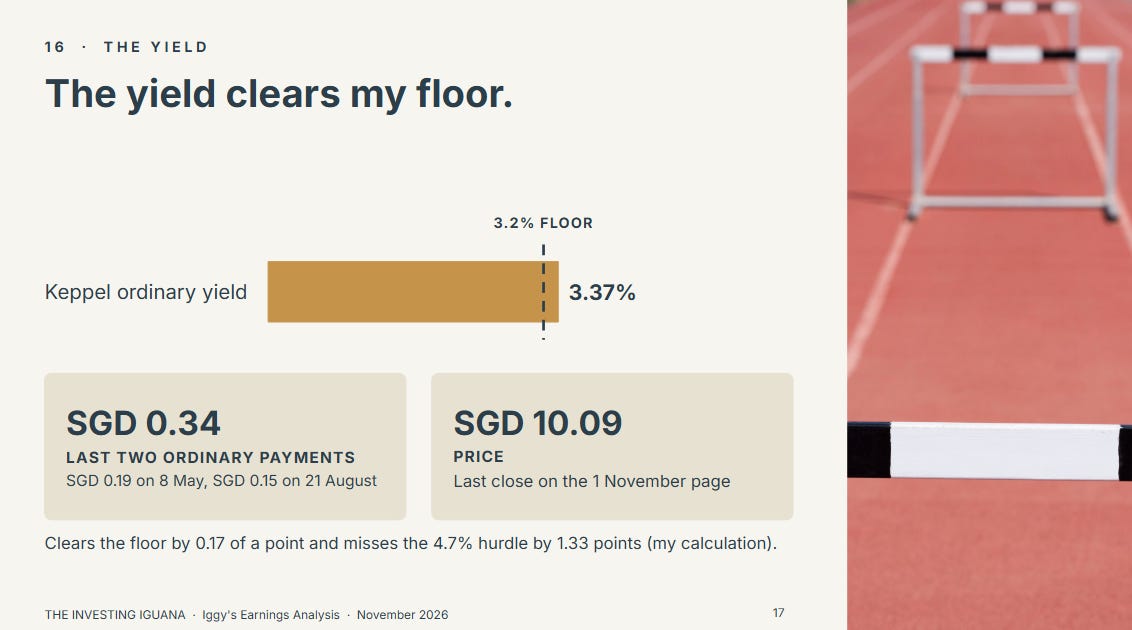
It clears my 3.2% forensic floor, the yield below which a company is Zone 5, by 0.17 of a percentage point. It misses my 4.7% hurdle by 1.33 points. The yield equals the floor at about SGD 10.62, so a rise of 5.3% in the price takes it back under. On 7 September, at SGD 11.68, the same SGD 0.34 gave 2.91%. Nothing about the ordinary dividend changed. The yield rose because the price fell 13.6%.
InvestingPro shows a yield of 4.5%. I cannot reproduce that from the ordinary payments. It matches about SGD 0.45 over SGD 10.09, which is the SGD 0.34 plus a special dividend of roughly SGD 0.11, so I read it as including the May special dividend. My standing rule is that one-off specials are never added to the governing yield, and the May special was paid from asset monetisation proceeds. I use 3.37%.
A yield that clears the floor by 0.17 of a point on a price that has moved 13.6% in under two months is a margin, and I read it as one.
What the Paid Half Adds
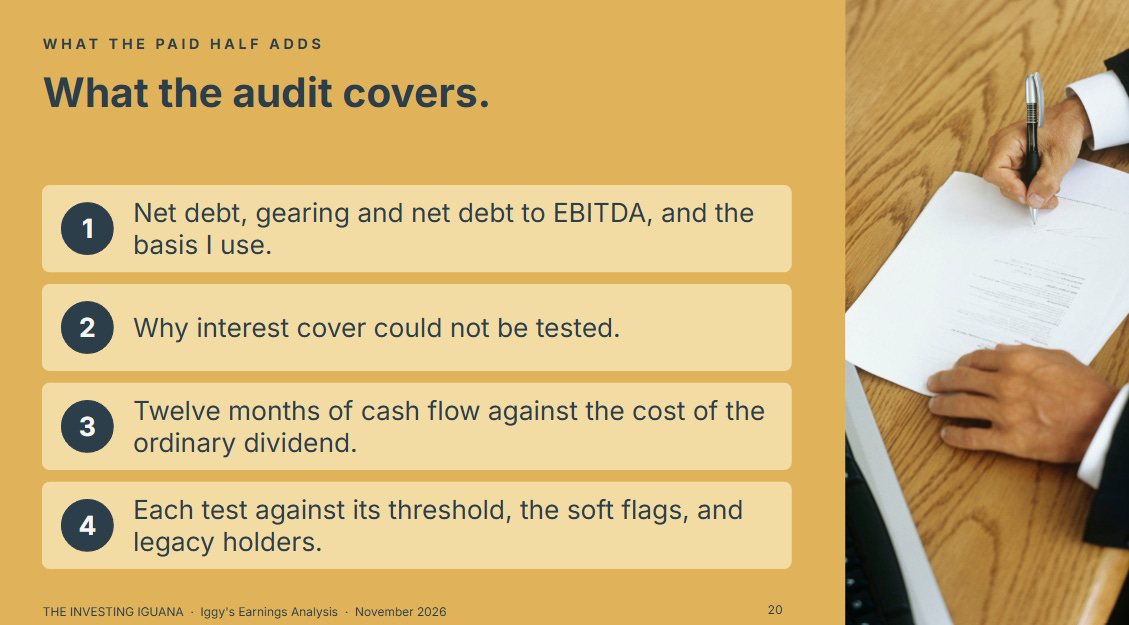
The free half has set out the two profit numbers, where the fee growth came from, what funds each dividend, and how the yield tests at today’s price. What it has not shown is what the balance sheet looks like behind the ordinary dividend, and why the label stays where it is even though the yield now clears the floor. The paid half sets out net debt, gearing and net debt to EBITDA on the data I could get and the basis I use, why I could not test interest cover, how the last twelve months of cash flow compare with the cost of the ordinary dividend, why profit covers that dividend less than once on the vendor figures, what the soft flags are and why one of them is marginal, and each test against its threshold in one table. It then works through what the payout means for someone who bought at a different price and sets out what I will watch next.
The Substack Only Plan, US$8 a month, gives you the full written analysis, the portfolio walkthroughs and the analyst cheatsheets.
The YouTube Only Plan, S$5 a month, gives you the full-length Members Edition video.
The YouTube/Substack Combo, S$12 a month, gives you all of it.
🔒 What’s Next
The yield clears my floor by 0.17 of a point. The balance sheet figures in the next section show why that does not lift the label.
