



The STI Fell 5.24% in October. Three Questions Before You Compare Its 3.39% Yield With a T-bill 🦖
Same dividends, lower price. October lifted the yield without raising a cent of income. What it is being compared with, and what the extra yield cost on SGD 10,000.
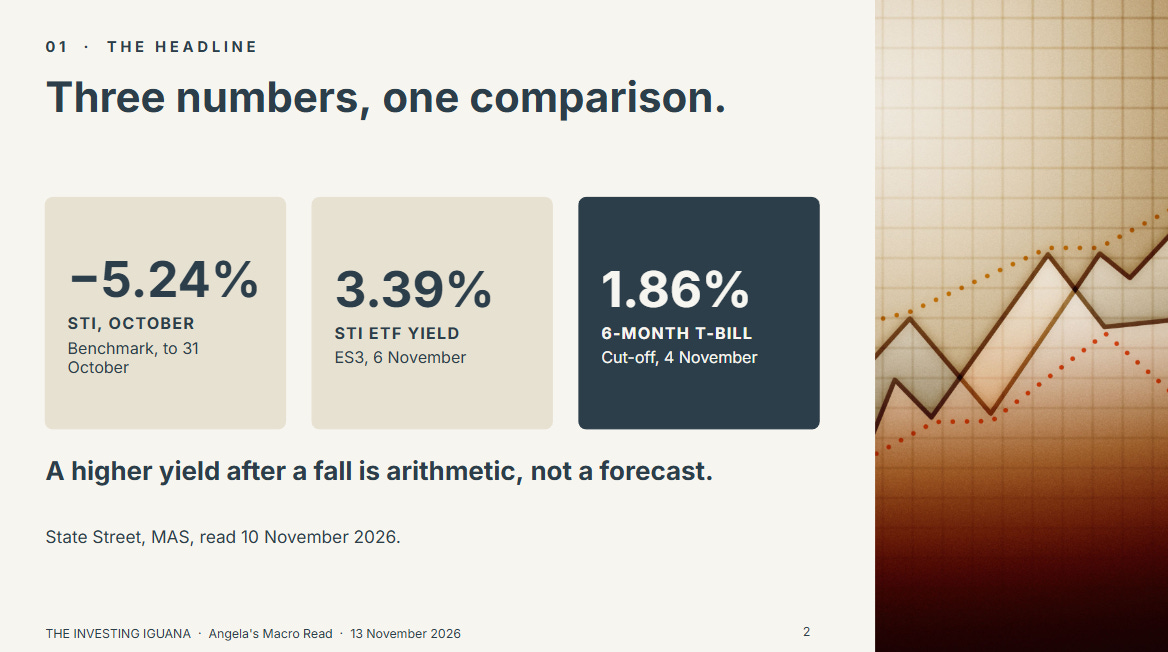
Suppose SGD 10,000 sat in an STI fund at the start of October. By the end of the month it would have been worth about SGD 9,476. Six months in a government T-bill pays about SGD 93 on the same amount. The October fall was more than five times that, and it took four weeks.
I am not setting that out to make anyone nervous. I am setting it out because it leads to a question I keep hearing: the fund now yields more than it did, so is it better value than a T-bill? The yield did go up. What I want to check is what that yield is made of, and what it is being compared with.
The Straits Times Index fell 5.24% in October, according to State Street’s factsheet, and the SPDR STI ETF (ES3) now shows a distribution yield of 3.39% as at 6 November, up from 3.27% a week earlier. The 6-month T-bill cleared at a cut-off yield of 1.86% at the 4 November auction, down from 1.95% on 22 October. CPF pays 2.5% on the Ordinary Account and 4% on the Special, MediSave and Retirement Accounts.
Beansprout asked on 5 November whether investors should turn defensive after October. I am not answering that. It is a call on the market, and I do not make those. This piece asks something narrower that can be checked against the numbers: when a fall lifts a dividend yield, what has actually changed, and how does that yield compare with what the safe options pay?
What This Piece Does
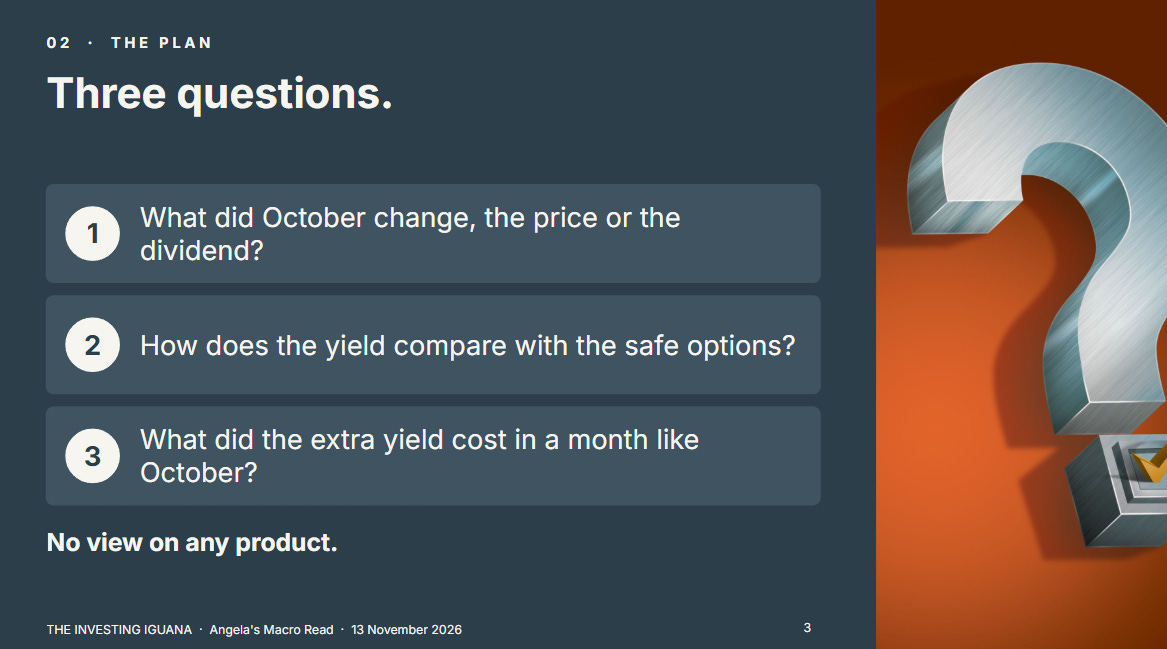
It works out what moved in October, the price or the dividend, using the fund’s own figures.
It sets the STI yield beside a T-bill, the Singapore Savings Bond and CPF, and says what each one asks you to give up.
It puts the cost of the extra yield in dollars on SGD 10,000, using my own arithmetic.
The first two parts are free to read. The third, what a month like October costs against the extra yield, is in the members’ half. This piece takes no view on any product. Nothing here is a recommendation.

What This Piece Does
Question 1: What Did October Change, the Price or the Dividend?
What a yield after a fall does and does not say
🟠 Angela’s Observation
Question 2: Compared With What?
Four numbers, four different bargains
What the table does not say
What the Paid Half Adds
Question 3: What Did the Extra Yield Cost in a Month Like October?
The same SGD 10,000, five ways
The other side of the arithmetic
How far back up?
🟠 Angela’s Observation
What I Am Watching Next, Without Predicting
Iggy’s Forensic Read
Sources
Question 1: What Did October Change, the Price or the Dividend?
The yield moved. The dividends did not.
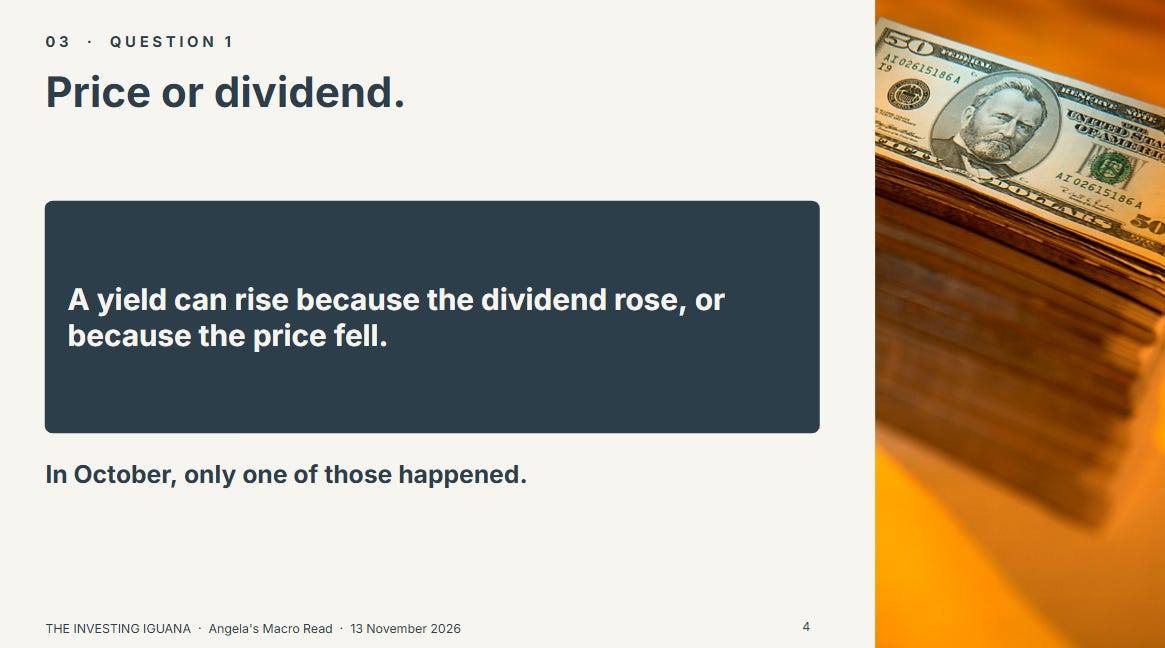
State Street defines the fund’s distribution yield as the annual dividends per unit divided by the market price per unit. So the yield can rise in two ways: the dividend goes up, or the price goes down. In October, only one of those happened.
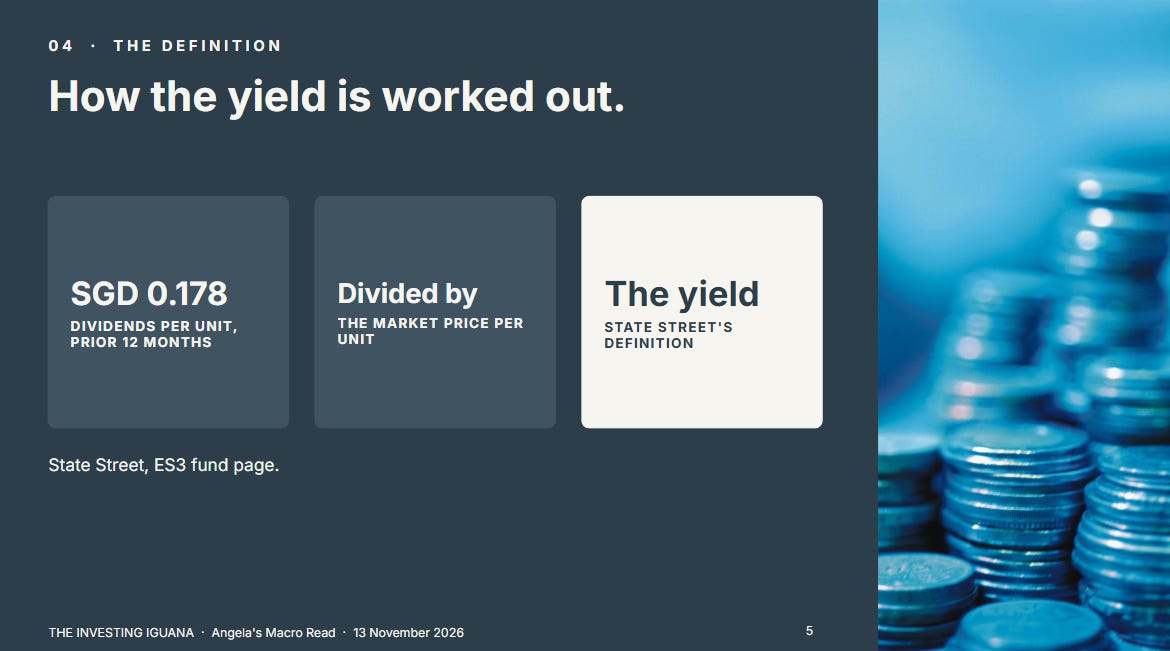
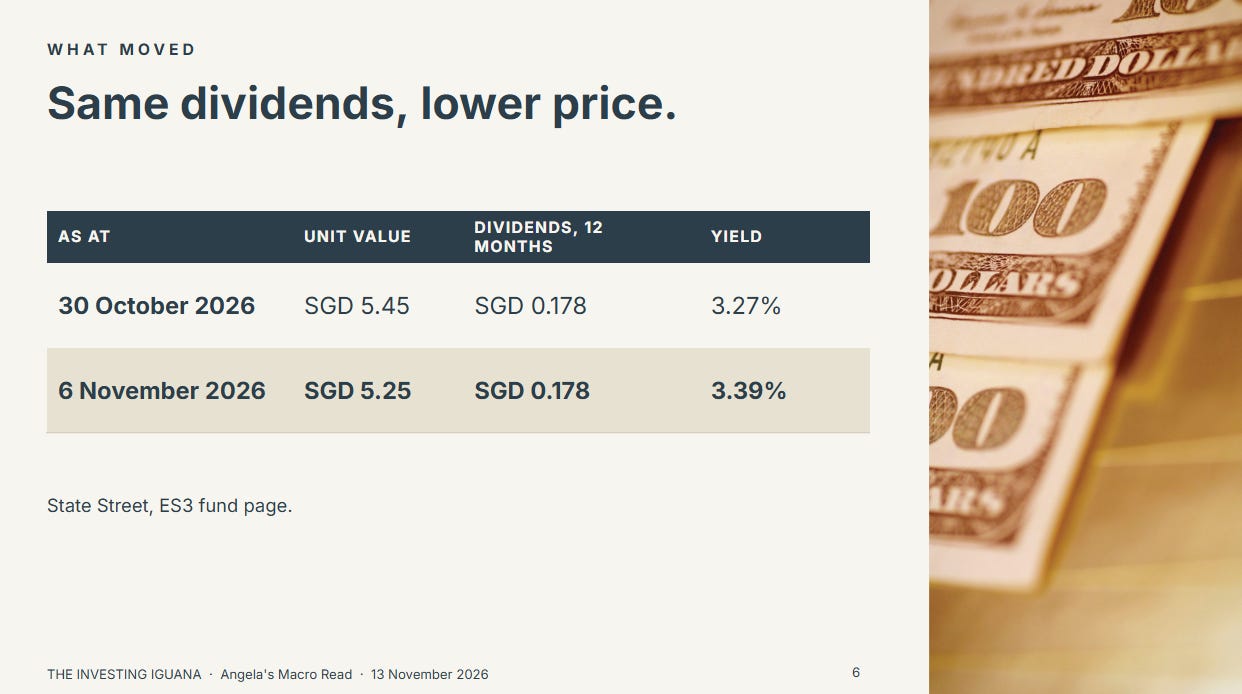
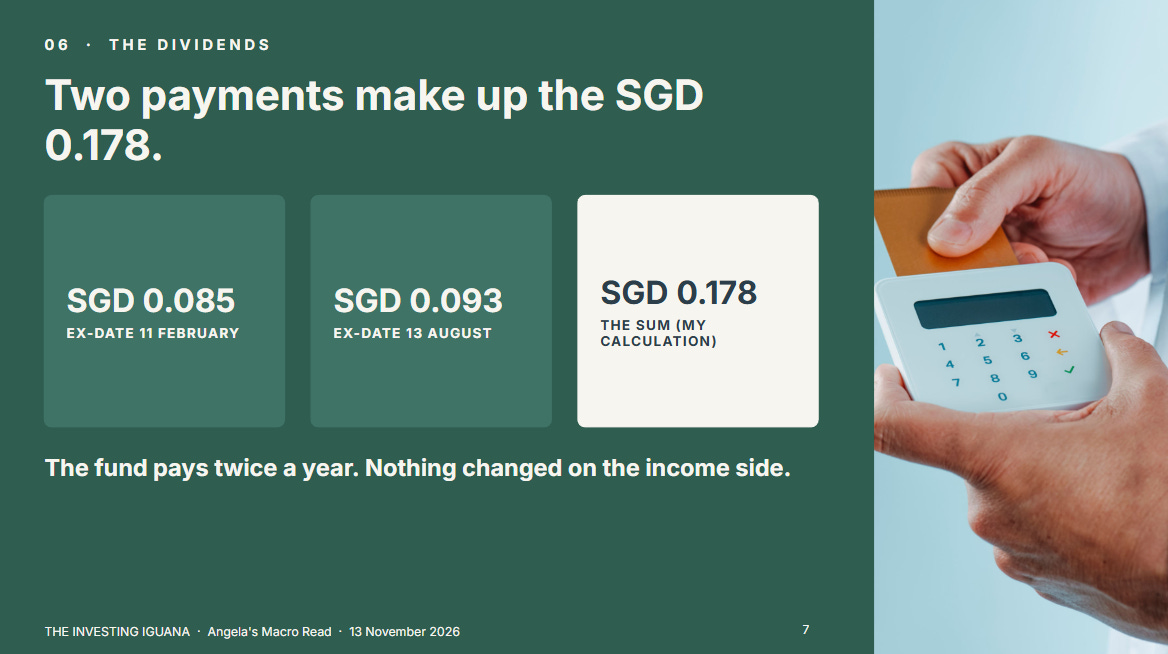
The two distributions behind the SGD 0.178 are SGD 0.085 (ex-date 11 February) and SGD 0.093 (ex-date 13 August). The sum is my own, and it reproduces State Street’s yield: SGD 0.178 divided by SGD 5.25 is 3.39%. The fund pays twice a year, so nothing in the table changed on the income side. The whole rise from 3.27% to 3.39% came from the unit price falling by about 3.7% in the first week of November, on top of the October fall.
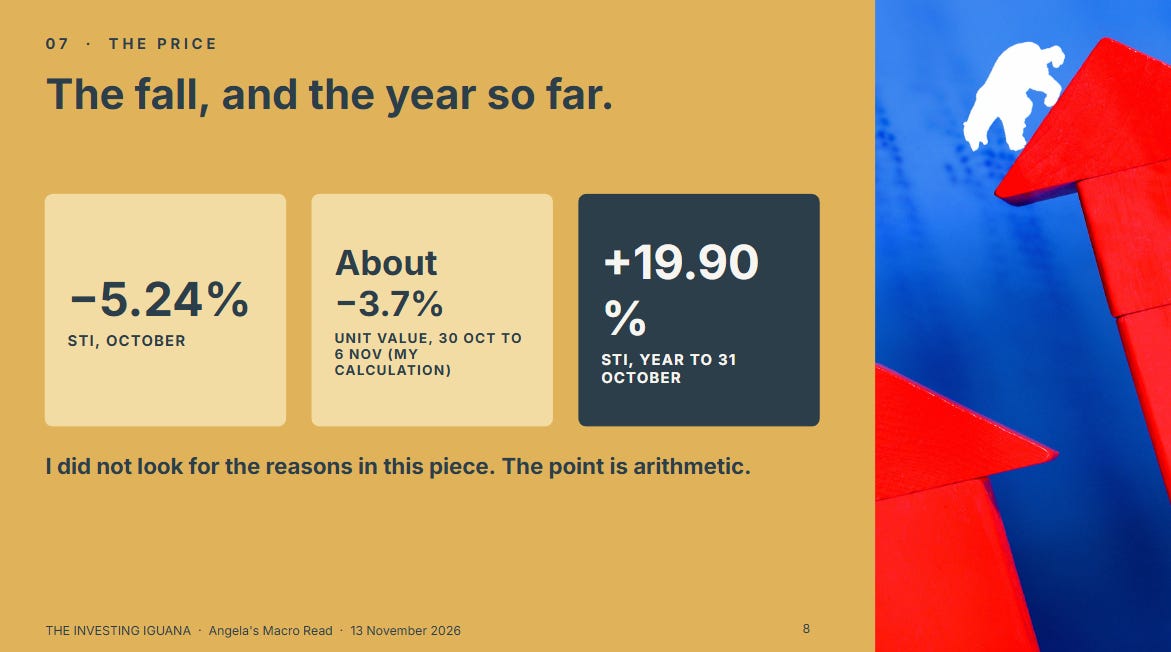
The October fall itself is on State Street’s page: the fund returned -5.26% for the month to 31 October and its benchmark, the STI, -5.24%. For the year to that date, the benchmark is up 19.90%. I have not looked for the reason for either move in this piece. The point here is arithmetic.
What a yield after a fall does and does not say
A yield calculated on last year’s dividends is a statement about the past, measured against the latest price. It does not say what the next distribution will be. The companies in the index decide that, and the fund passes it on. So a yield that has risen because of a falling price is a smaller price for the same past income. It is not a promise of more income.
The pushback is that a higher yield is still a better deal than a lower one. It is, if the dividends continue. That “if” is the part the yield cannot answer, and I would not want to treat the arithmetic as a forecast.
🟠 Angela’s Observation
If a hawker stall cut the price of a plate by fifty cents overnight, I would ask what had changed about the rice before I got excited about the saving. A lower price would make me more careful, not less. With a yield on a screen I notice I do the opposite: a lower price makes the number look more attractive before I have asked what changed. What would I ask the stall? And do I ask the same thing of the fund?
Question 2: Compared With What?
Four numbers, four different bargains
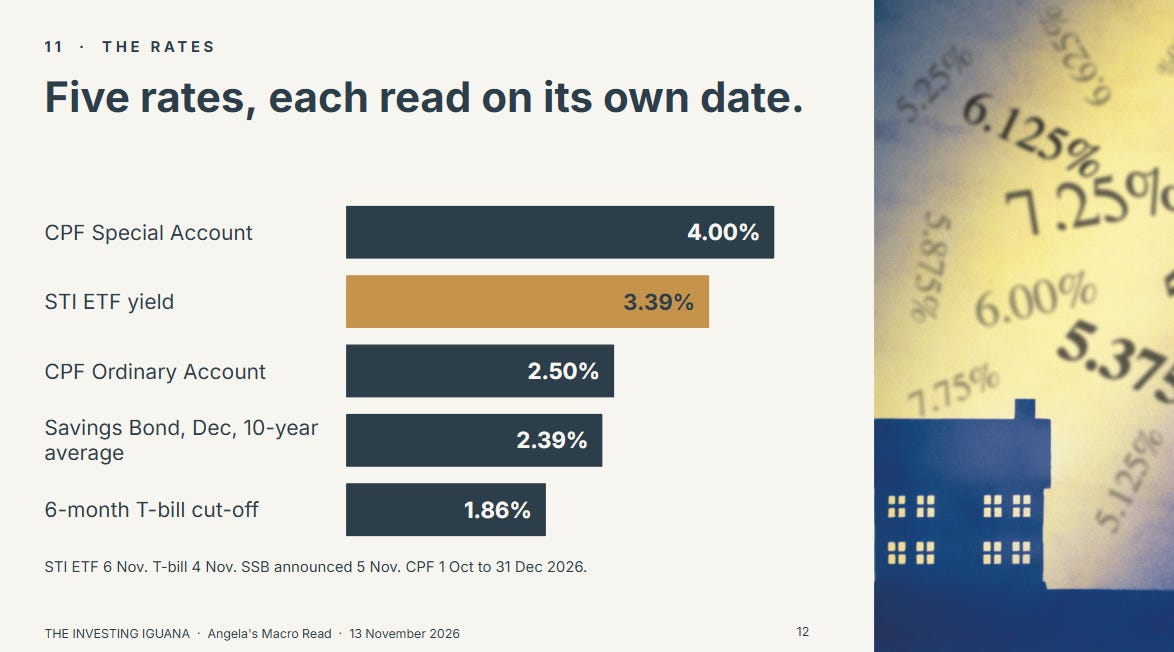
A yield means little on its own. The question I find useful is what each alternative pays and what it asks of the person holding it. Here is the same SGD 10,000 against the four options, with the date each rate was read.
Same, and members under 55 also earn an extra 1% on the first SGD 60,000 of combined balances (up to SGD 20,000 from the Ordinary Account).
Two things stand out when the column is read down. The T-bill rate has come down, from 1.95% to 1.86%, within two weeks, while the CPF rates have not moved, because the Government has set a floor of 4% on the Special, MediSave and Retirement Accounts that runs to 31 December 2027, and the Ordinary Account’s 2.5% is its own floor. And the gap between the fund’s 3.39% and the T-bill’s 1.86% is 1.53 percentage points, which is the extra income the fund offers for carrying a price that fell 5.24% in a month.
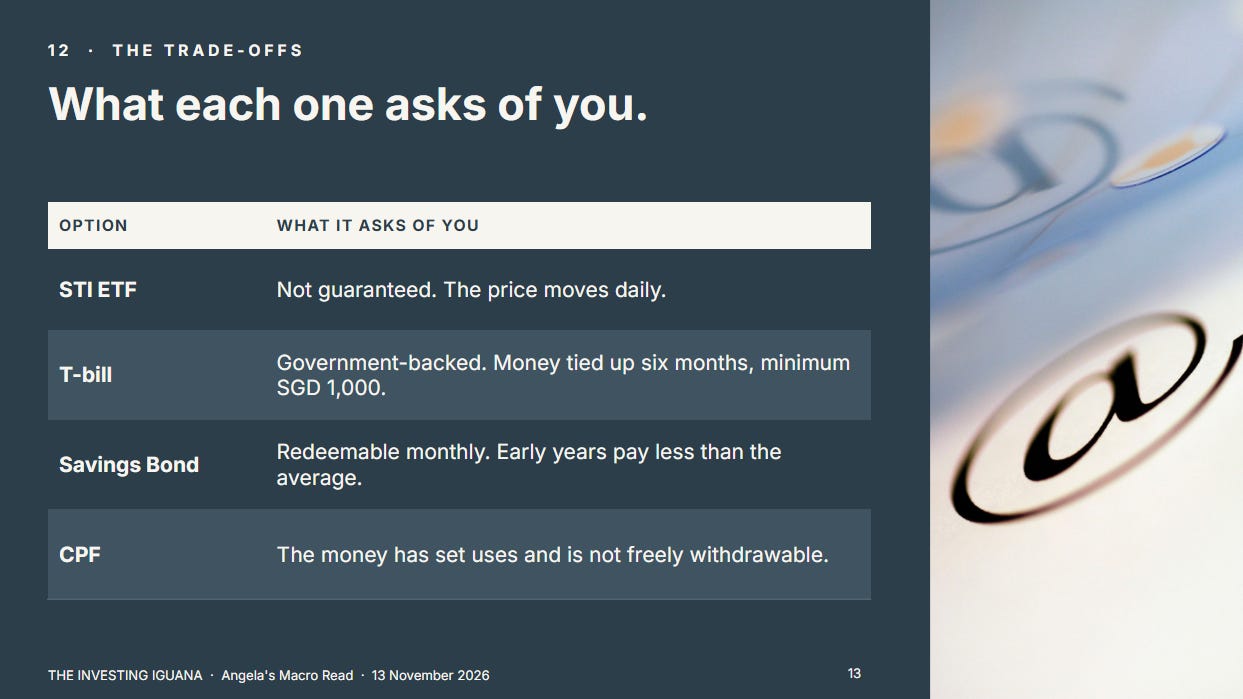
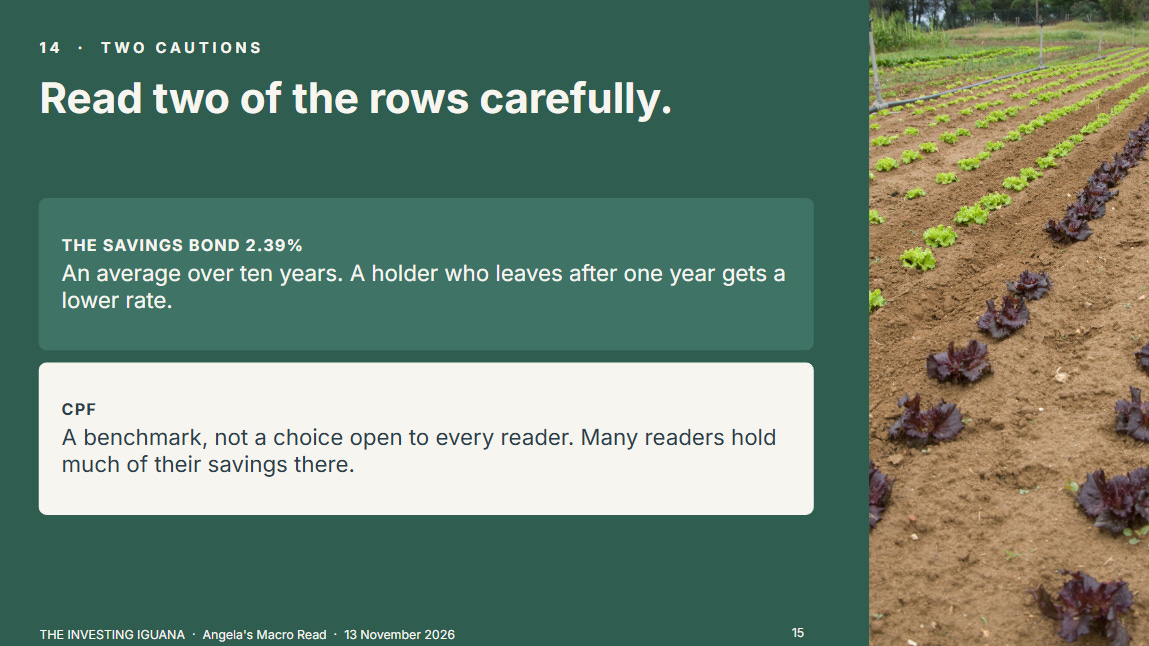
I would be careful with two of the rows. The Savings Bond’s 2.39% is an average over ten years, and a holder who leaves after one year is paid a lower rate than that. I set out the year-by-year coupons for the November bond in an earlier piece. And CPF money cannot be moved into a T-bill or a fund as the others can, so its rows are a benchmark and not a choice available to every reader. They are in the table because many readers hold a large part of their savings there, and it is the rate their other savings are, in effect, competing with.
What the table does not say
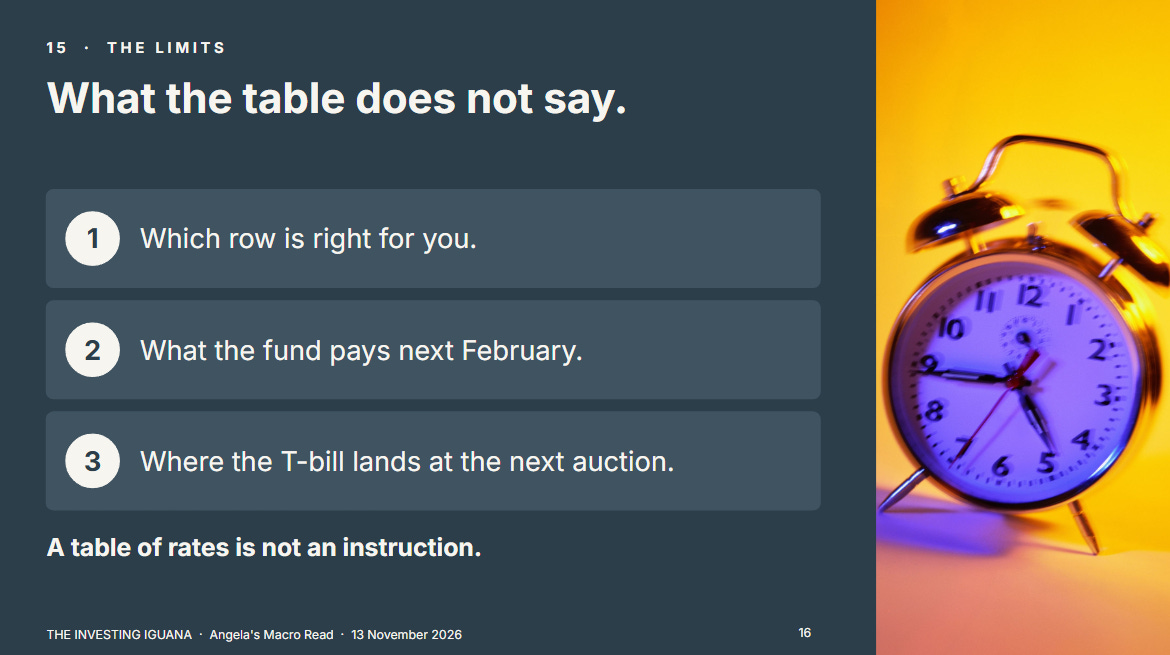
The table does not say which row is right for anyone. A reader who needs the money in six months and a reader who will not touch it for ten years are answering different questions, and so are a member close to 55 and one close to 30. It also does not say what the fund will pay next February, or where the T-bill will be at the next auction. I would be wary of any article, including this one, that turns a table of rates into an instruction.
What the Paid Half Adds
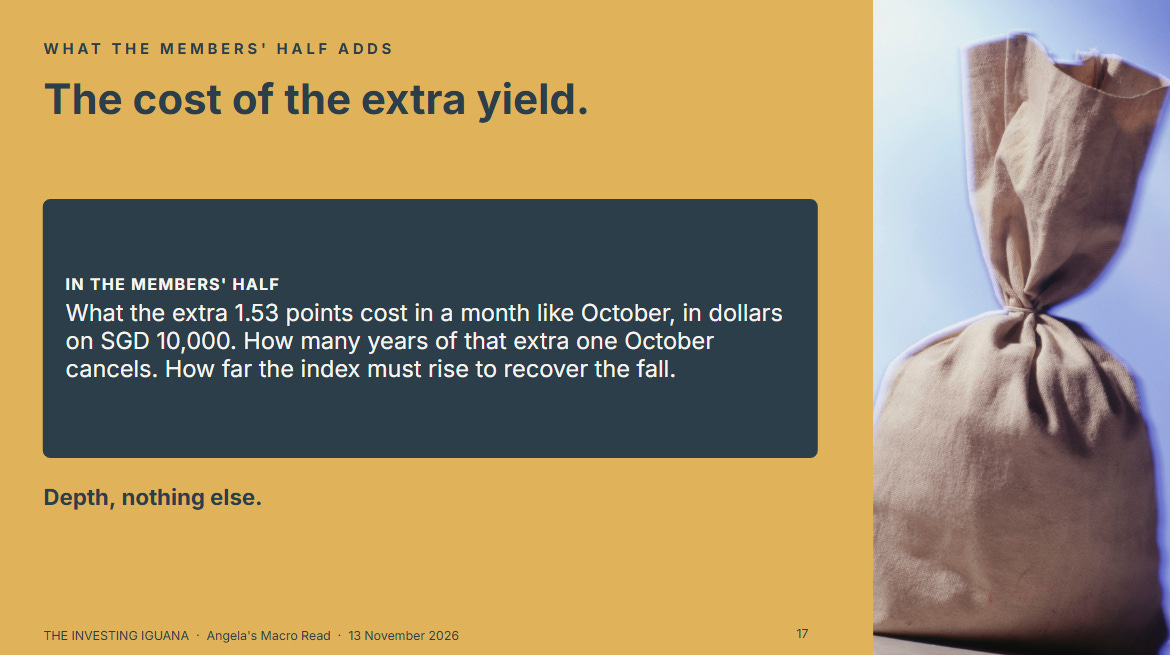
The free half sets out what moved in October and puts the STI yield beside a T-bill, a Savings Bond and CPF. The paid half adds the part that takes the most work to build: what the extra 1.53 percentage points of yield cost in a month like October, in dollars on SGD 10,000, how many years of that extra income one October takes to cancel, and how far the index must rise to recover the fall. The extra is depth, nothing else. There are three ways in.
The Substack Only Plan, US$8/month, gives the full written analysis, portfolio walkthroughs and analyst cheatsheets.
The YouTube Only Plan, S$5/month, gives the full-length Members Edition video.
The YouTube/Substack Combo, S$12/month, gives all of it.
🔒 What’s Next
The next section puts the extra yield and October’s fall on the same SGD 10,000, and shows how many years of the extra one month can cancel.
