

Far East Hospitality Trust Q3 2025: Japan Gambles, Singapore Stumbles—Is This 6% Yield Worth Your CPF?
While tourists flood back to Singapore, Far East Hospitality Trust’s latest numbers tell a more complex story for dividend-hungry Singaporeans.

While tourists flood back to Singapore, Far East Hospitality Trust’s latest numbers tell a more complex story for dividend-hungry Singaporeans. My deep dive into their Q3 2025 results reveals both hidden opportunities and red flags.
Today we’re dissecting Far East Hospitality Trust’s Q3 2025 business update—a 29-slide presentation that reveals the trust’s pivot toward Japan exposure and the headwinds hitting Singapore’s hospitality sector. After diving into every slide, from revenue breakdowns to debt maturity profiles, I’ll give you my clear stance: Buy, Hold, or Avoid. Plus, I’ll explain why this matters for your CPF allocation and what the next six months hold for REIT income seekers.
The numbers tell a tale of two markets. While Singapore hotels struggle with softer corporate demand and competition from new supply, FEHT’s Japan play is already showing promise. But is this geographic diversification enough to justify the 5.9% dividend yield when safer options exist?
In This Article:

• The Core Problem: Singapore Stumbles
• Slide 6-7: Singapore Hotel Performance - The Reality Check
• Slide 9-10: Serviced Residences - Corporate Demand Softens
• Slide 15-16: Tourism Outlook - Recovery Continues, But Challenges Remain
• Slide 11-12: Guest Demographics - Leisure Dominance
• The Bull Case (The Fortress)
• Slide 5: Balance Sheet Strength - A Genuine Bright Spot
• Slide 13-14: Asset Enhancement Initiatives - Investing for Efficiency
• The Growth Gamble: Japan
• Slide 1-2: Executive Summary - Mixed Signals Ahead
• Slide 3: Revenue Breakdown - Japan Cushions Singapore Weakness
• Slide 8: Japan Hotel Performance - The Growth Engine
• The 6% Yield: Is it a Trap?
• Slide 4: Attractive DPS Yield - But Context Matters
• The Road Ahead: Catalysts and Risks
• Slide 19: Q4 2025 Events Calendar - Near-term Catalysts
• Slide 17-18: New Attractions - Long-term Positives
• Slide 20: Macroeconomic Outlook - Mixed Global Picture
• You’re In Good Hands
• Iggy’s Assessment: Hold, But Monitor Closely
The Core Problem: Singapore Stumbles
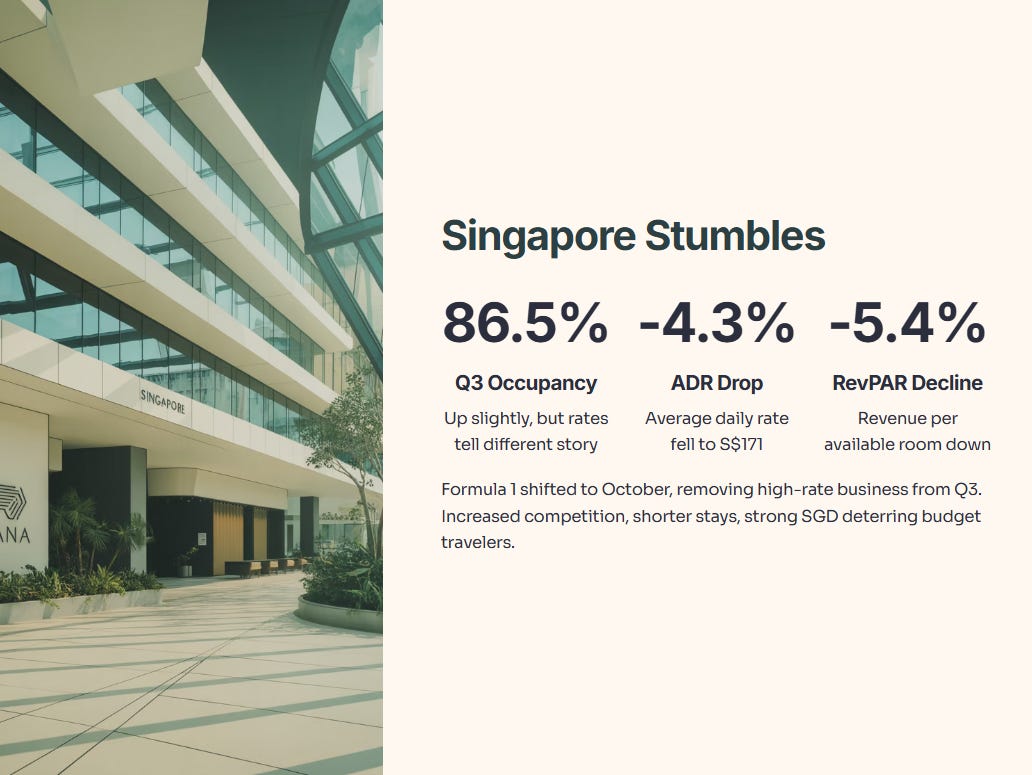
Slide 6-7: Singapore Hotel Performance - The Reality Check
Here’s where FEHT’s challenges become clear. Q3 2025 Singapore hotel occupancy rose to 86.5%, but average daily rate dropped 4.3% to S$171, resulting in 5.4% lower revenue per available room. The culprit? Formula 1 shifted to October, removing high-rate business from Q3.

Year-to-date numbers tell the broader story. Occupancy held steady at 81.8%, but ADR fell 4.8% to S$169, driving RevPAR down 5.2% to S$138. This reflects Singapore’s hospitality sector headwinds: increased competition from new hotels, shorter visitor stays, and a strong Singapore dollar deterring budget travelers.
Singapore Hotel Performance YTD 2025
Occupancy: 81.8% (vs 82.1% prior year)
ADR: S$169 (vs S$177 prior year)
RevPAR: S$138 (vs S$146 prior year)
For local investors, this explains why hospitality REITs underperformed other sectors in 2025. While Singapore’s tourism receipts may exceed pre-COVID levels, hotel operators face margin pressure from cost inflation and competitive pricing.
Slide 9-10: Serviced Residences - Corporate Demand Softens
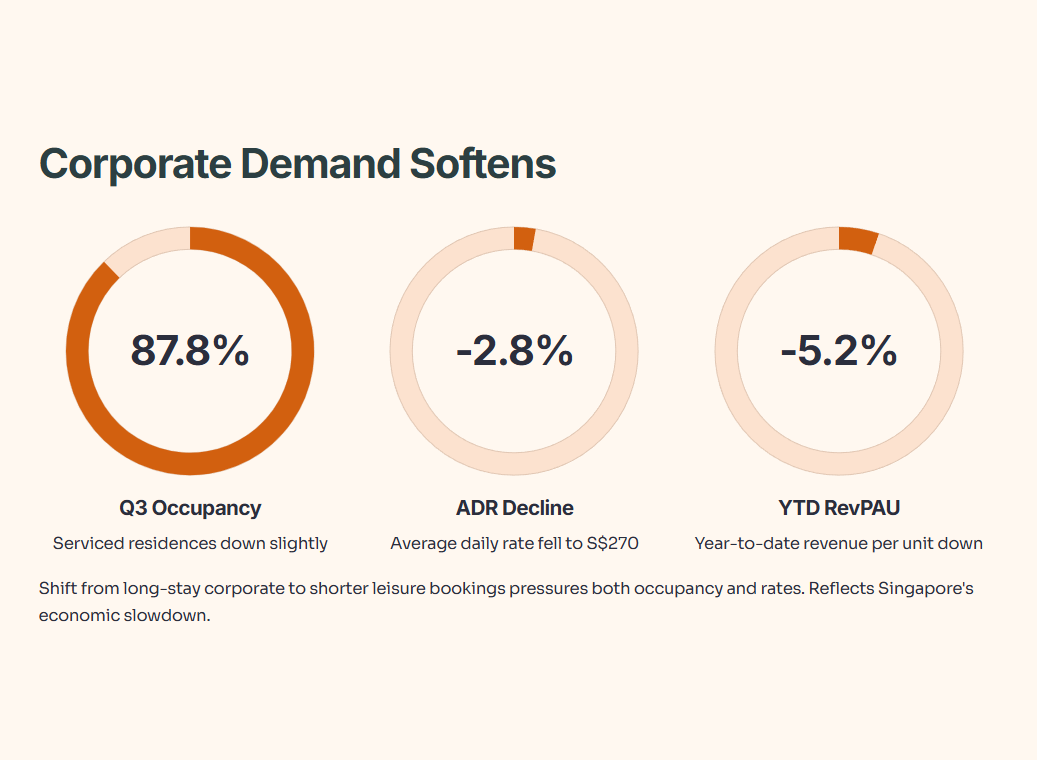
Singapore serviced residences faced headwinds in Q3 2025. Occupancy dropped slightly to 87.8%, while ADR fell 2.8% to S$270, resulting in 3.0% lower RevPAU. Construction near Village Residence Robertson Quay hurt performance, but the broader issue is softer corporate demand.
Year-to-date figures show steeper declines. Occupancy fell 4.7 percentage points to 81.4%, while RevPAU dropped 5.2% to S$220. The shift from long-stay corporate clients to shorter leisure bookings pressures both occupancy and rates.
Serviced Residence Performance YTD 2025
Occupancy: 81.4% (vs 86.1% prior year)
ADR: S$270 (unchanged)
RevPAU: S$220 (vs S$232 prior year)
This segment’s struggles reflect Singapore’s economic slowdown. Multinational companies reduce business travel and relocations, while higher interest rates dampen corporate spending. For FEHT, serviced residences provide less cyclical income than hotels, but current weakness suggests broader economic headwinds.
Slide 15-16: Tourism Outlook - Recovery Continues, But Challenges Remain
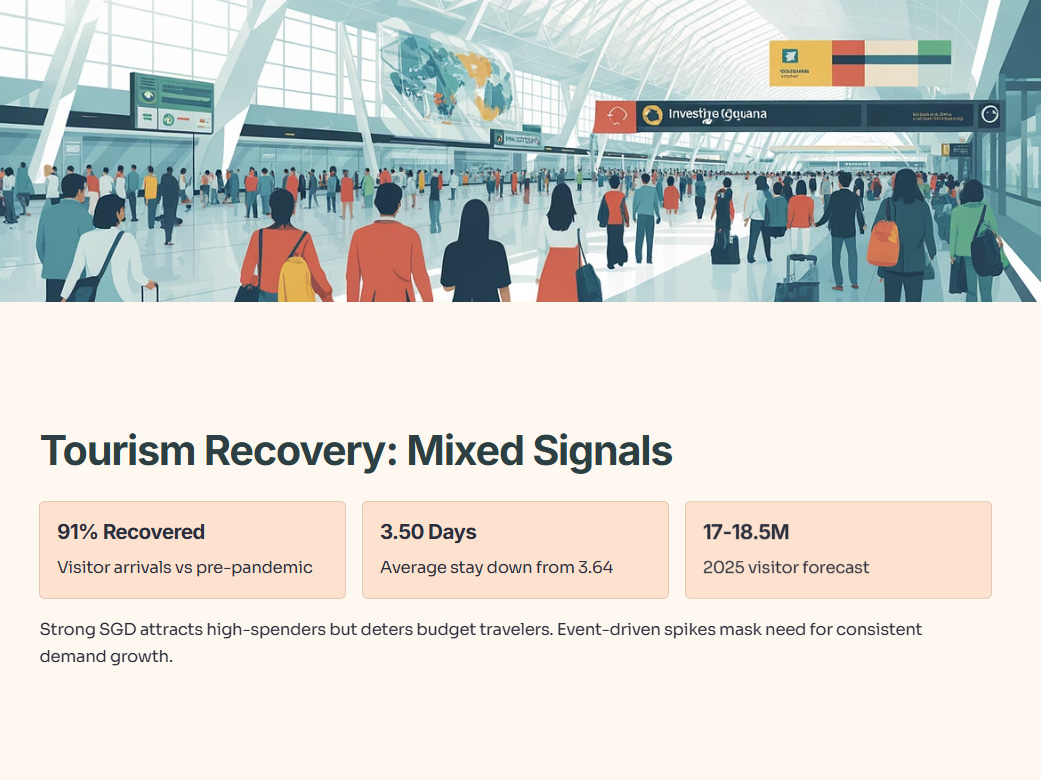
Singapore’s tourism recovery gained momentum in Q3 2025, with visitor arrivals reaching 91% of pre-pandemic levels. However, shorter average stays (3.50 days vs 3.64 previously) reduce total visitor nights—bad news for hotels.
The strong Singapore dollar creates additional headwinds. While attracting high-spending visitors, it deters budget travelers and makes Singapore less competitive versus regional destinations. STB forecasts 17-18.5 million visitors for 2025, but revenue per visitor may plateau.
Tourism Recovery Metrics
Q3 2025 arrivals: 91% of 2019 levels
Average stay: 3.50 days (vs 3.64 previously)
2025 forecast: 17-18.5 million visitors
Major events help. World Aquatics Championships boosted Q3 demand, while Q4 features Formula 1, Christmas events, and various MICE activities. However, Singapore needs consistent demand growth, not just event-driven spikes.
Slide 11-12: Guest Demographics - Leisure Dominance
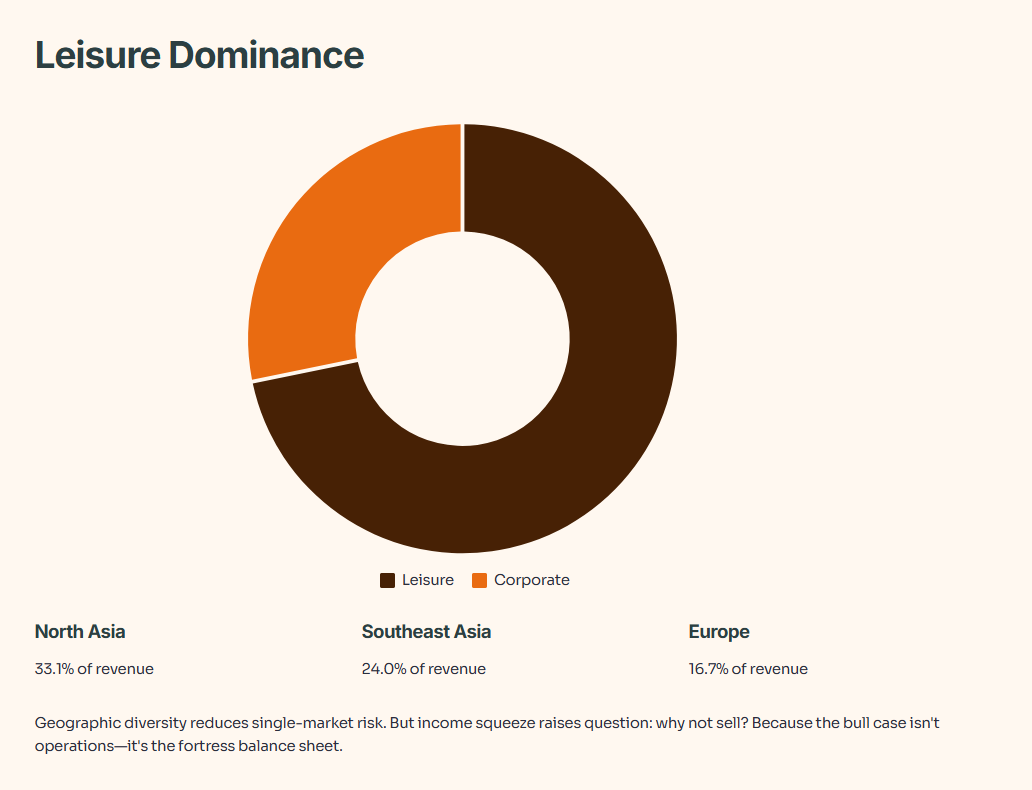
The revenue breakdown by market segment reveals important shifts. Leisure travelers now contribute 71.9% of Singapore hotel revenue, while corporate drops to 28.1%. This leisure tilt brings both opportunities and risks.
Geographic diversity shows resilience. Southeast Asia leads at 24.0%, followed by North Asia at 33.1% and Europe at 16.7%. This spread reduces dependency on any single source market—crucial given China’s slower outbound travel recovery.
Singapore Hotel Revenue Sources
Leisure/Independent: 71.9%
Corporate: 28.1%
Top Markets: North Asia (33.1%), Southeast Asia (24.0%), Europe (16.7%)
For serviced residences, corporate clients still dominate at 53.7%. The top industries—Services (30.0%), Banking & Finance (22.7%), and Oil & Gas (15.3%)—reflect Singapore’s economic structure but also concentration risk if these sectors weaken.
This highlights a key risk: income is getting squeezed. So, with the core Singapore market stumbling, why isn’t this an easy ‘Sell’? Because the bull case for FEHT isn’t about its operations—it’s about its rock-solid balance sheet.
The Bull Case (The Fortress)
Slide 5: Balance Sheet Strength - A Genuine Bright Spot
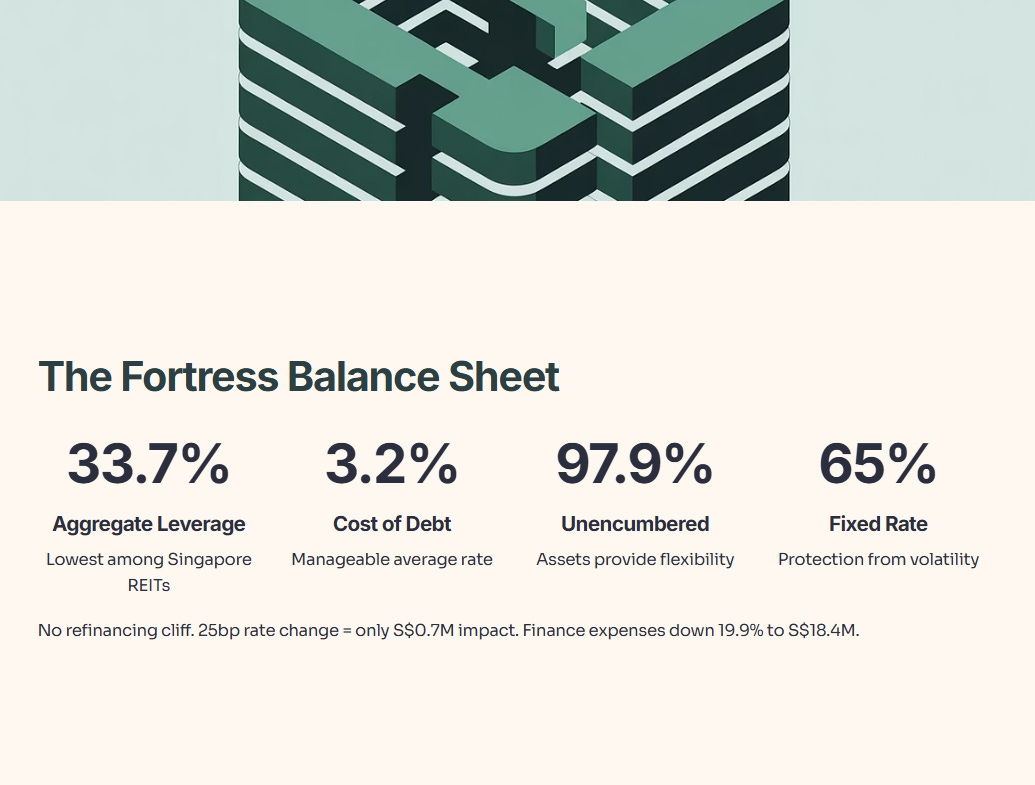
This slide showcases FEHT’s financial discipline. At 33.7% aggregate leverage, they maintain one of the lowest gearing ratios among Singapore REITs. Their average cost of debt at 3.2% remains manageable, while 97.9% of assets remain unencumbered—providing flexibility for future financing.
The debt maturity profile shows smart planning. No major refinancing cliff awaits, with borrowings spread across 2025-2030. Fixed-rate debt comprises 65% of total borrowings, protecting against interest rate volatility. For a 25 basis point rate change, FEHT estimates only S$0.7 million impact on distributable income—roughly 0.03 cents per unit.
Key Balance Sheet Metrics
Total Debt: S$795.8 million
Available Facilities: S$248.0 million
Aggregate Leverage: 33.7%
Fixed Rate Proportion: 65.0%
Interest Coverage: 3.3x
This conservative capital structure provides defensive qualities. Even if hospitality demand weakens further, FEHT won’t face immediate refinancing pressure or covenant breaches. For risk-averse CPF allocators, this balance sheet strength partially offsets sector volatility concerns.
The silver lining? Finance expenses decreased 19.9% to S$18.4 million as FEHT benefited from lower interest rates—a tailwind that won’t last forever as central banks pause cutting cycles.
Slide 13-14: Asset Enhancement Initiatives - Investing for Efficiency
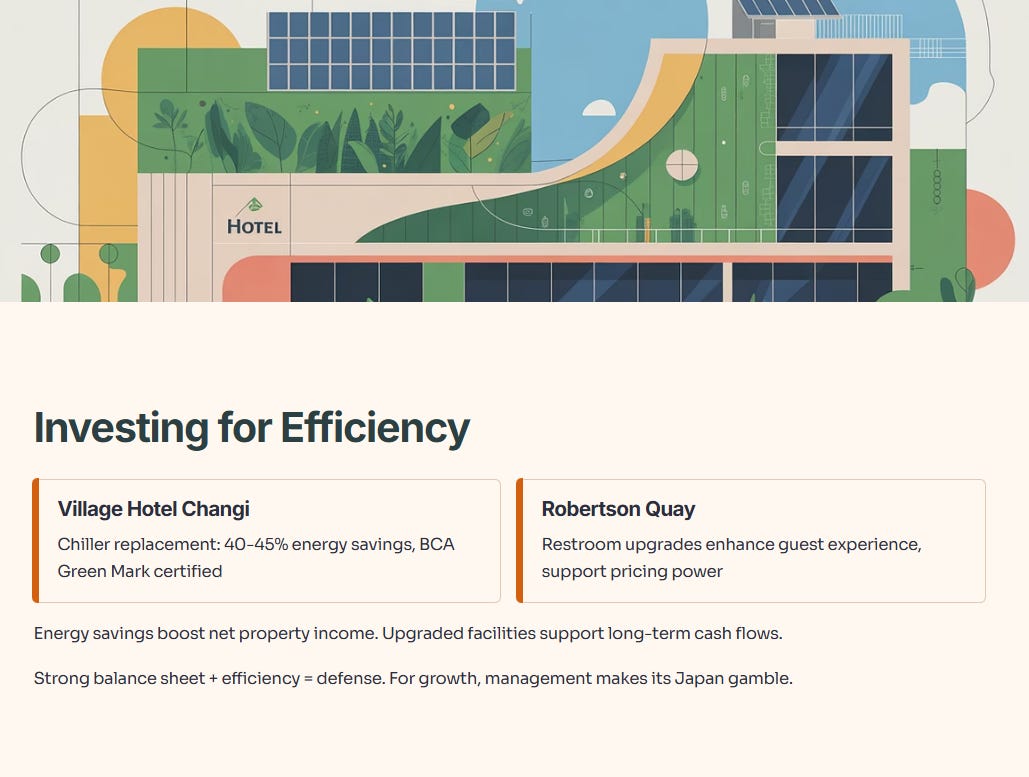
FEHT continues upgrading properties despite sector challenges. The Village Hotel Changi chiller replacement project expects 40-45% energy savings and achieved BCA Green Mark certification. These efficiency gains reduce operating costs while supporting ESG credentials.
Village Residence Robertson Quay’s restroom upgrades may seem minor, but they demonstrate management’s attention to guest experience. In today’s competitive hospitality market, such details matter for occupancy and rate premiums.
While these investments require upfront capital, they should improve long-term cash flows. Energy savings directly boost net property income, while upgraded facilities support pricing power. For dividend-focused investors, these moves show management thinking beyond quarterly results.
These moves show management is thinking beyond quarterly results. But a strong balance sheet and efficiency gains only provide defense. For growth, management is making its new gamble: a pivot to Japan.
The Growth Gamble: Japan
Slide 1-2: Executive Summary - Mixed Signals Ahead
The opening slides of the Q3 2025 summary set the stage for this new gamble. Gross revenue climbed 5.7% year-on-year to S$30.4 million, driven primarily by their new Japanese hotel acquisition.
Slide 3: Revenue Breakdown - Japan Cushions Singapore Weakness
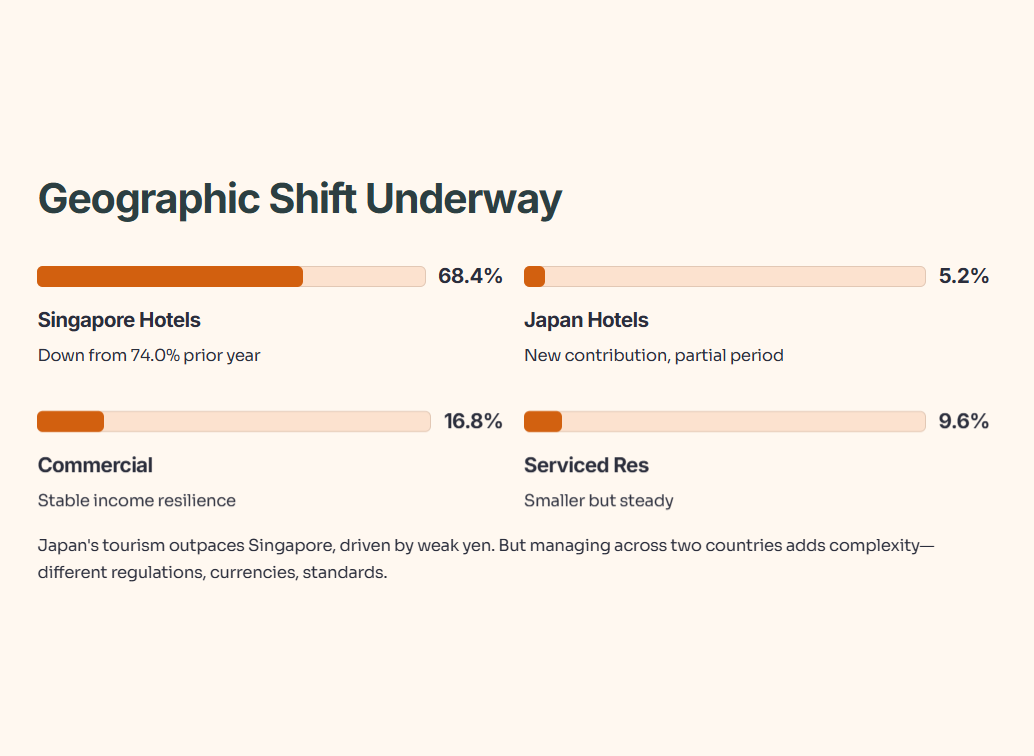
The revenue composition reveals FEHT’s strategic shift. Hotels still anchor the portfolio at 73.6% of total revenue, but the new Japan hotel contributes 5.2% despite being owned for only part of the period. Singapore hotels saw their contribution drop from 74.0% to 68.4%—not by choice, but due to weaker performance.
This geographic diversification makes sense on paper. Japan’s tourism recovery is outpacing Singapore’s, driven by a weaker yen attracting record international visitors. However, managing properties across two countries with different regulatory frameworks, currency exposures, and operating standards adds complexity.
Revenue Mix Analysis
Hotels: 73.6% (Singapore 68.4%, Japan 5.2%)
Serviced Residences: 9.6%
Commercial Premises: 16.8%
The commercial premises segment’s stable 16.8% contribution provides some income resilience, but hospitality exposure still dominates at over 80%. For CPF investors seeking steady income, this concentration risk requires careful consideration.
Slide 8: Japan Hotel Performance - The Growth Engine
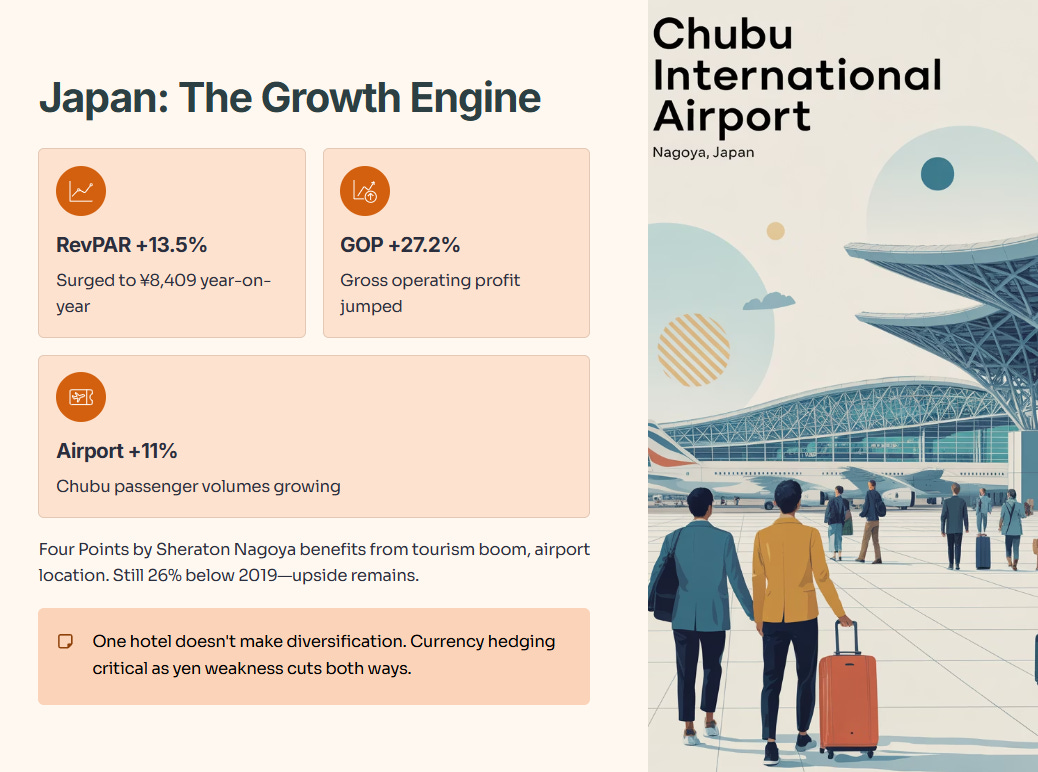
FEHT’s Four Points by Sheraton Nagoya tells a different story. RevPAR surged 13.5% year-on-year to ¥8,409, while gross operating profit jumped 27.2%. This property, acquired in April 2025, benefits from Japan’s tourism boom and location near Chubu International Airport.
The airport factor matters. Chubu International Airport passenger volumes grew 11% in Q3 2025, though still 26% below 2019 levels. This suggests further upside as Japan’s inbound tourism continues recovering. The property’s airport hotel positioning provides defensive revenue streams from airline crews and transit passengers.
However, one hotel doesn’t make a diversification strategy. FEHT needs more Japan exposure to meaningfully reduce Singapore dependency. Currency hedging also becomes critical—yen weakness that boosts Japanese tourism could hurt FEHT’s SGD-based returns.
However, one hotel doesn’t make a diversification strategy. This brings us to the core conflict for CPF investors: we have a weak Singapore market, a strong balance sheet, and a small new gamble in Japan. How does this all stack up against that 5.9% dividend yield? Is it a trap?
The 6% Yield: Is it a Trap?
