

Frasers Centrepoint Trust 2H FY25 Results: A Suburban Retail Masterclass in a Tightening Market
Can Singapore’s retail REITs keep growing while the property pipeline dries up? FCT just proved it’s not a question—it’s a formula.

Why This Report Matters Now
Here’s the investor pain point: Singapore’s retail market is getting squeezed. Supply constraints are real. But FCT’s FY25 results tell a different story than the doomsayers want you to believe. They’re growing distributions, acquiring premium assets, raising capital smartly, and doing it all while competing in a market that’s supposedly running out of room. If you own suburban retail exposure or you’re thinking about it, this report rewrites what you need to know.
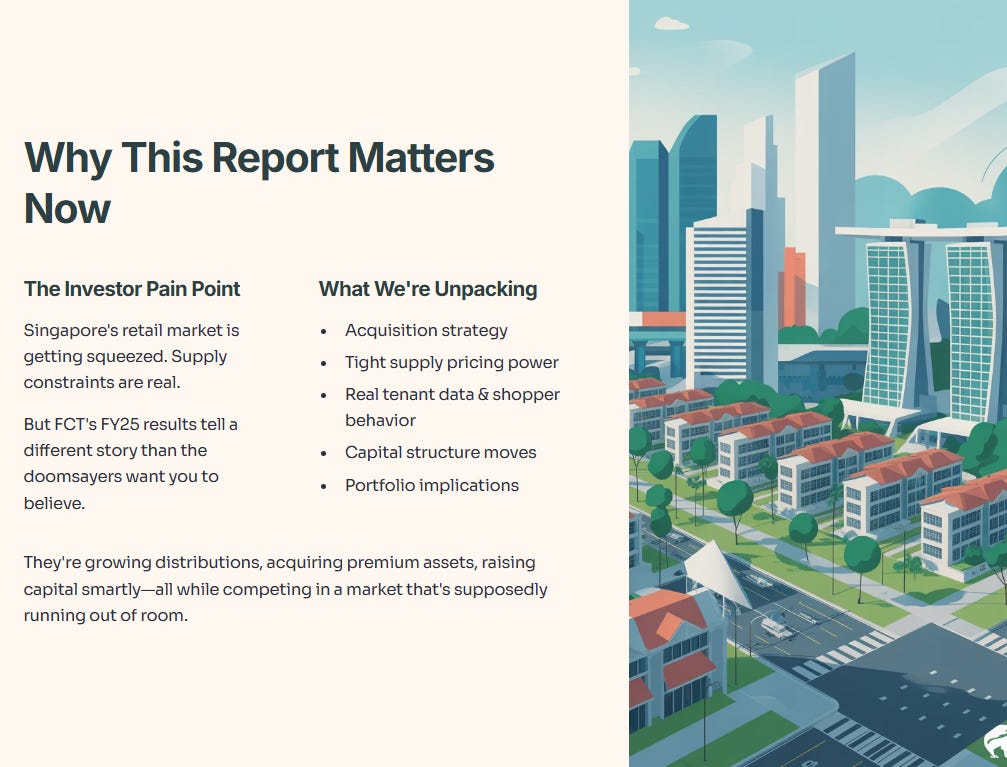
What we’re about to unpack: FCT’s acquisition strategy, how tight supply props up pricing power, real tenant data and shopper behaviour, capital structure moves, and what it all means for your portfolio. I’ll walk you through each major section of this report slide by slide, then give you my call.
In This Article:

• Why This Report Matters Now
• Slide 1: FY25 Summary & Highlights—The Strategic Blueprint
• Slide 2: Macroeconomics & Singapore’s Retail Market—Why Timing Matters
• Slide 3: The Supply Squeeze - Why the Supply Squeeze is FCT’s Biggest Advantage
• Slide 4: Financial Highlights - DPU Growth Looks Flat, But Don’t Be Fooled
• Slide 5: Operational Highlights—Where Pricing Power Lives
• Slide 6: Hougang Mall AEI—The Expansion Play
• Slide 7: Portfolio Highlights—Quality & Diversification
• Slide 8: Capital Structure & Financial Position—The Safety Net
• Slide 9: ESG & Community—The Durable Moat
• Slide 10: Looking Ahead—The Catalysts
• Iggy’s Assessment: Buy, Hold, or Sell?
• For Singapore investors using CPF:
• Key risks to monitor:
• The Bottom Line
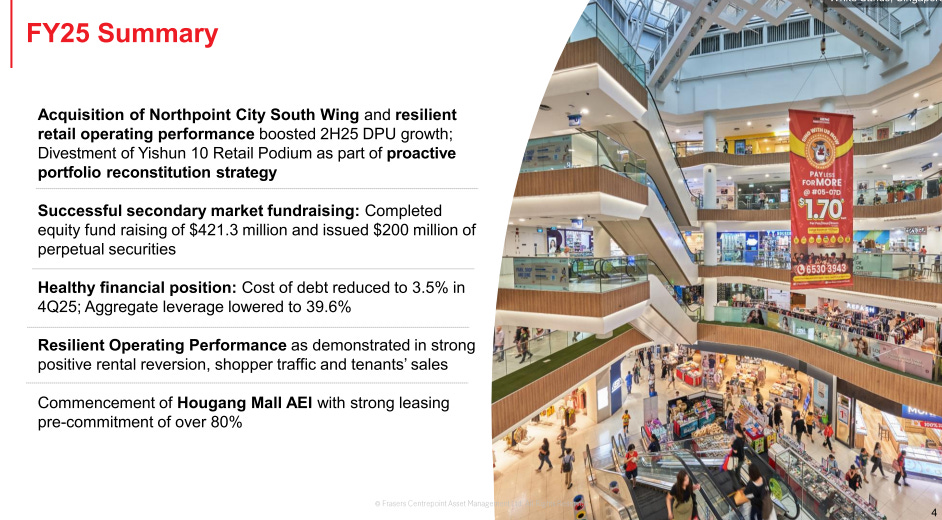
Slide 1: FY25 Summary & Highlights—The Strategic Blueprint
FCT’s FY25 story isn’t just about distributing cash. It’s about repositioning the portfolio and proving that in a constrained market, quality matters.
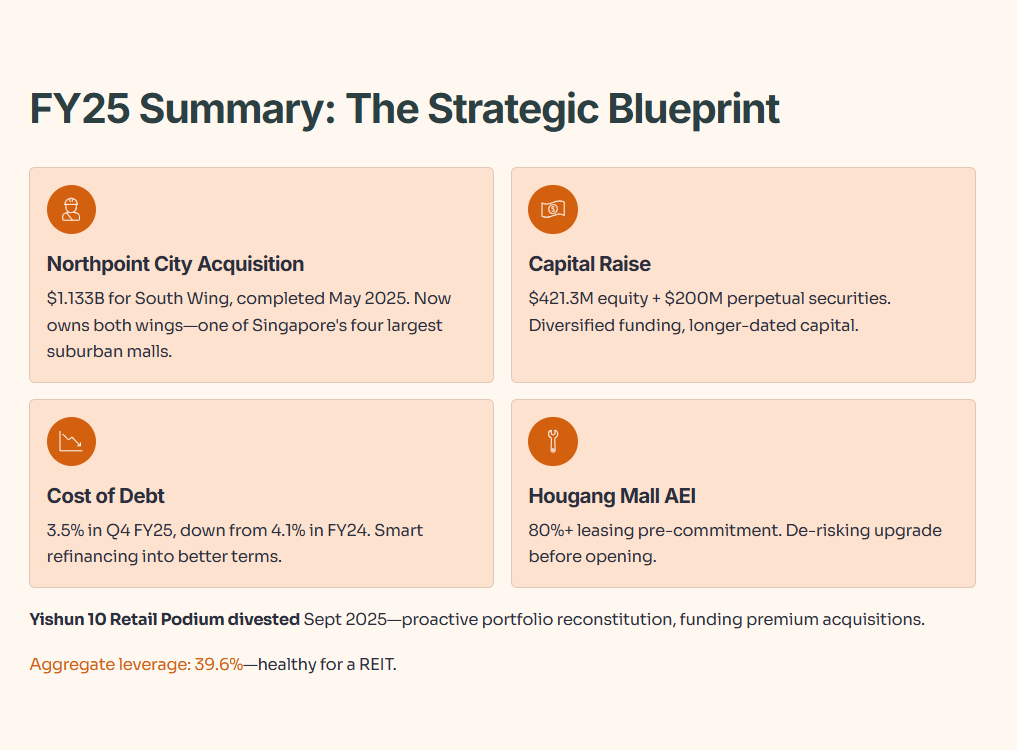
Key moves:
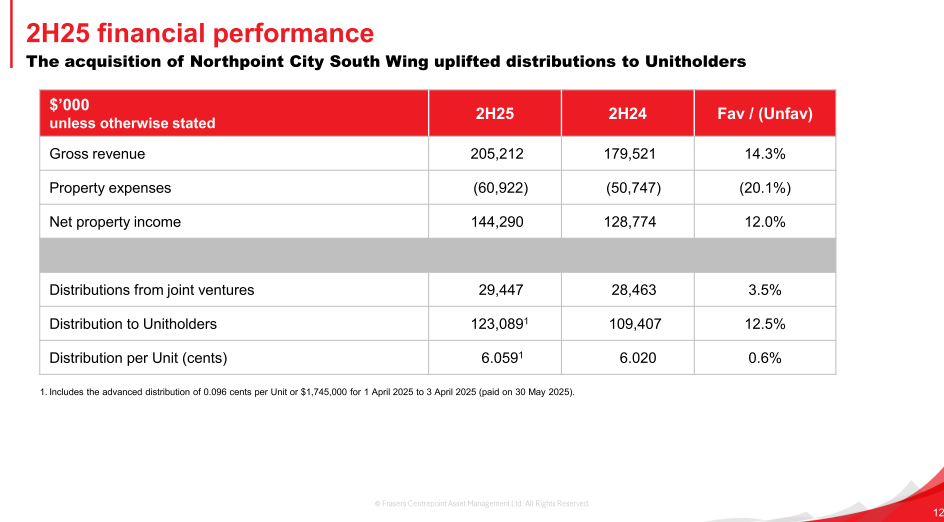
Northpoint City South Wing acquisition completed 26 May 2025 for $1.133 billion. This is the headline play. They now own both wings of Northpoint City, one of Singapore’s four largest suburban malls. You’re paying for scale and market dominance in a high-traffic node.
Yishun 10 Retail Podium divestment on 23 September 2025. This wasn’t weakness—it’s proactive portfolio reconstitution. They’re getting out of lower-tier assets to fund premium acquisitions. Smart capital reallocation.
Capital raise: $421.3 million equity fundraising plus $200 million perpetual securities. That’s sophisticated. They’re diversifying funding sources and locking in longer-dated capital when rates are settling.
Cost of debt hit 3.5% in 4Q25—down from 4.1% in FY24. They’re managing debt maturity smartly and refinancing into better terms. Aggregate leverage sits at 39.6%, which is healthy for a REIT.
Hougang Mall Asset Enhancement Initiative (AEI) kicking off with 80%+ leasing pre-commitment. That’s crucial. They’re de-risking the upgrade before it even opens.
What this tells you: FCT is playing offense. They’re not just defending distributions. They’re building scale in the right locations and managing balance sheet risk with real sophistication.
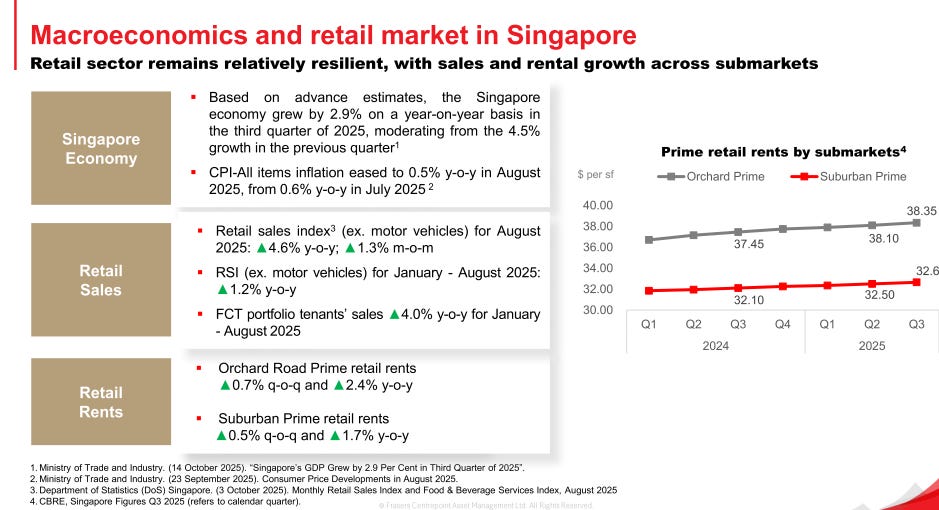
Slide 2: Macroeconomics & Singapore’s Retail Market—Why Timing Matters
The broader economy is your context. Here’s what’s happening:
Singapore’s growth:
Q3 2025 GDP grew 2.9% year-on-year, down from 4.5% in Q2. This is moderating but still solid. Not recessionary.
CPI inflation eased to 0.5% year-on-year in August 2025. That’s deflationary comfort. Shoppers have spending power without erosion pressure.
Retail sales are holding up:
Retail Sales Index (ex-motors) hit 4.6% year-on-year in August 2025. That’s strong.
Year-to-date January–August 2025: 1.2% year-on-year growth. Steady, not spectacular.
FCT portfolio tenants’ sales: 4.0% year-on-year for January–August 2025. That’s outperforming the broader index. Their tenant mix works.
Rental landscape:
Prime Orchard Road retail rents are at $38.35 psf per month (0.7% quarter-on-quarter, 2.4% year-on-year).
Suburban Prime rents: $32.50 psf per month (0.5% quarter-on-quarter, 1.7% year-on-year).
These aren’t explosive, but they’re moving up. Landlords have pricing power. That matters for FCT’s ability to push through rental reversions.
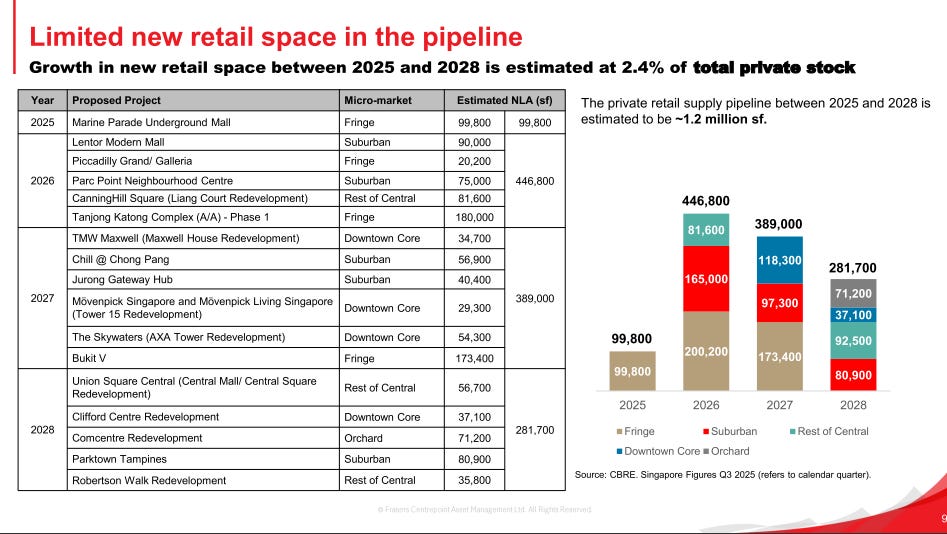
Slide 3: The Supply Squeeze - Why the Supply Squeeze is FCT’s Biggest Advantage
This is the key to understanding why FCT’s model works right now:
Private retail supply pipeline 2025–2028: ~1.2 million sf. That’s 2.4% of total private stock.
For context, FCT’s retail portfolio alone is ~3 million sf. The new pipeline is smaller than one of their holdings. That’s constraint.
Let me break down where the supply is coming:
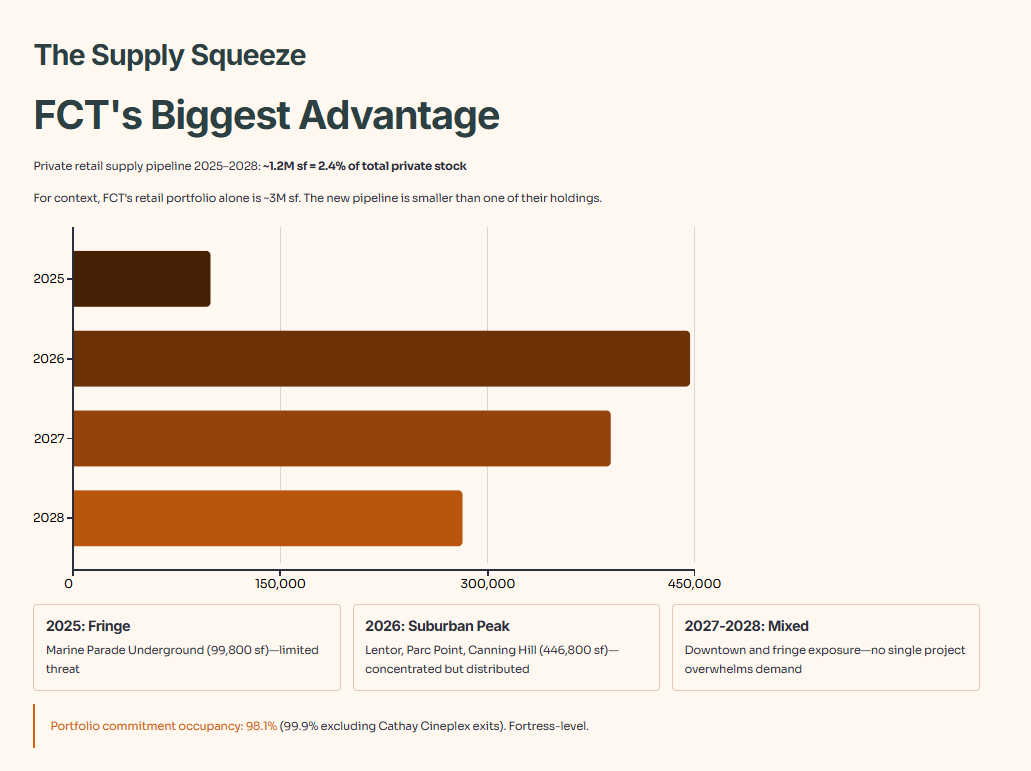
The winner: FCT’s malls are all suburban and well-connected to MRT. They’re not competing head-to-head with Central Area redevelopments. The 2026 pipeline hits suburban, but it’s distributed. No single project overwhelms demand.
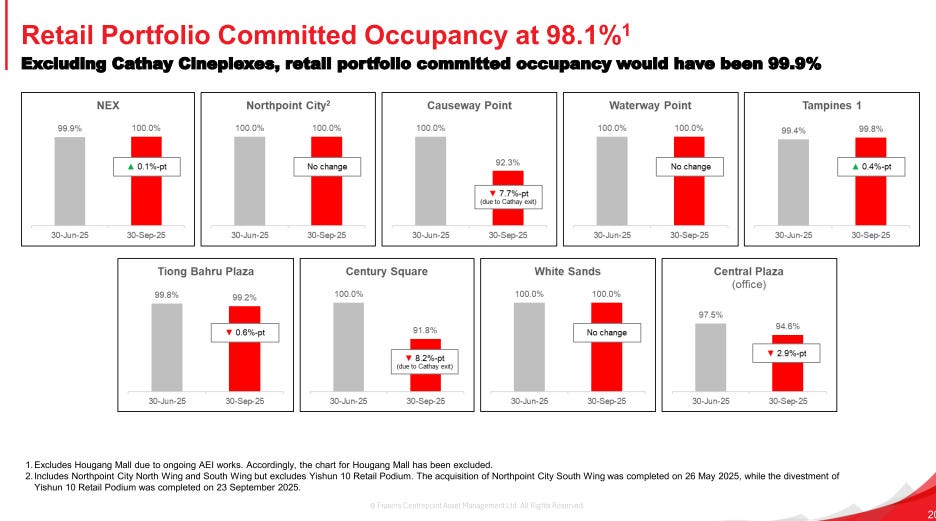
Occupancy hold tight: FCT’s portfolio commitment occupancy sits at 98.1% (99.9% excluding Cathay Cineplex exits). That’s fortress-level. New supply will chase for tenants, but tenant demand for suburban space remains resilient.
Slide 4: Financial Highlights - DPU Growth Looks Flat, But Don’t Be Fooled
FY25 Distribution Per Unit (DPU): 12.113 cents versus 12.042 cents FY24. Growth of 0.6%.
On the surface, 0.6% looks flat. Don’t be fooled. Here’s why:
The previous year (FY24) included a $1.092 million tax-exempt income release that FCT didn’t repeat in FY25. Normalizing for that, underlying distribution growth is stronger.
They acquired Northpoint City South Wing partway through FY25 (May 2025). Half-year accretion didn’t move the needle much, but full-year impact will compound.
They took on $200 million perpetual securities (high-coupon, long-dated capital). This dilutes unit count and mutes per-unit growth short-term but de-risks the balance sheet.
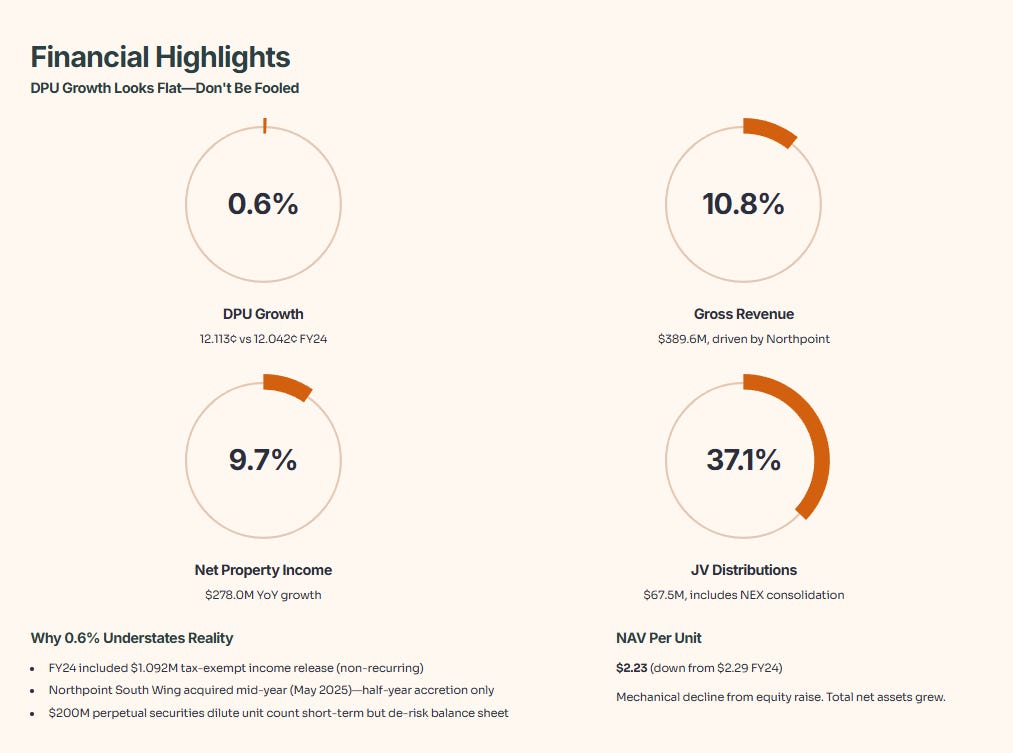
Gross revenue: $389.6 million, up 10.8% year-on-year. That’s acceleration driven by Northpoint South Wing.
Net Property Income (NPI): $278.0 million, up 9.7% year-on-year. Property expenses grew 13.5%, meaning margins compressed slightly (71.4% in FY25 vs 72.0% in FY24). This is normal when integrating a new acquisition—one-off costs and operational setup.
Net Asset Value per Unit: $2.23, down from $2.29 in FY24. The decline is mechanical: larger issued unit base from the $421.3 million equity raise dilutes NAV per unit. But total net assets grew. You’ve got more assets backing fewer units of compounding power over time.
Distributions from joint ventures: $67.5 million, up 37.1% year-on-year. This spike includes consolidation effects from NEX (which became a subsidiary in 1H24). Exclude that one-off, and steady-state JV distributions are resilient. NEX and Waterway Point (both 50% owned) are performing well.
Slide 5: Operational Highlights—Where Pricing Power Lives
Let’s look at what’s actually happening in the malls:
Occupancy by property (as of 30 Sept 2025):
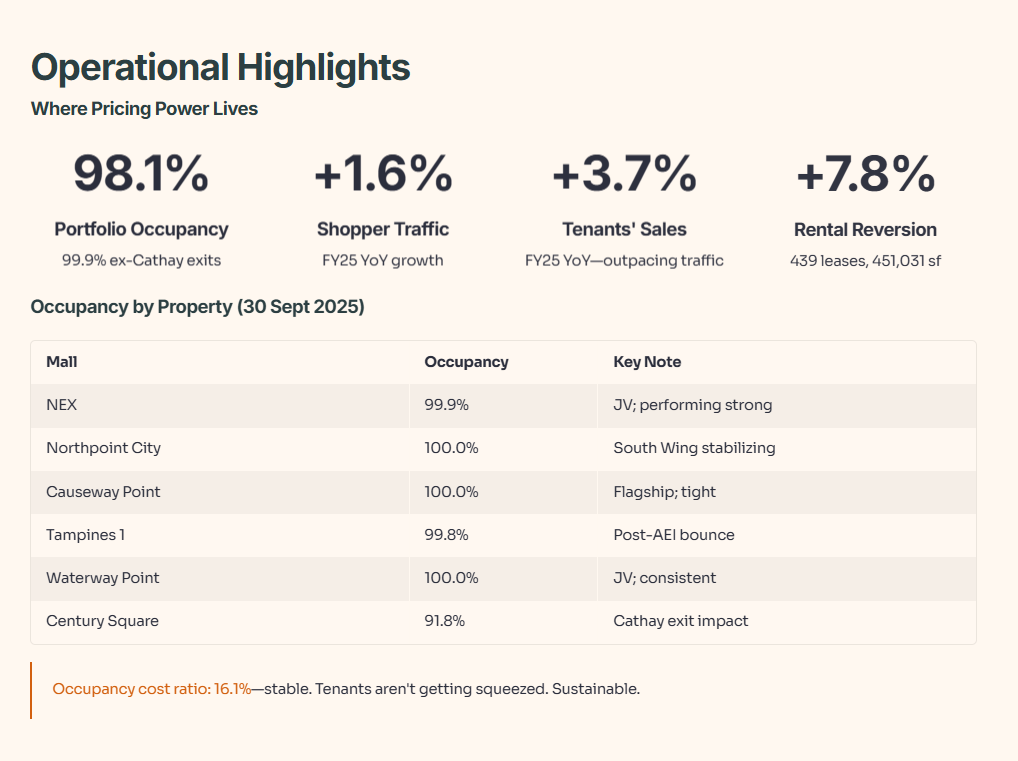
The real story: Cathay Cineplex exited two malls—Causeway Point and Century Square. This created 7.7% and 8.2% occupancy dips respectively. Excluding that strategic tenant realignment, portfolio would be 99.9% committed across the board. Tenants are clamouring for space.
Shopper traffic & tenants’ sales (FY25 year-on-year):
Shopper traffic: +1.6% year-on-year
Tenants’ sales: +3.7% year-on-year
Traffic is modest growth, but sales growth outpaces traffic. That means higher spend per shopper. Tenant productivity is rising. That’s the dynamic landlords want: rising revenue per visitor.
Q4 2025 specifically:
Shopper traffic: +1.5% year-on-year
Tenants’ sales: +3.9% year-on-year
It’s accelerating, even into the seasonally softer Q4. Demand is holding up.
Rental reversion (FY25 overall): +7.8% across retail portfolio.
This is the metric that makes Singapore REIT investors smile.
FCT renewed or placed 439 leases covering 451,031 sf (17% of the portfolio). They pushed rents up 7.8% on an average-to-average basis. That’s strong. Here’s where it’s tightest:
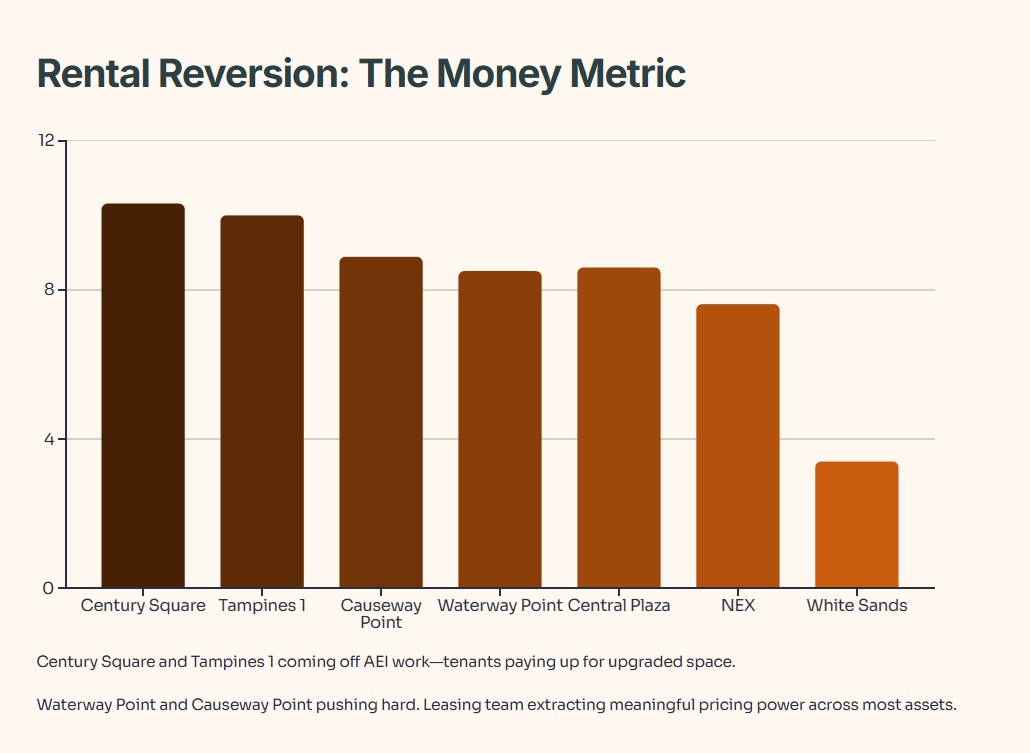
The leasing team is extracting meaningful pricing power across most assets. Century Square and Tampines 1 are coming off AEI work, so tenants are paying up for upgraded space. Waterway Point and Causeway Point (JV and wholly-owned flagship) are pushing hard too.
Occupancy cost ratio: 16.1% in FY25 (compared to 16.0% in FY24).
This is the ratio of gross rental paid by tenants to their sales turnover. It’s stable. That means even though rents rose, tenant sales grew fast enough to absorb the increase. Tenants aren’t getting squeezed. That’s sustainable.
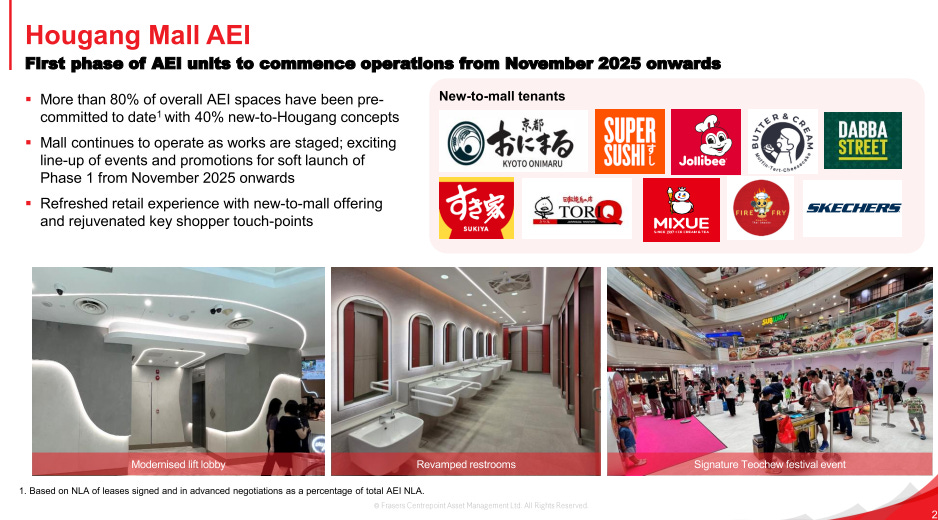
Slide 6: Hougang Mall AEI—The Expansion Play
Hougang Mall is the growth story. Let me outline what matters:
Scale: $51 million capex investment targeting ~7% ROI.
Timeline: On track to complete by September 2026.
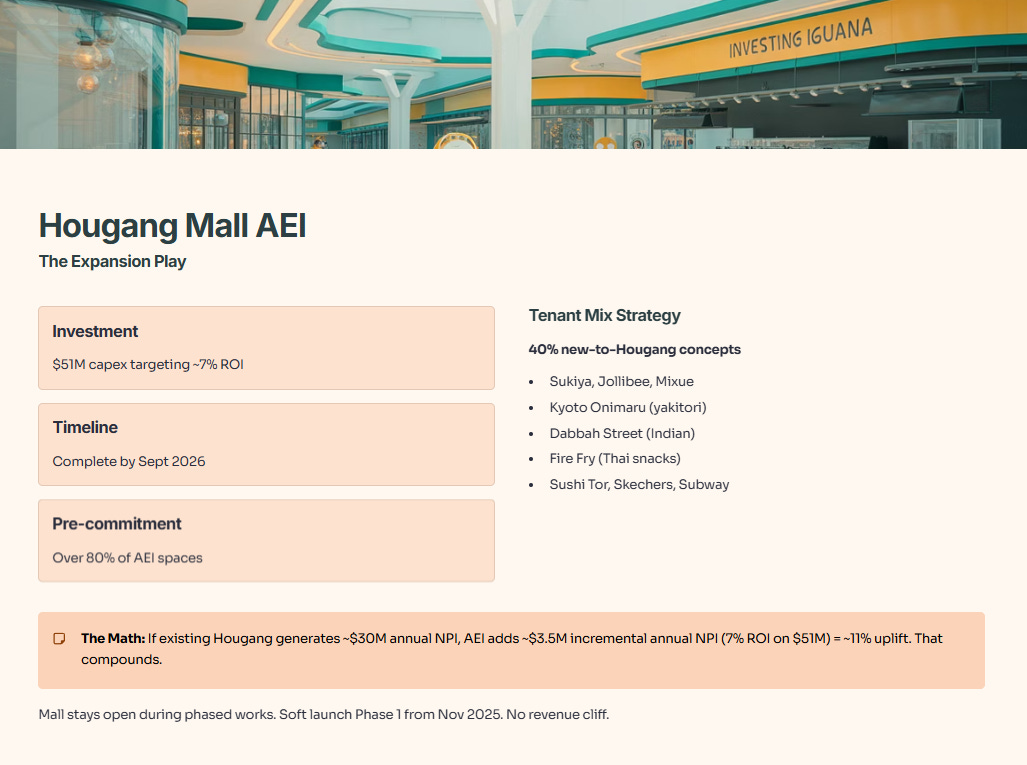
Pre-commitment: Over 80% of AEI spaces pre-committed. That’s huge. They’re not building blind and praying for tenants. The market is lined up.
Tenant mix strategy: 40% of new tenants are new-to-Hougang concepts. They’re curating. Concepts include: Sukiya, Jollibee, Mixue, Kyoto Onimaru (yakitori), Dabbah Street (Indian), Fire Fry (Thai snacks), Sushi Tor, Skechers, Subway. Leaning on F&B and casual dining refresh with some casual retail (Skechers).
Execution: The mall stays open and operational during phased works. Soft launch of Phase 1 from November 2025 onwards. No complete closure risk. No major revenue cliff.
The math: If the existing Hougang generates, say, $30 million in annual NPI and the AEI adds ~$3.5 million in incremental annual NPI (on a 7% ROI on $51 million), that’s an ~11% uplift to the property. That compounds.
Investment angle: This is accretive to medium-term distribution growth. Once it’s fully open in Sep 2026, you should see Hougang contribute meaningfully to FY27 earnings.
Slide 7: Portfolio Highlights—Quality & Diversification
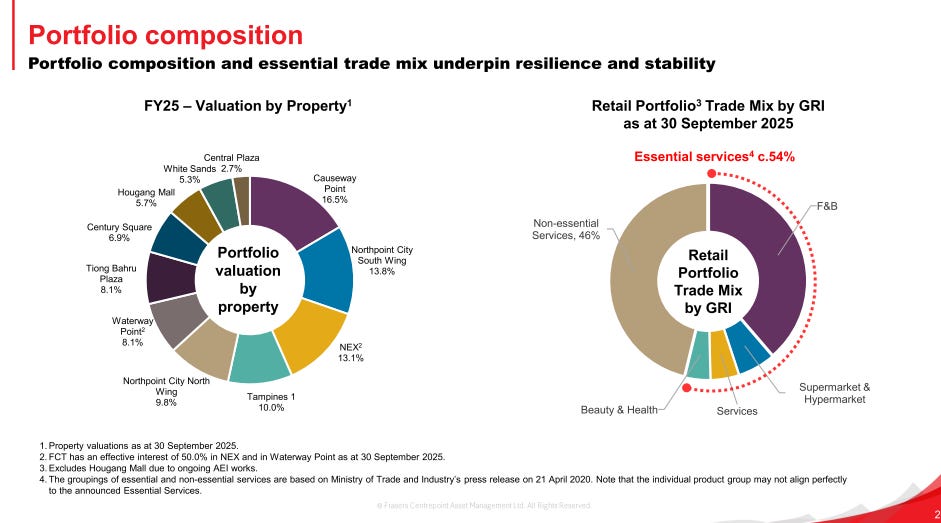
Portfolio composition by property value (as at 30 Sept 2025):
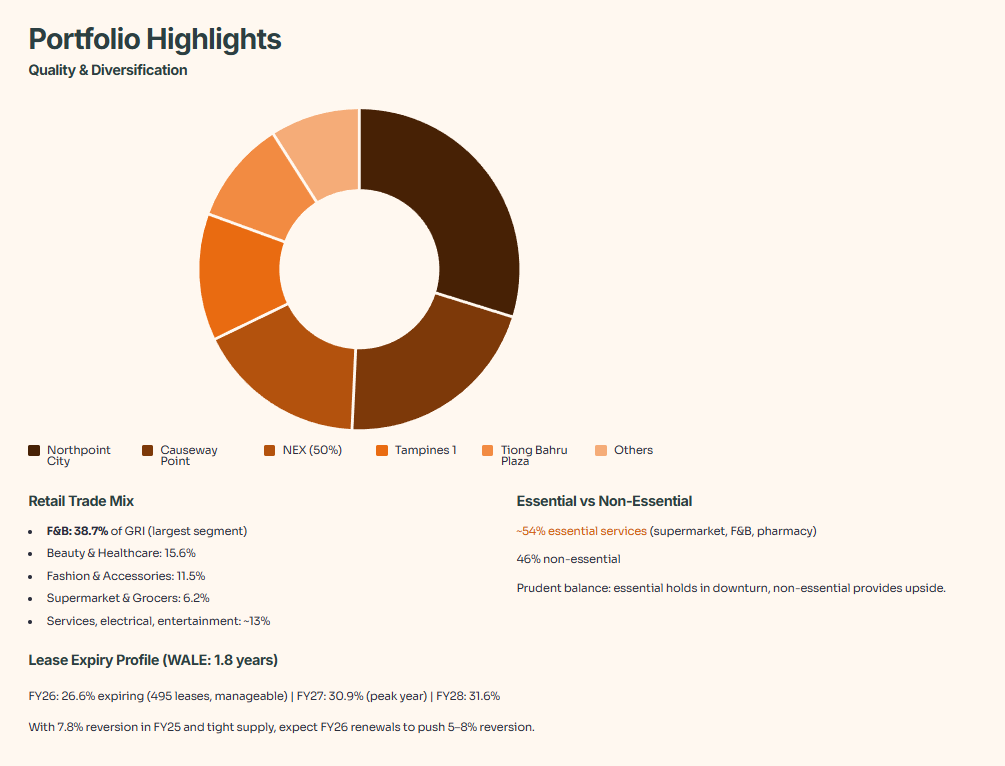
The top three properties (Northpoint North, Northpoint South, Causeway Point) represent ~52% of value. That’s concentration, but it’s in the best suburban malls. They have scale, traffic, and pricing power.
Retail trade mix:
F&B: 38.7% of GRI (Gross Rental Income). That’s the biggest segment. Casual dining, quick-service, food courts, etc.
Beauty & Healthcare: 15.6%
Fashion & Accessories: 11.5%
Supermarket & Grocers: 6.2%
Services, electrical, entertainment, education: ~13%
F&B dominance is a double-edged sword. Good: high traffic, steady demand, resilient tenants (Fairprice, Breadtalk, Kopitiam, etc.). Bad: if consumer sentiment flips, F&B can soften faster than apparel or services. But looking at tenants’ sales growth (+3.7% FY25), F&B tenants are thriving.
Essential vs non-essential split: ~54% essential services (supermarket, F&B, pharmacy), 46% non-essential. This balance is prudent. In a downturn, essential holds, and non-essential provides upside.
Lease expiry profile (WALE: 1.8 years):
Expiry% of Leased AreaNoteFY2626.6%Manageable; 495 leasesFY2730.9%Peak expiry year; normal patternFY2831.6%Back-loaded over 3 yearsFY299.4%Drop-offFY30+1.5%Long-term locked in
FY26 has ~26% expiring. That’s normal for a retail REIT. With 7.8% rental reversion achieved in FY25 and tight supply ahead, you’d expect FY26 renewals to push at least 5–8% reversion. That’s upside.
Slide 8: Capital Structure & Financial Position—The Safety Net
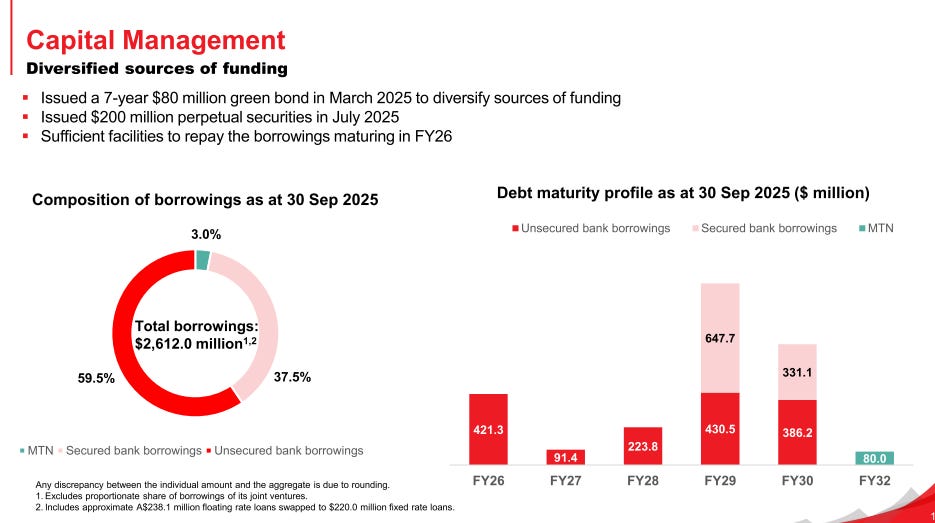
Total borrowings: $2.612 billion (as at 30 Sept 2025).
Composition:
59.5% Secured bank borrowings
37.5% Unsecured bank borrowings
3.0% MTN (Medium Term Notes)
Aggregate leverage: 39.6% (down from 38.5% at 30 Sept 2024).
This is healthy for a property REIT. MAS guidelines for REITs typically flag concern above 45%. FCT is prudent.
Cost of debt (all-in):
Year-to-date FY25: 3.8%
Q4 2025 (most recent quarter): 3.5%
Trend is improving. They’re refinancing and locking in better rates as Singapore’s monetary cycle eases.
Interest coverage ratio: 3.46x (FY25) vs 3.39x (June 2025).
This means NPI covers interest expense 3.46 times. That’s solid. A comfortable cushion; most rated REITs run 2.5–4.0x.
Debt maturity profile (as at 30 Sept 2025):
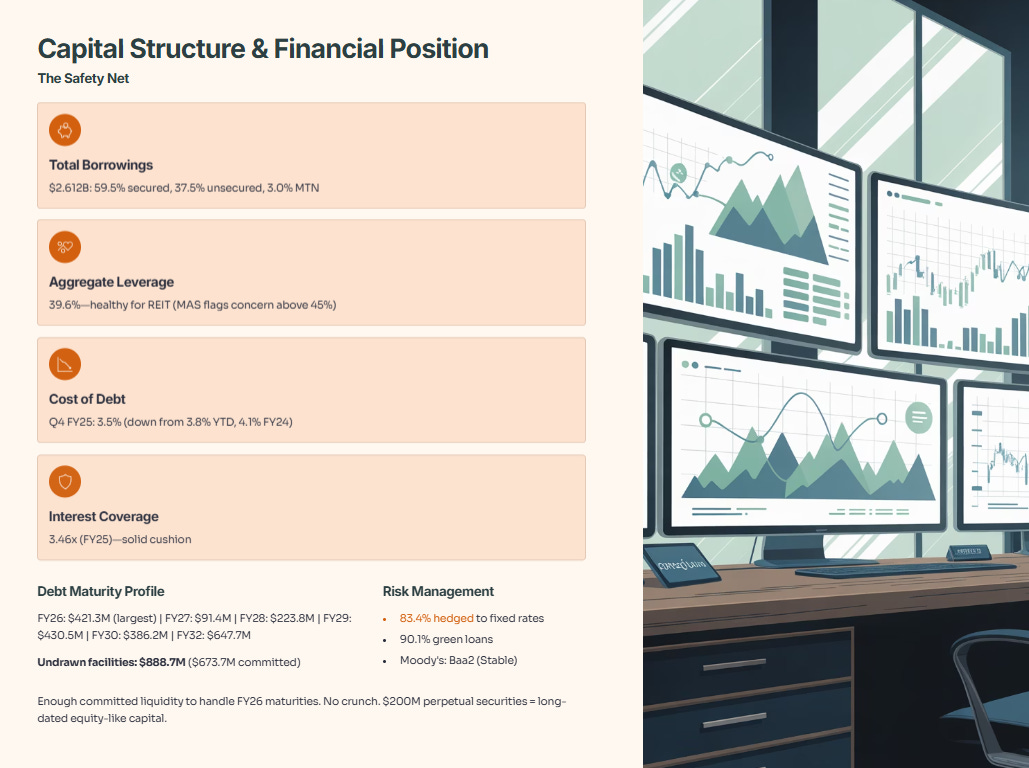
Undrawn facilities: $888.7 million (of which $673.7 million committed).
Translation: FCT has enough committed liquidity to handle FY26 maturities ($421.3M) and refinance as needed. They’re not in a crunch. The $200M perpetual securities issued in July 2025 gives them long-dated capital that counts as equity for regulatory purposes but sits below traditional debt on the liability waterfall.
Hedging: 83.4% of debt is hedged to fixed rates. That’s prudent. They’ve locked in their cost of funding and aren’t exposed to surprise rate spikes.
Green loans: 90.1% of borrowings are green-loan-qualified. FCT is aligning with ESG-conscious investor demand and potentially accessing cheaper green financing. That’s good capital management.
Moody’s rating: Baa2 (Stable). Investment grade. That matters for institutional and sovereign wealth fund buyers.
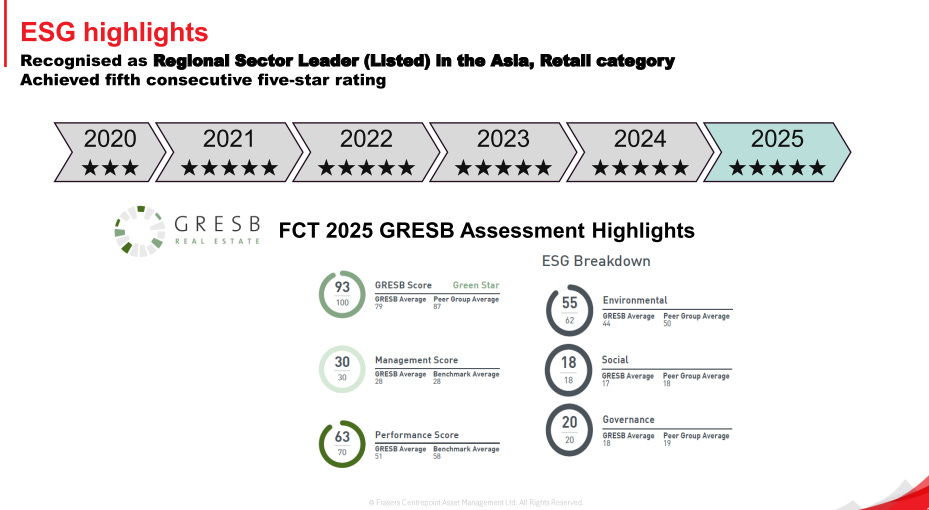
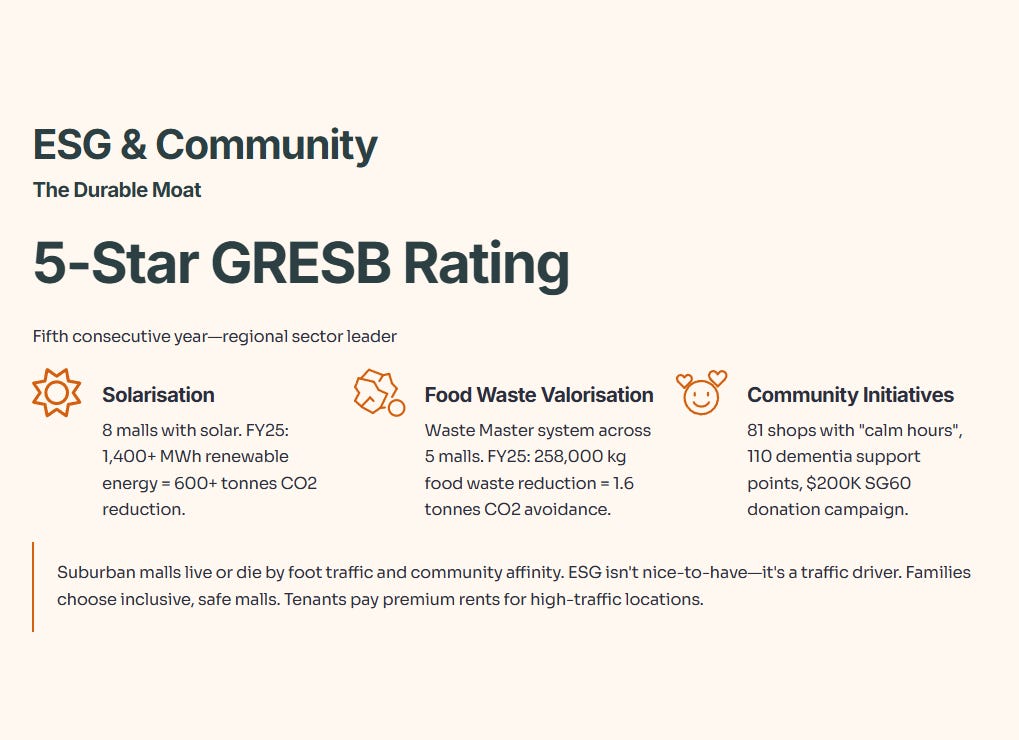
Slide 9: ESG & Community—The Durable Moat
This might sound like corporate fluff, but it’s not. ESG is where durable competitive advantages hide.
GRESB rating: 5-star (fifth consecutive year).
GRESB is the real estate industry’s sustainability benchmark. Five stars means FCT is a regional sector leader. That matters for:
Accessing institutional capital (many funds have ESG mandates)
Tenant recruitment (F&B and retail brands care about environmental credibility)
Risk mitigation (regulators increasingly focus on ESG)
Specific initiatives:
Solarisation: 8 malls now have solar installations. FY25 generated 1,400+ MWh of renewable energy = 600+ tonnes of CO2 emissions reduction. Over a decade, that’s compounding ESG impact and potential OpEx savings.
Food waste valorisation: Waste Master system deployed across 5 malls. FY25: 258,000 kg of food waste reduction = 1.6 tonnes of CO2 emissions avoidance. F&B tenants (38.7% of GRI) appreciate this. It’s a marketing story.
Community initiatives: Inclusion Champions programme (81 shops with “calm hours” for sensory needs), 110 designated dementia support points, $200,000 SG60 donation campaign. These create stickiness with the community and differentiate FCT’s malls as social hubs, not just shopping destinations.
Why this matters for investors:
Suburban malls live or die by foot traffic and community affinity. ESG and community engagement aren’t nice-to-haves. They’re traffic drivers. Families choose malls that feel inclusive and safe. Tenants pay premium rents for high-traffic locations. It’s a virtuous cycle.
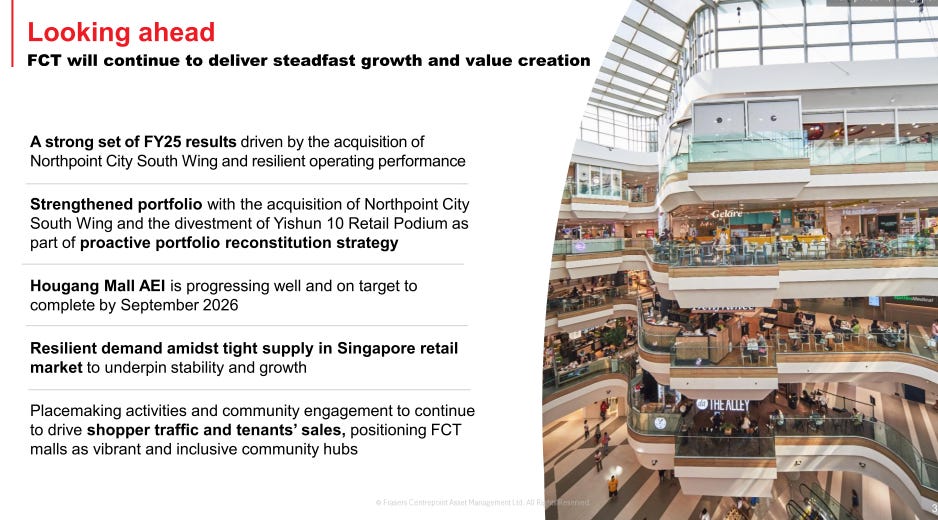
Slide 10: Looking Ahead—The Catalysts
What’s coming in FY26 and beyond:
