



Frencken Just Raised S$100 Million for Growth. A 30-Year-Old and a 60-Year-Old Should Read That Completely Differently.
Clean gearing, real earnings coverage, and a dividend that’s gone from 4.13 cents to 2.28 cents and back. Here’s what each number means to a different reader.
Two investors read the same Maybank report on Frencken this week. One is 30, building a growth portfolio with decades to ride out a semiconductor cycle. The other is 60, drawing down CPF and SRS, and needs the dividend to actually show up every year. Frencken’s own numbers, not the broker’s framing, are what actually decide which of them this stock is for.
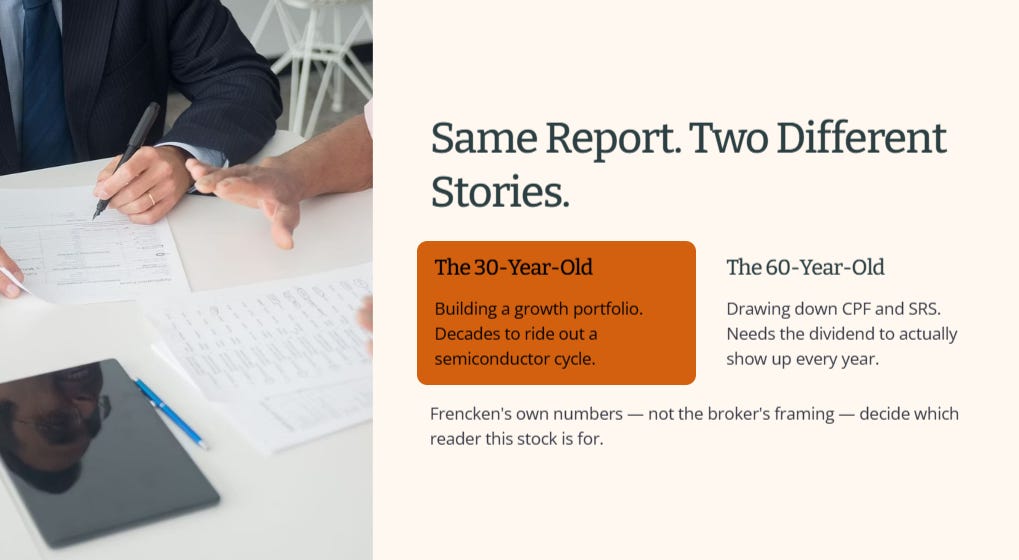
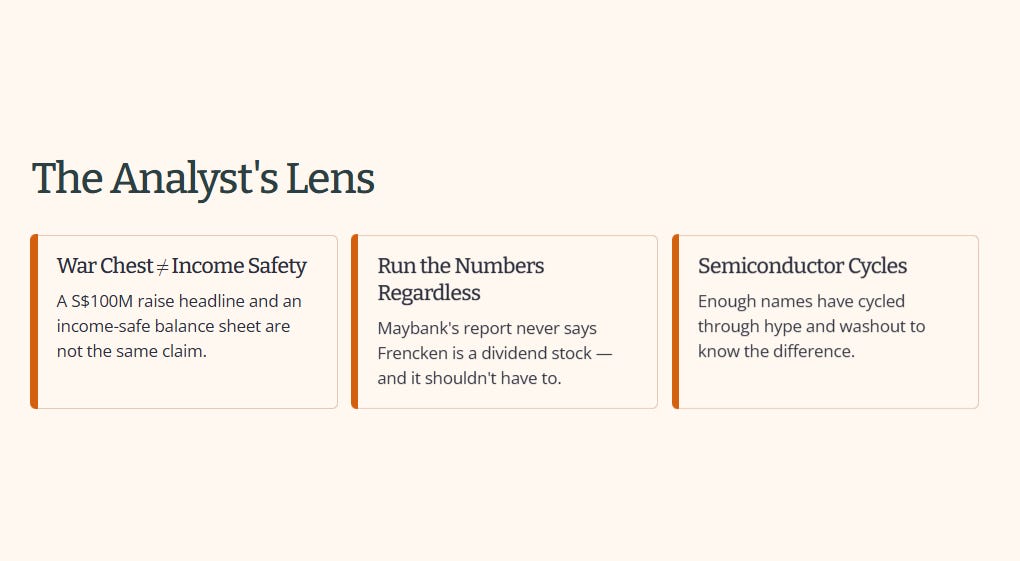
I’ve watched enough semiconductor names cycle through hype and washout to know that a “war chest” headline and an income-safe balance sheet aren’t the same claim, even when they’re describing the same S$100 million raise. Maybank’s report never says Frencken is a dividend stock, and it shouldn’t have to. But when a stock crosses my desk, I run the numbers regardless of which case the broker was actually making.

The Deal
Iggy’s Insight
What the 30-Year-Old Sees
What the 60-Year-Old Sees
The Balance Sheet, for Both Readers
What’s Next
The Full Forensic Picture
Financial Health Checklist
Dividend Trajectory (annual, 2017–2026, calendar declaration/payment years)
Valuation, single-stock basis (peer comparison omitted, no peer set pulled this pass)
Iggy’s Forensic Zone: Zone 5, Red Zone (Not an Income Vehicle, Sub-Floor Yield)
Iggy’s Insight
Iggy’s Elite Read
The Deal
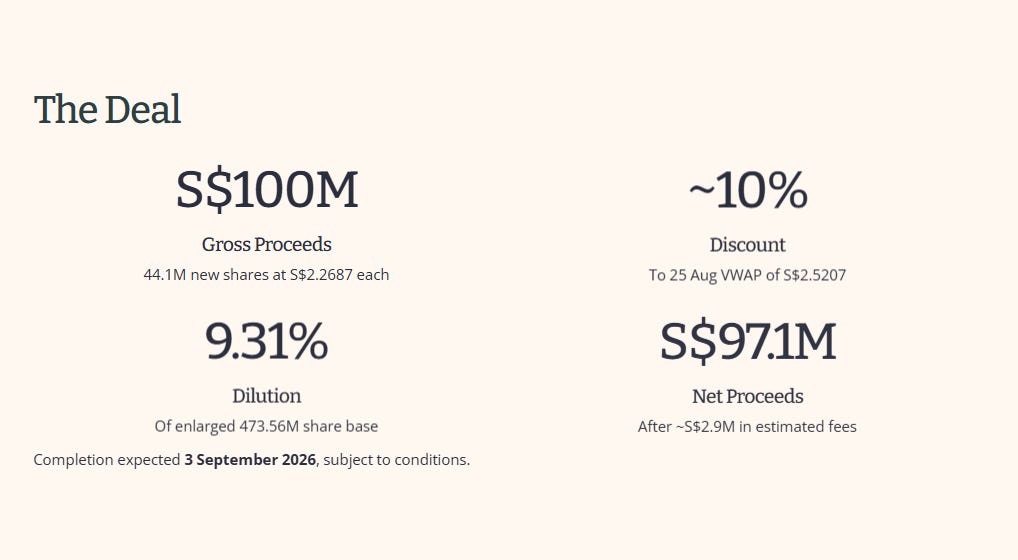
On 27 August 2026, Frencken announced a best-efforts placement of 44,081,591 new shares at S$2.2687 each, raising gross proceeds of roughly S$100 million, or approximately S$97.1 million net of an estimated S$2.9 million in fees. The issue price sits at a 9.997% discount to the 25 August volume-weighted average price of S$2.5207. The new shares represent roughly 10.27% of the pre-placement share base and about 9.31% of the enlarged 473.56 million-share base once a separate 150,000-share option allotment is included. Completion was expected 3 September 2026, subject to conditions.
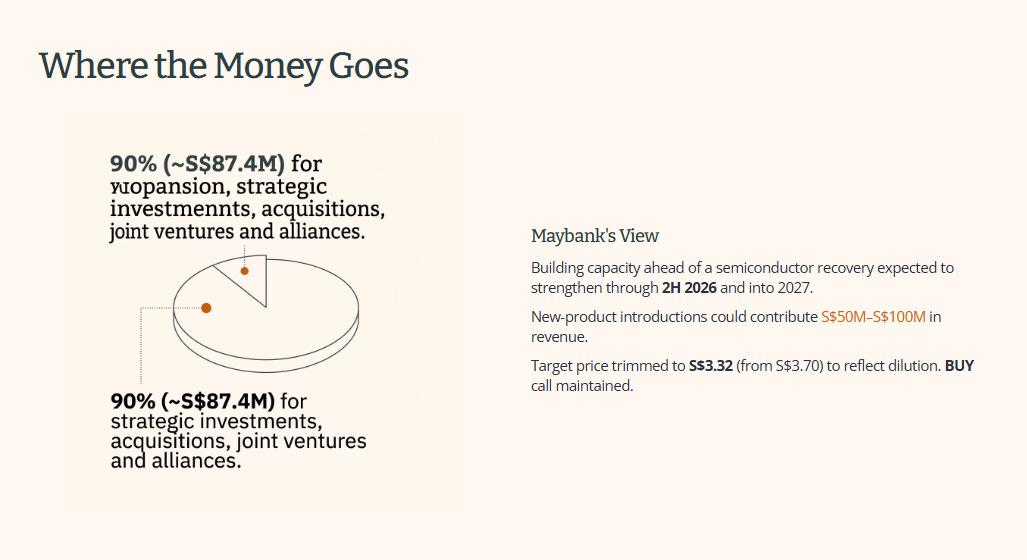
Of the net proceeds, roughly 90% (about S$87.4 million) is earmarked for expansion, strategic investments, acquisitions, joint ventures, and alliances broadly, not narrowly limited to any one segment, with the remaining 10% (about S$9.7 million) going to working capital or repayment of bank borrowings. Maybank’s report frames this as Frencken building capacity ahead of a semiconductor recovery it expects to strengthen through 2H 2026 and into 2027, with new-product introductions potentially contributing S$50 million to S$100 million in revenue, and trims its target price to S$3.32 from S$3.70 solely to reflect the dilution, keeping its BUY call intact.
Here’s the thing both readers need to sit with before going any further: this is money raised specifically to grow the business, not to fund or protect a dividend. Everything that follows from here reads differently depending on which of those two things you’re actually looking for.
What the 30-Year-Old Sees
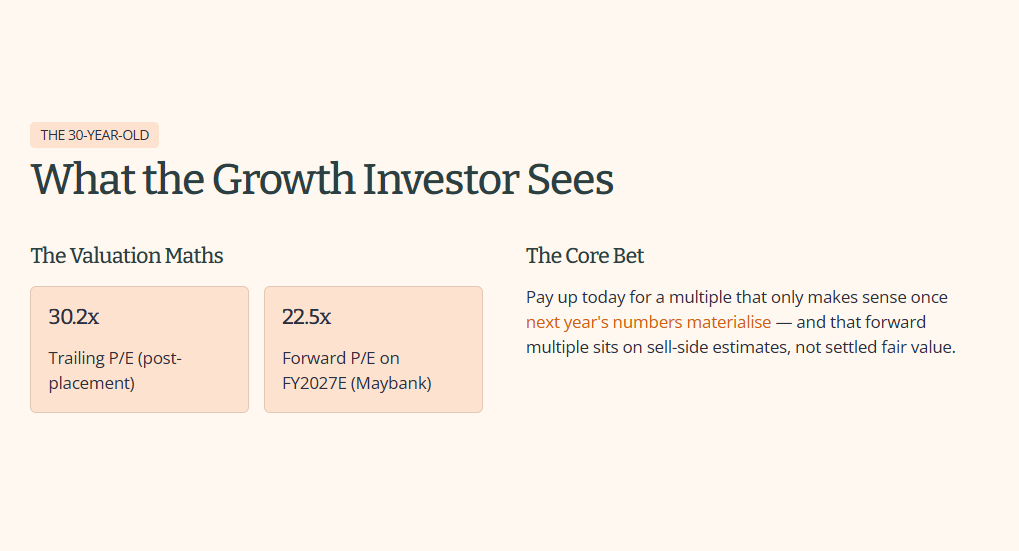
At S$2.45, Frencken trades at 30.2 times trailing earnings, using the enlarged post-placement share base, a rich multiple on its own. Maybank’s S$3.32 target is built on 22.5 times FY2027 estimated earnings instead, which only looks cheap if you believe the earnings actually arrive on schedule. That’s the entire growth case in one sentence: pay up today for a multiple that only makes sense once next year’s numbers materialize, and that forward multiple sits on the sell-side’s own estimates, not a settled fair value.
Worth stress-testing rather than accepting at face value. InvestingPro’s own fair value model puts Frencken at an average of S$1.90, with a range of S$1.66 to S$2.28, meaning the current S$2.45 price already sits above the top of that model’s range, implying roughly 22.6% downside on that basis alone. I’ll flag this range itself as unverified secondary data, since I couldn’t independently confirm the exact figures against a live InvestingPro page snapshot this pass.
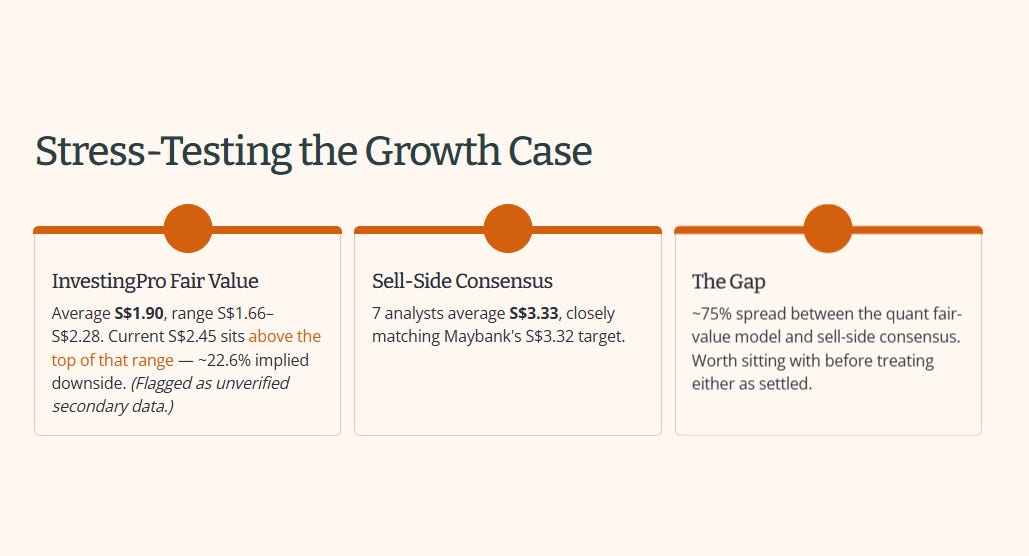
Meanwhile the sell-side analyst cluster averages closer to S$3.33, from 7 analysts, closely matching Maybank’s own target. Whether or not the InvestingPro range holds up to closer scrutiny, the gap between a quant fair-value model and the sell-side consensus is worth sitting with before treating either number as settled.

Semiconductor recovery calls have a real history of arriving a quarter or two later than the broker note that first called them, and a war chest raised at a near-10% discount is itself a signal that management wanted the capital in hand before the recovery is fully confirmed, not after. None of that makes the growth case wrong. It makes it a bet with real, checkable downside, not a sure thing dressed up as one.
🟪 Iggy’s Insight
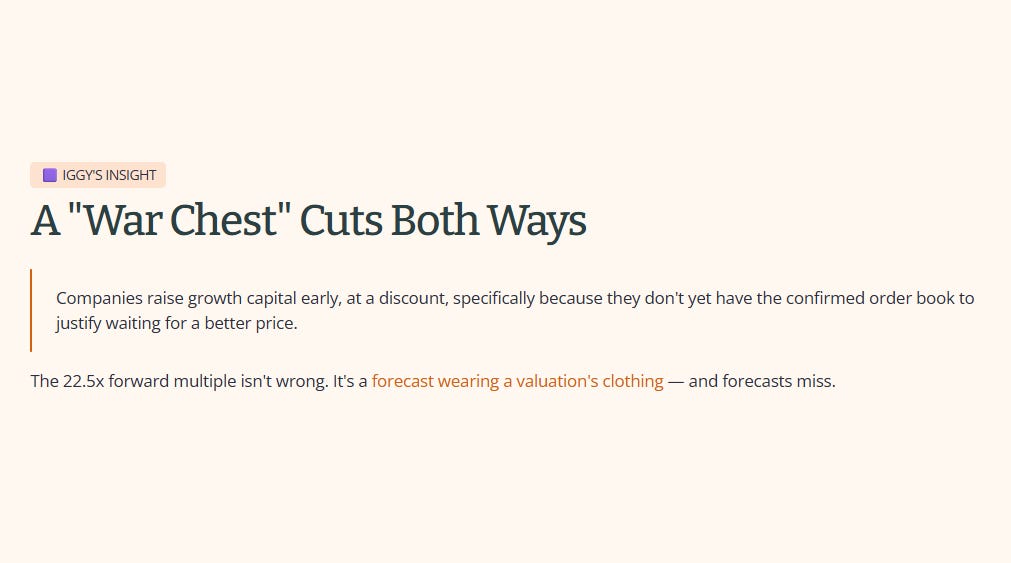
A “war chest” framing sounds unambiguously good until you ask what it’s actually a hedge against. Companies raise growth capital early, at a discount, specifically because they don’t yet have the confirmed order book to justify waiting for a better price. Frencken’s own management is pricing in some chance the recovery is real but not yet proven, which is exactly the same uncertainty a 30-year-old investor is being asked to accept on faith. The 22.5x forward multiple isn’t wrong. It’s a forecast wearing a valuation’s clothing, and forecasts miss.
What the 60-Year-Old Sees
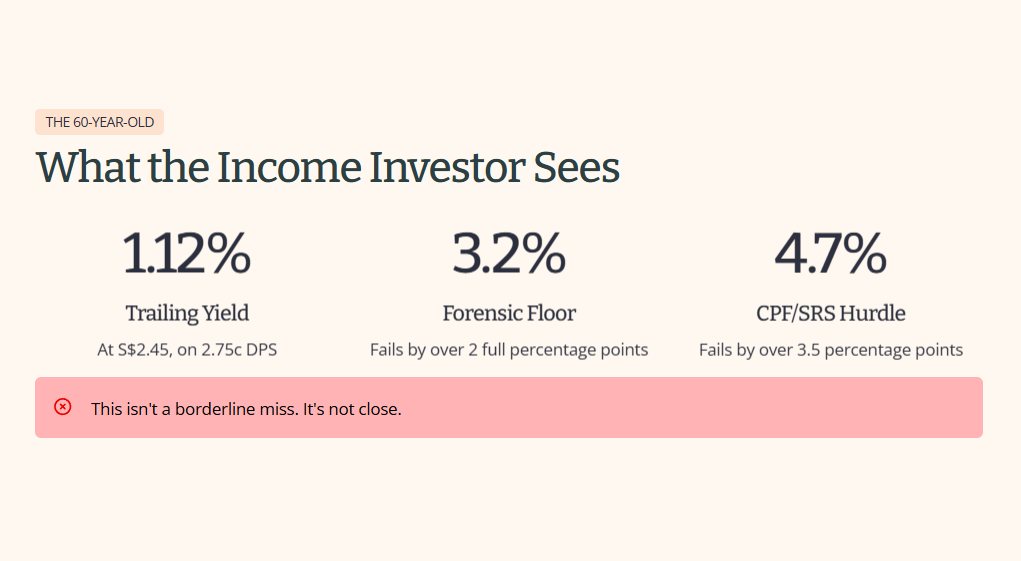
Here’s where the two readers stop looking at the same stock in any meaningful sense. At S$2.45, Frencken’s trailing dividend yield, based on the most recent declared dividend of 2.75 cents, is approximately 1.12%. That fails my 3.2% forensic yield floor by more than two full percentage points, and it fails the 4.7% income hurdle I use for anything meant to sit alongside CPF and SRS money by well over three and a half points. This isn’t a borderline miss. It’s not close.
The dividend history explains why. Frencken has paid a dividend every year since at least 2017, moving from 1.20 cents that year to 1.66 cents in 2018 (plus a one-off 0.73 cent special that year, excluded from any normalised yield calculation), 2.14 cents in 2019, up to 3.00 cents in both 2020 and 2021, peaking at 4.13 cents in 2022. Then it fell, to 3.64 cents in 2023 and 2.28 cents in 2024, before recovering to 2.61 cents and, most recently, 2.75 cents, declared 27 February 2026 and paid 14 May 2026. A note on the years themselves: these labels follow calendar declaration and payment dates, not Frencken’s own financial-year reporting cycle, which runs to 31 December, so don’t expect the “2025” and “2026” labels here to match the FY labels you’d see inside the company’s own annual report.
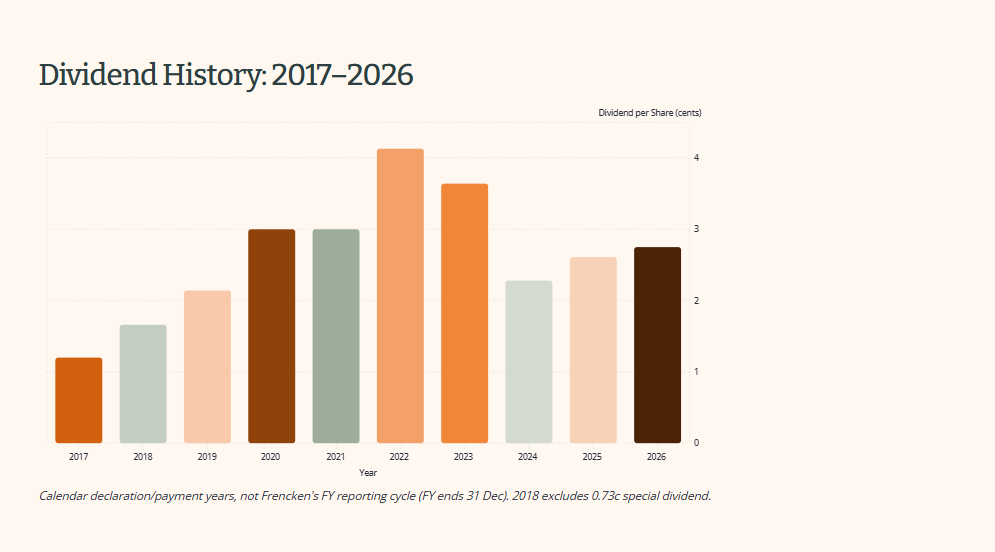
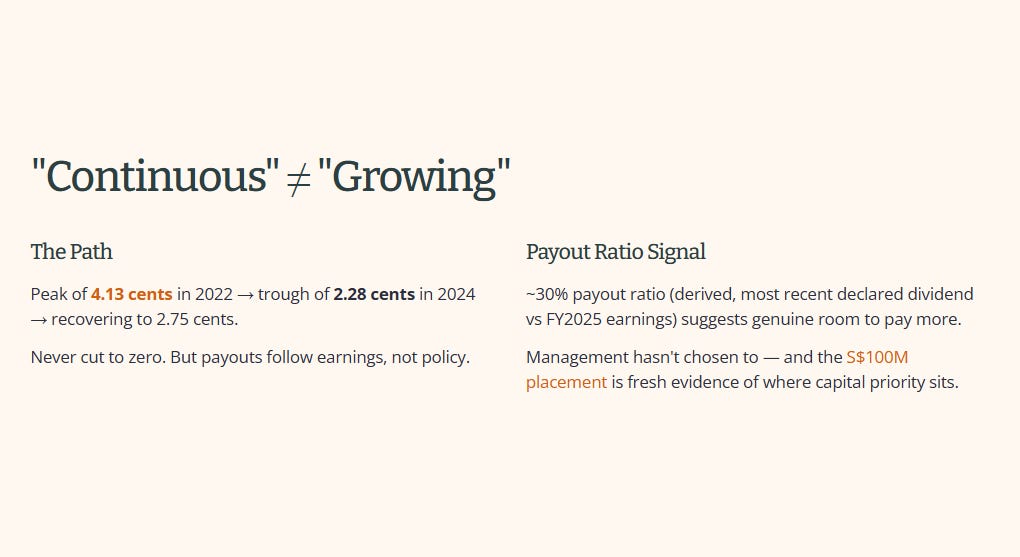
That’s a real, unbroken payment record, and I want to be fair to it: this isn’t a company that’s ever cut its dividend to zero or suspended it. But “continuous” and “growing” are different claims, and Frencken’s path from 4.13 cents down to 2.28 cents and back up to 2.75 cents is the second half of this piece’s subtitle for a reason. A payout ratio in the neighborhood of 30%, derived from the most recent declared dividend against FY2025 earnings rather than confirmed against an exact EPS figure, suggests genuine room to pay more if management chose to. They haven’t chosen to, and this S$100 million placement is fresh evidence of where the capital priority actually sits.
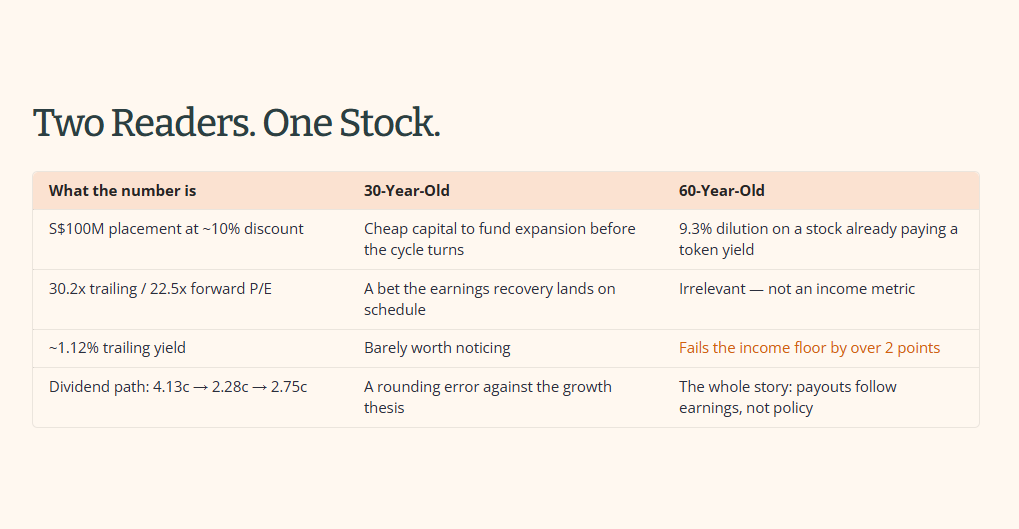
Look at the same four numbers through two different lenses and Frencken stops being one stock with one verdict. The S$100 million placement, the 30-times multiple, the 1.12% yield, and the dividend’s round trip from 4.13 cents down to 2.28 cents and back, none of that changes. What changes is which of those four rows actually matters to you. A 30-year-old reads three of them as noise and one as the whole thesis. A 60-year-old reads it exactly backwards. Neither reading is wrong. They’re just answering different questions with the same filing.
No One Pays Him To Be Right
The Verdict Doesn’t Change Because The Bill Needs Paying. Every finance channel says “unbiased.” Most of them also have a sponsor, an affiliate link, or a subscriber count to protect deciding what gets softened. Iggy doesn’t. This channel started as, and still is, a passion project, not an income source. That’s not a slogan, it’s the actual reason a Zone 4 verdict stays a Zone 4 verdict even when the stock is one half of Singapore holds.
Iggy’s Elite Investors aren’t paying for faster access to opinions that were always going to be diplomatic anyway. You’re paying for the version of this analysis that exists because it doesn’t need to please anyone, zero-day forensic breakdowns, the complete “Red Zone” watchlist, and institutional-grade cheatsheets built without a single sponsor’s name attached to the verdict.
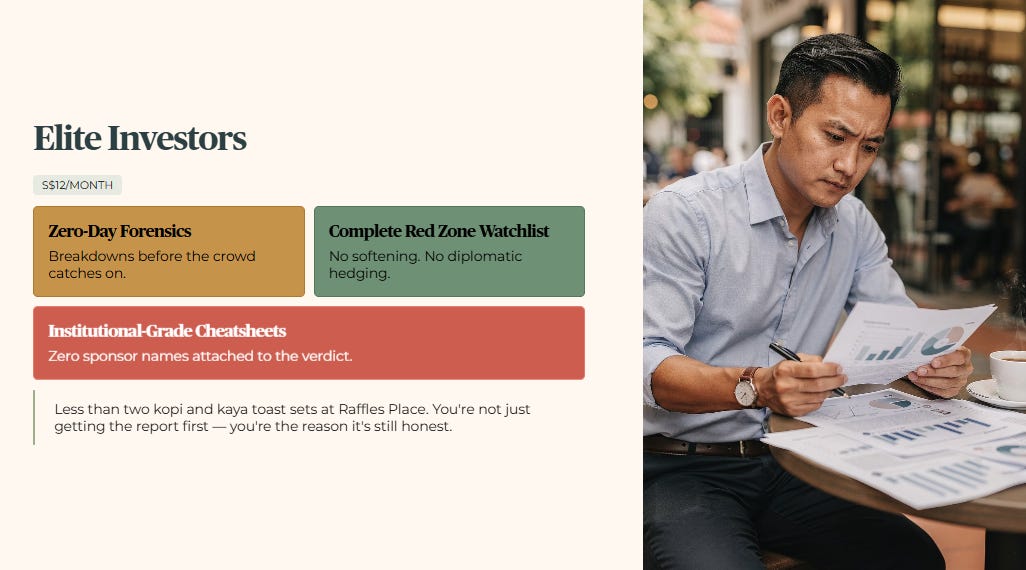
For S$12/month, less than two kopi and kaya toast sets at Raffles Place, you’re not just getting the report first. You’re the reason it’s still honest.
The Balance Sheet, for Both Readers
Whatever your reason for looking at Frencken, the balance sheet itself isn’t the problem, and it’s worth being precise about that rather than letting the yield miss color everything else.
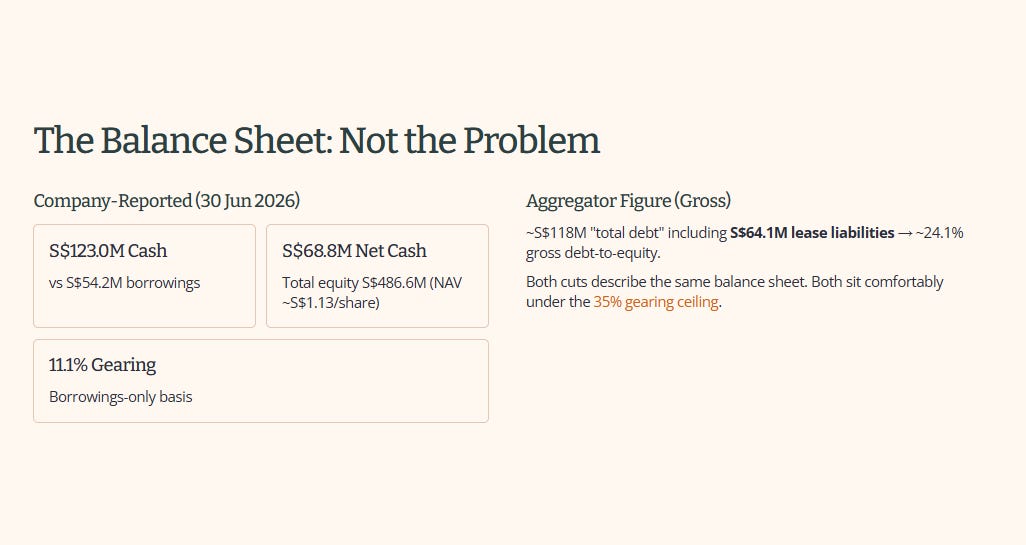
Two different cuts of the debt picture exist depending on the source, and the gap between them is now reconciled rather than left open. On the company’s own 1H2026 reporting (30 June 2026), cash sits at S$123.0 million against borrowings of S$54.2 million, a net cash position of S$68.8 million, and total equity of S$486.6 million (NAV of roughly S$1.13 per share). On a borrowings-only basis, that’s gearing of approximately 11.1%.
A separate aggregator figure of roughly S$118 million in “total debt” against the same equity base produces a higher gross debt-to-equity reading of about 24.1%, and the gap is explained by roughly S$64.1 million in lease liabilities that the aggregator’s broader “total debt” figure includes and the company’s own “borrowings” line does not. Both cuts, correctly understood, describe the same underlying balance sheet, and both sit comfortably under my 35% gearing ceiling regardless of which one you use.
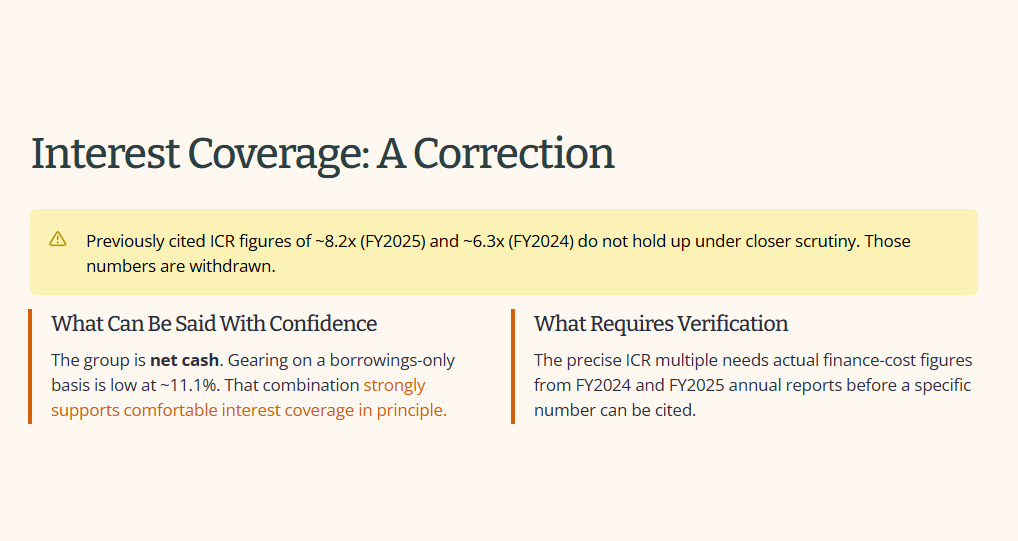
On interest coverage, I want to walk back something from the last version of this piece rather than repeat it. I’d previously cited FY2025 and FY2024 interest coverage ratios of roughly 8.2x and 6.3x. Those figures don’t hold up against a closer look at the underlying operating profit and finance-cost lines, and I’m not confident enough in either the numerator or the denominator to publish a specific multiple. What I can say with confidence: the group is net cash, gearing on the borrowings-only basis is low at roughly 11.1%, and that combination strongly supports comfortable interest coverage in principle. The precise ICR multiple itself needs the actual finance-cost figures from Frencken’s FY2024 and FY2025 annual reports before I’d cite a number, and I’d rather tell you that plainly than carry forward a figure I can’t stand behind.
🔒 What’s Next
The gearing numbers above clear my ceiling with real margin on either cut. The zone verdict below explains why a clean balance sheet still doesn’t make this an income holding, and what that distinction actually means for two readers with two different jobs to do with their money.
