



HDB Resale Prices Dipped for a Third Quarter. Three Questions Before You Read Anything Into 0.1%
HDB’s final figures confirm a third dip, smaller than its first estimate. Here is what the number measures, how small a move of this size is, and whose decisions it touches.
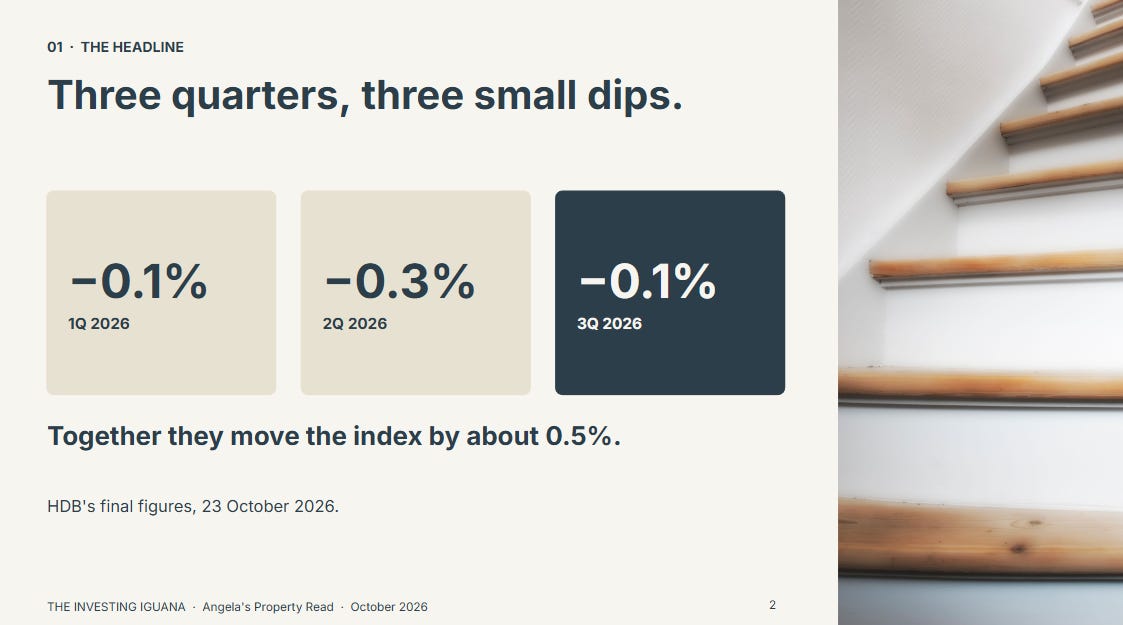
HDB’s final figures, published on 23 October, say resale flat prices fell 0.1% between July and September, the third quarterly dip in a row. Three weeks earlier its first estimate had said 0.2%. The three dips were 0.1%, 0.3% and 0.1%, which together move the index by about 0.5%. On an illustrative flat worth SGD 600,000, that is about SGD 3,000, spread over nine months.
Two kinds of reader will open this: one who owns a flat and has no plans to move, and one weighing a sale, a downsize or helping a child buy. Both will have seen the headline about a third dip, and both are entitled to ask what it means for them. I read HDB’s full release for the third quarter, its first estimate and its earlier quarterly releases, and I take no view on whether anyone should buy or sell. What I can do is show what the number measures, how big it is, and whose decision it touches.
What This Piece Does
It sets out what the index measures, and how the first estimate of 0.2% became a final 0.1%.
It works through three questions: what the number measures and how final it is, how large 0.1% is beside the last seven quarters and the number of flats sold, and whose decision it touches.
It puts the moves in dollars on an illustrative flat, with my own arithmetic labelled as mine.
The first two questions are free to read. The third, where the numbers meet a decision, is in the members’ half. This piece takes no view on any flat, any purchase or any sale. Nothing here is a recommendation.

What This Piece Does
Question 1: What Is This Number Measuring, and How Final Is It?
What does an index level mean?
How did the first estimate change?
Angela’s Observation
Question 2: How Big Is 0.1% Next to Everything Else?
What do seven quarters look like in one table?
Why did more flats sell in a quarter when the index eased?
What the Paid Half Adds
Question 3: Whose Decisions Does a 0.1% Dip Touch?
What does it change for the owner who is staying put?
What does it change for the owner thinking of selling or downsizing?
What does it change for a family helping a child buy?
Angela’s Observation
What I Am Watching Next, Without Predicting
Iggy’s Forensic Read
Sources
Question 1: What Is This Number Measuring, and How Final Is It?
What does an index level mean?
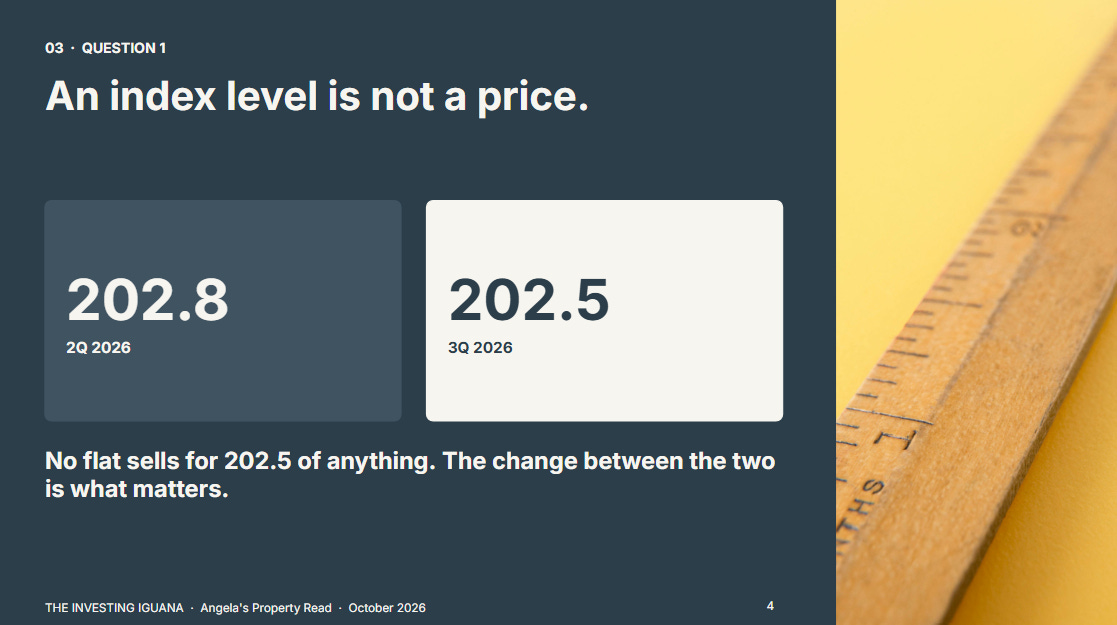
The Resale Price Index is HDB’s measure of how resale flat prices across the island have moved from one quarter to the next. It is an index level, not a price. The third quarter reads 202.5 and the second quarter read 202.8, and no flat sells for 202.5 of anything. What matters is the change between the two, a fall HDB reports as 0.1%. (On the rounded levels, 202.5 against 202.8 is about 0.15%. HDB works from unrounded figures, so I use its 0.1%.)
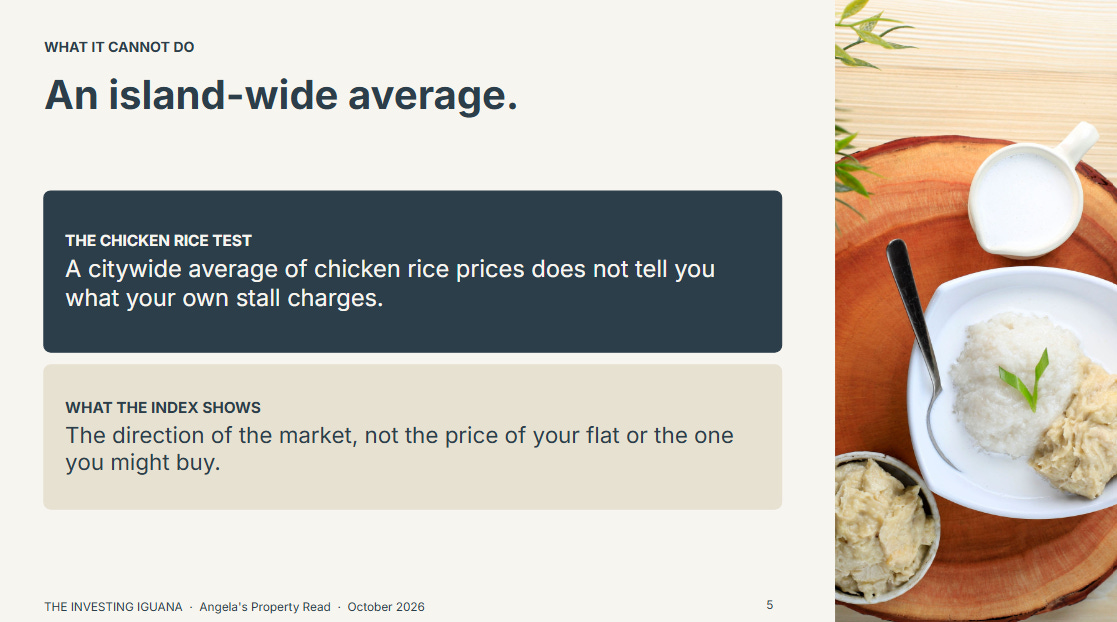
That also tells you what the index cannot do. It describes the island as a whole, the way a citywide average of chicken rice prices describes Singapore without telling you what your own stall charges. It shows the direction of the market. It does not show the price of the flat you own or the one you might buy.
How did the first estimate change?
HDB publishes the figure twice. The flash estimate comes out at or just after the end of the quarter (1 October for this one) and is built from the resale transactions registered up to a cut-off date. The full figures follow roughly three weeks later, once the remaining transactions are in.
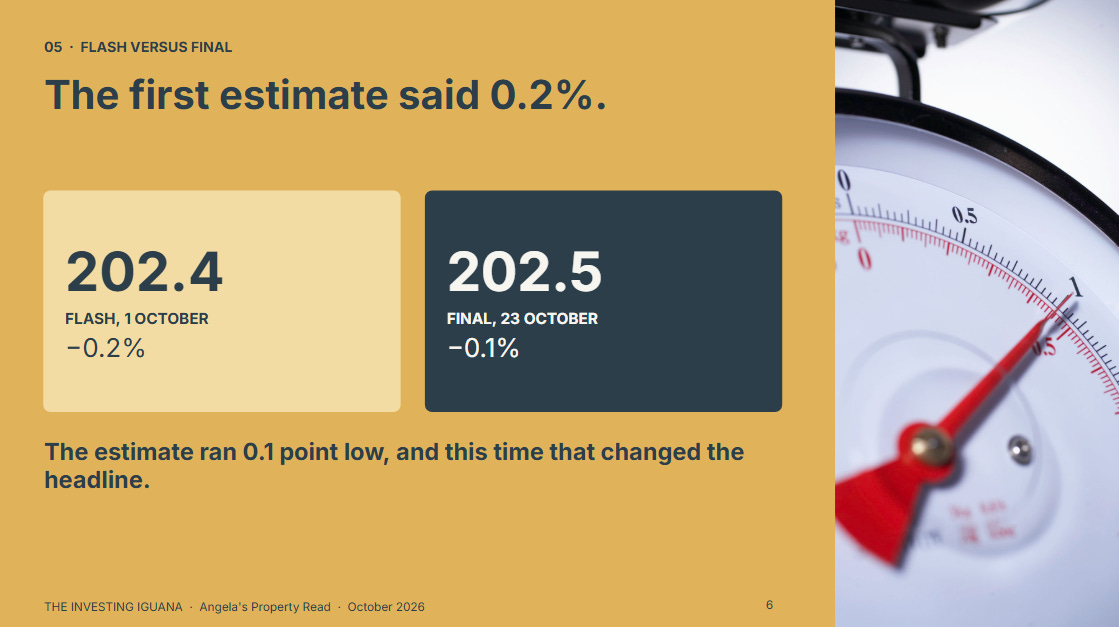
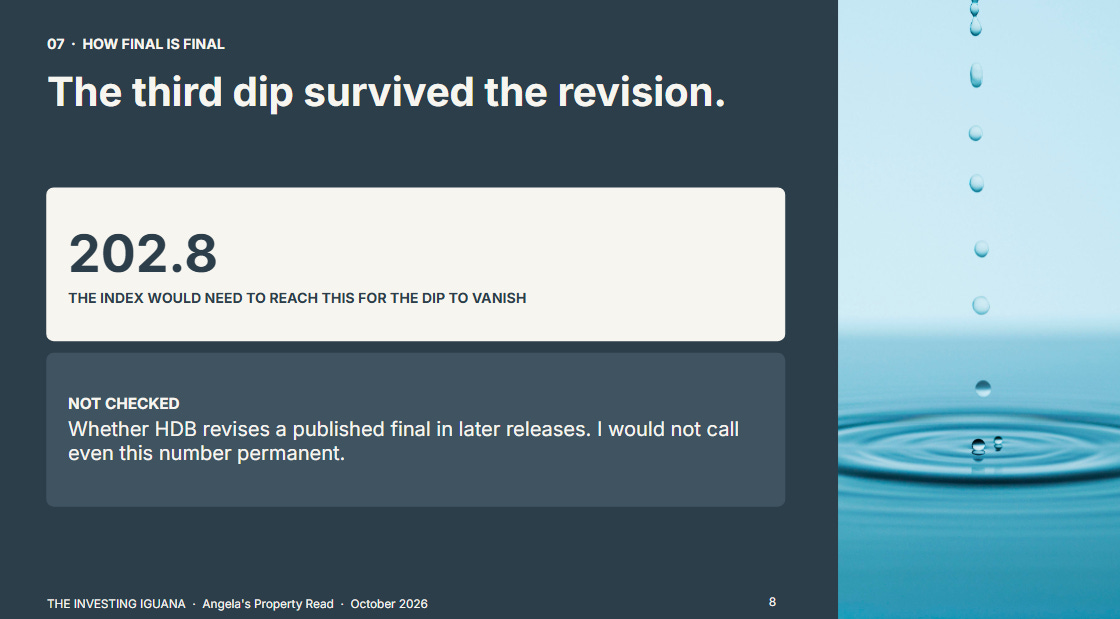
For this quarter the flash estimate was 202.4, a fall of 0.2%. The full release on 23 October gave 202.5, a fall of 0.1%. The estimate was 0.1 point too low, and this time that changed the headline percentage. The record on the three quarters before is closer than that sounds, but not identical. The fourth quarter of 2025 read 203.6 in both the flash and the final, and the first quarter of 2026 read 203.4 in both. The second quarter of 2026 was 202.7 in the flash and 202.8 in the final, so it was also revised up by 0.1 point, though the reported change stayed at -0.3%. The third dip survived the latest revision. For it to have vanished, the index would have needed to reach 202.8, the second quarter’s level.
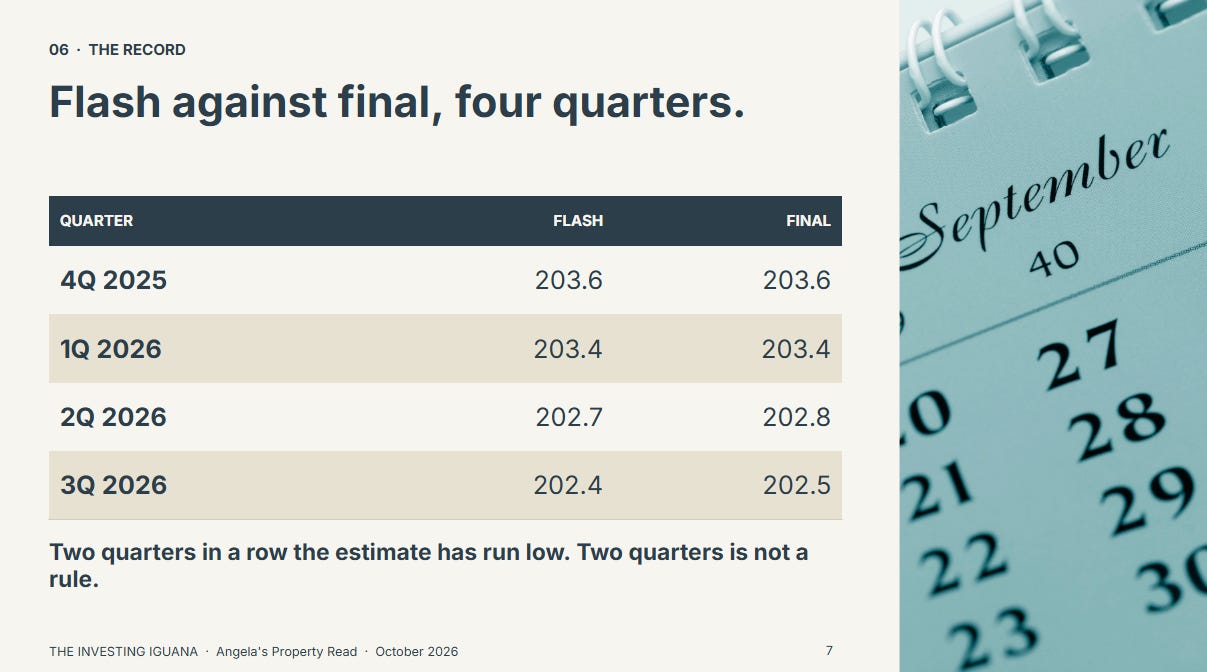
The pushback I expect is fair: if the estimate has now run slightly low two quarters in a row, why trust the final? The answer is that the final is built from more transactions, and the moves were one-tenth of a point each time. Two quarters is not a rule, and I did not check whether HDB revises a published final figure in later releases, so I would not call even this number permanent.
🟠 Angela’s Observation
When I counted tablets in the pharmacy, a first count was good enough to start the next step, and nothing left the counter before a second count. The flash estimate felt like that first count. Its headline had matched the second count three times running, and this time the second count came back one-tenth different. What I notice is how quickly the word estimate drops out of the retelling. By the time a figure reaches the kopitiam, nobody says flash any more, and nobody mentions the revision either. Do I check the final number before I pass it on, or only when I dislike the first one?
That settles how much weight the number can bear. The next question is how big it really is.
Question 2: How Big Is 0.1% Next to Everything Else?
What do seven quarters look like in one table?
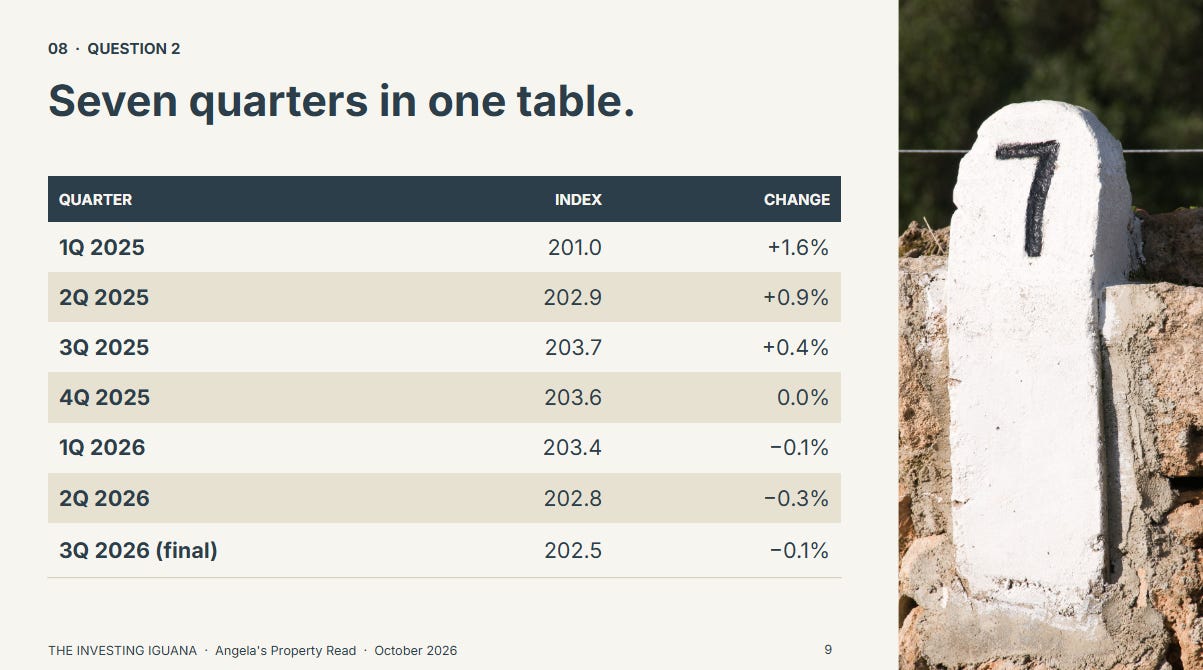
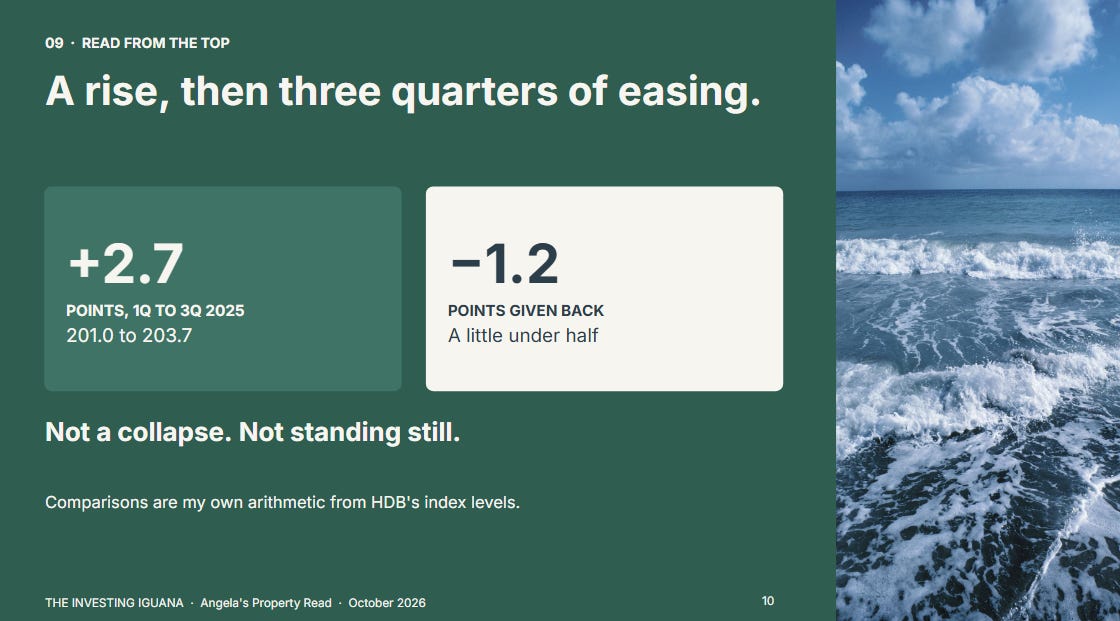
Read from the top, the three dips look different from how the headline presents them. The index rose 2.7 points between the first and third quarters of 2025, from 201.0 to 203.7. It has since given back 1.2 points, a little under half of that rise. It now sits 0.6% below the third quarter of 2025 and 0.7% above the first quarter of 2025. Those comparisons are my own arithmetic from HDB’s index levels. A fair description is a market that rose for a year and has eased for three quarters, not one that has collapsed and not one that has stood still.
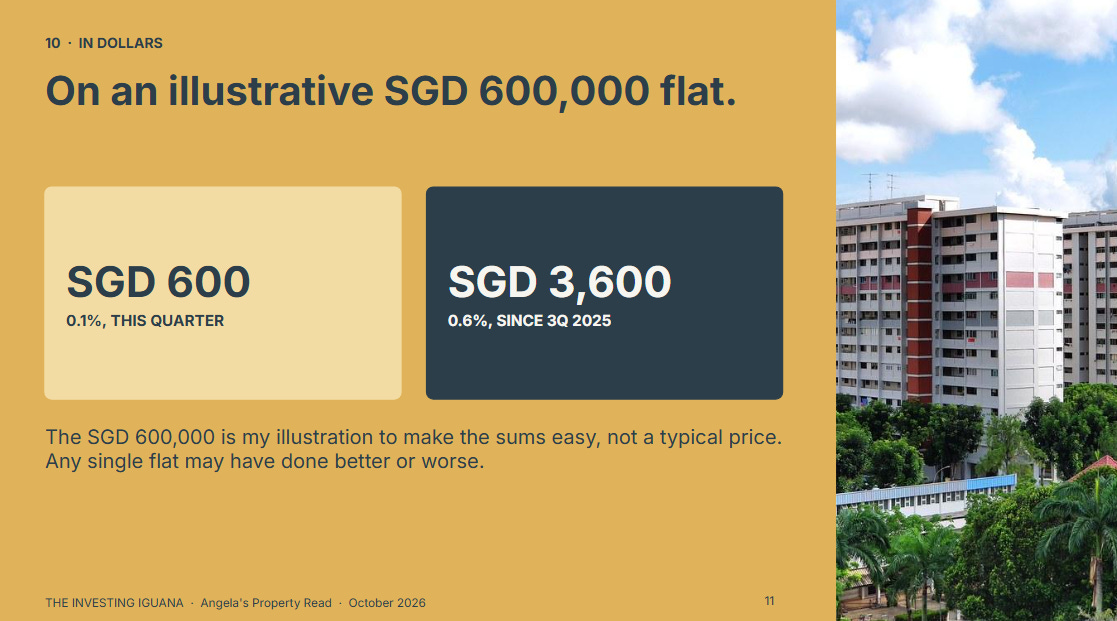
In dollars, on a flat worth SGD 600,000, a figure I chose to make the sums easy and not because it is a typical price, 0.1% is SGD 600 and the full 0.6% is about SGD 3,600. The index is an average, so any single flat may have done better or worse.
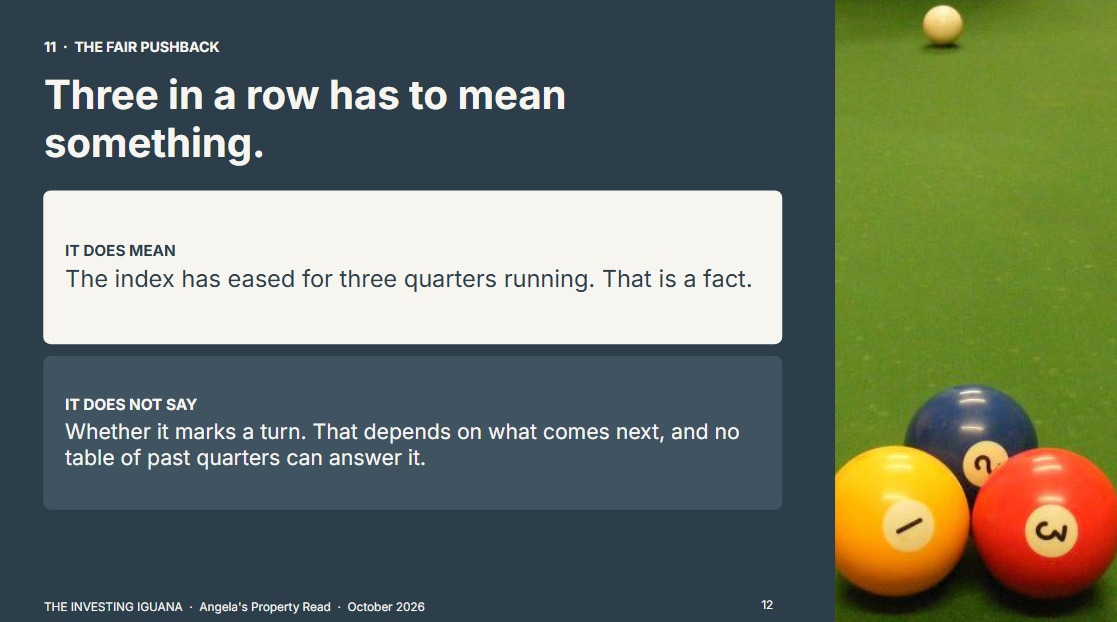
The pushback here is the obvious one: three in a row has to mean something. It does. It means the index has eased for three quarters running, which is a fact. Whether it marks a turn depends on what comes next, and no table of past quarters can answer that.
Why did more flats sell in a quarter when the index eased?
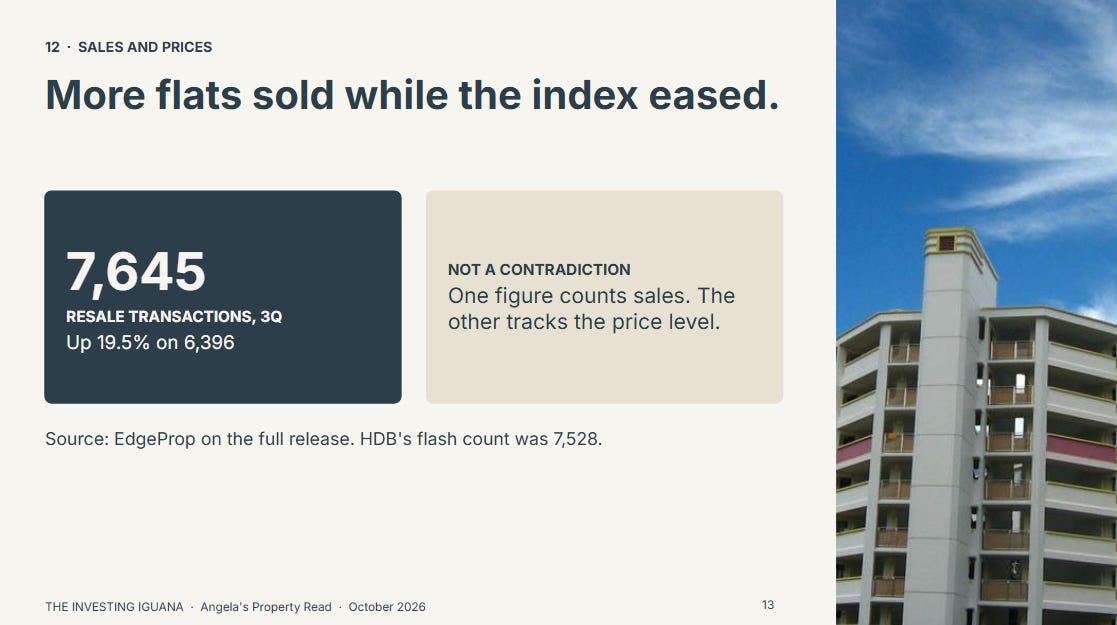
HDB’s first estimate counted 7,528 resale transactions up to its cut-off, 17.7% more than the 6,396 in the second quarter. EdgeProp’s report on the full release puts the quarter at 7,645, up 19.5%. More flats changing hands while the index eases is not a contradiction, because one figure counts sales and the other tracks the price level.
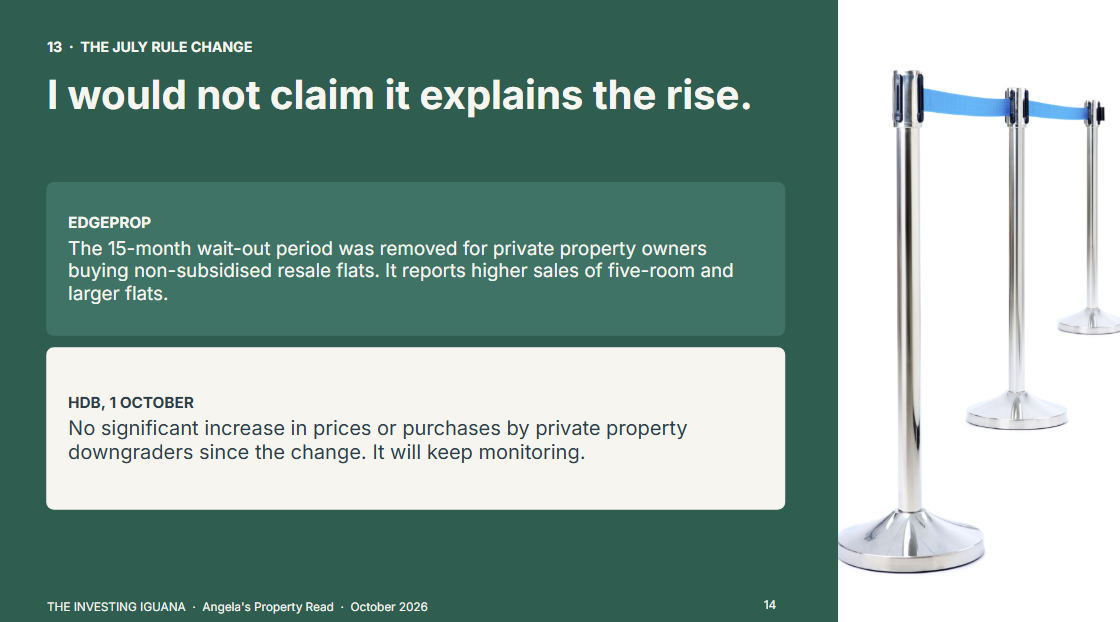
EdgeProp reports that a rule change took effect in July: the 15-month wait-out period was removed for private property owners and former private property owners buying non-subsidised resale flats, and the report says this supported higher sales of five-room and larger flats. HDB’s own statement, as reported by Yahoo News Singapore on 1 October, is that it has not seen a significant increase in the prices and number of resale flats purchased by private property downgraders since the change, and that it will keep monitoring. So I would not claim the rule change explains the rise. One quarter of higher sales does not make a trend, just as one dip does not.
What the Paid Half Adds
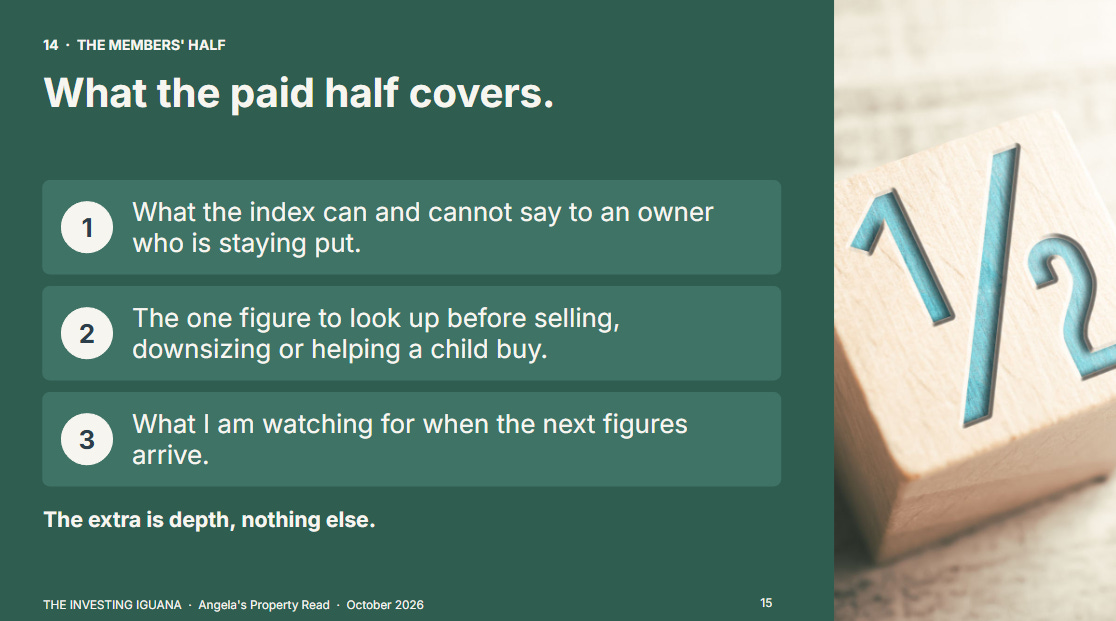
The free half explains the number. The paid half puts it to work: what the index can and cannot say to an owner who is staying put, to an owner thinking of selling or downsizing, and to a family helping a child buy, including the one figure I would look up before any of them acts and the questions I would put to HDB. It also sets out what I am watching for when the next figures arrive. The extra is depth, nothing else.
The Substack Only Plan, US$8/month, gives the full written analysis, portfolio walkthroughs and analyst cheatsheets.
The YouTube Only Plan, S$5/month, gives the full-length Members Edition video.
The YouTube/Substack Combo, S$12/month, gives all of it.

🔒 What’s Next
The 0.6% fall since the third quarter of 2025 is an island-wide average, and no owner sells at an average. The next section shows which kinds of owner that figure helps and which it misleads.
