

How I Actually Read a Financial Report (Using a REIT That's Failing One Number)
A walkthrough of the balance sheet, income statement, and cash flow, using Keppel DC REIT as the worked example.


Most retail investors read a financial report by checking one number: the yield. Keppel DC REIT’s yield clears my hurdle comfortably, sitting above five percent against my 4.7% minimum. And I still can’t call it a clean pass.
That gap, between “the yield looks fine” and “the report actually clears,” is the entire reason I don’t stop at yield. I get versions of the same question constantly: which number actually matters, and how do you even find it. So let’s walk through how I actually read a financial report, section by section, using a real REIT in my coverage as the example, so you can run the same process on the next name in your own portfolio.

Whether you’re working with CPF or SRS money where every basis point of risk needs justifying, or with capital you’ve deliberately set aside because you can tolerate more volatility, the process below is the same. Only the conclusion you draw from it changes.

The Balance Sheet: What The Company Owns And Owes
The Income Statement: Is The Growth Real
The Number That Doesn’t Live On Either Statement
Iggy’s Forensic Zone: Zone 4, Caution.
The Occupancy Trap
Cash Flow: The One Statement That’s Harder To Fake
Reading The Statements In The Right Order
Try This On Your Own Holdings
What I’m Actually Watching Next
The Balance Sheet: What The Company Owns And Owes
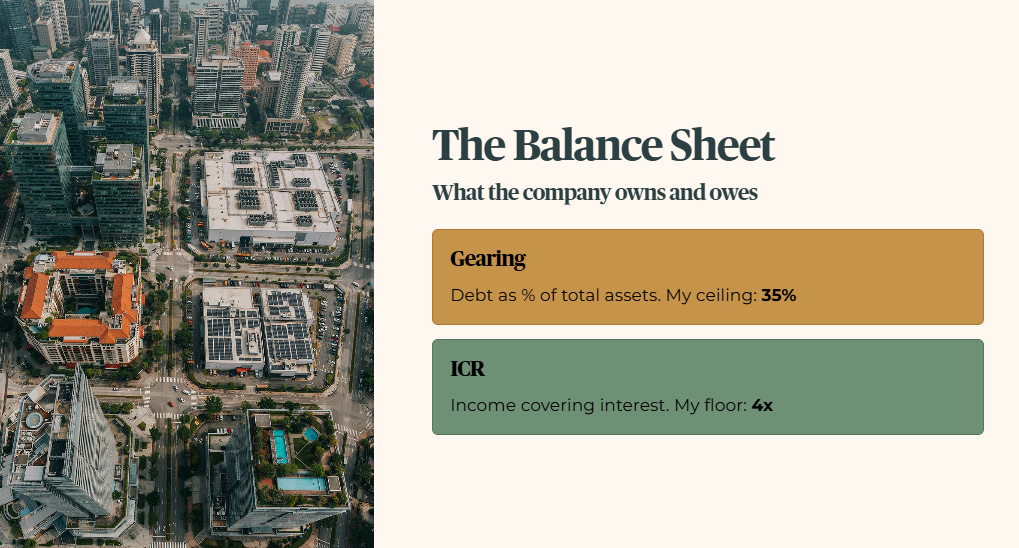
A REIT’s balance sheet answers one question before any other: how much of this portfolio is actually funded by debt, and how exposed is that debt to rising rates.
Two numbers do almost all the work here. Gearing, the proportion of total assets funded by borrowing, tells you how much of the ship is underwater if asset values fall or refinancing gets expensive. I use a 35% ceiling. Above that, a REIT starts losing flexibility exactly when it needs it most, in a downturn, when refinancing costs spike and asset sales happen at the worst possible time.
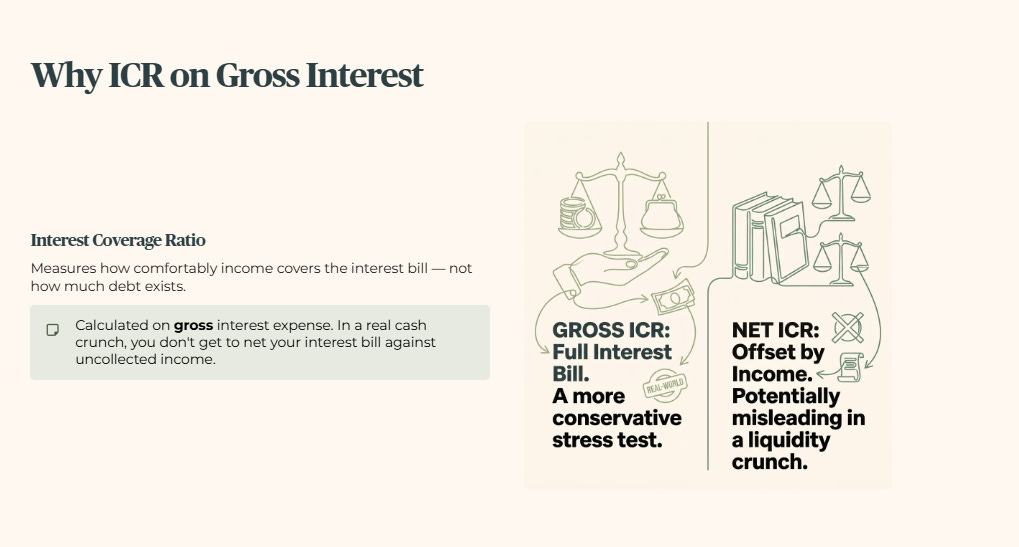
Interest coverage ratio, ICR, tells you something different: not how much debt exists, but how comfortably the REIT’s income covers the interest on it. I calculate this on gross interest expense, not net, because in a real cash crunch you don’t get to net your interest bill against income you haven’t collected yet. I use a 4x floor.
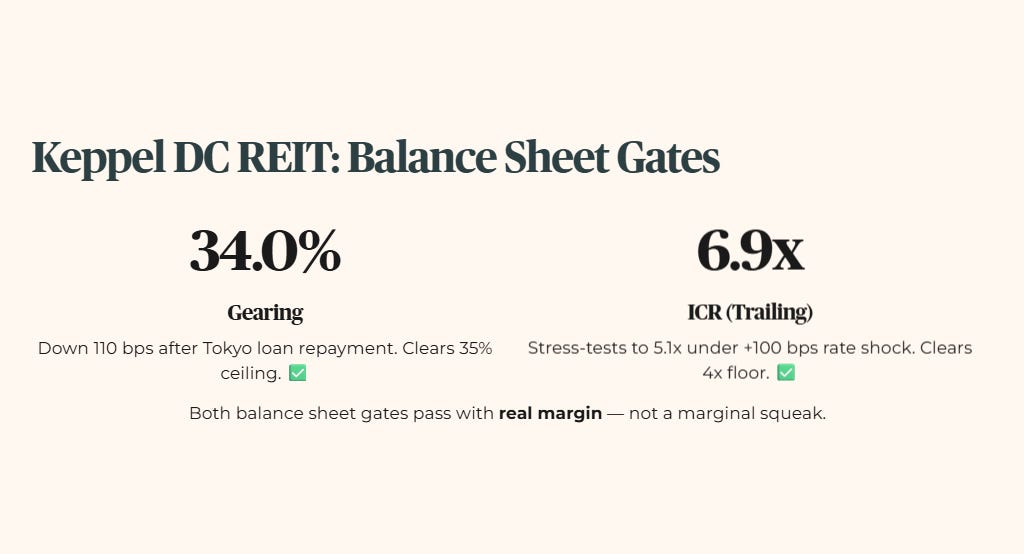
Keppel DC REIT’s gearing sits at 34.0%, having actually improved 110 basis points from the prior quarter after repaying a Tokyo data centre loan tied to a consumption tax obligation. That clears the ceiling. ICR sits at 6.9x trailing, comfortably above the floor, and stress-tests to 5.1x even under a hypothetical 100 basis point rate shock. Both balance sheet gates pass with real margin, not a marginal squeak.
If you stopped reading here, you’d conclude this REIT is structurally sound. You’d be right, as far as the balance sheet goes. But the balance sheet is a snapshot of debt and assets. It says nothing about whether the properties themselves are actually earning their keep.
The Income Statement: Is The Growth Real
This is where most retail investors get misled, not by fake numbers, but by real numbers that don’t mean what they look like they mean.
Keppel DC REIT’s distribution per unit for the first half of 2026 rose 11.3% year on year. That’s a genuinely strong headline. The question I always ask next is: where did that growth actually come from. Was it organic, meaning existing properties earning more rent through real demand and repricing, or was it manufactured, meaning a sponsor injected cash, or the REIT sold an asset and distributed the proceeds as if it were income.
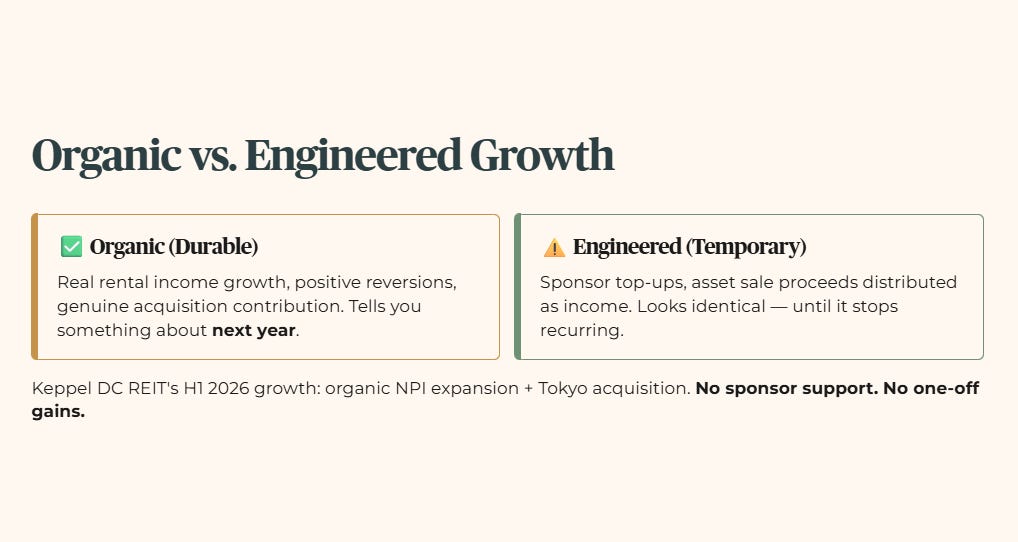
In this case, the manager attributes the growth to organic net property income expansion, positive rental reversions, and the contribution from a Tokyo data centre acquisition completed earlier in the year, with no sponsor support or one-off gains disclosed in the result. That distinction matters enormously. A REIT that grows its distribution through genuine rental income growth is telling you something durable about the business. A REIT that grows its distribution through a one-time capital injection is telling you nothing about next year.

I call artificially inflated yield “Engineered Yield” precisely because it looks identical to organic growth on the surface, right up until the sponsor top-up or asset sale stops recurring, and the distribution quietly resets lower with nobody quite explaining why. Keppel DC REIT’s growth this period doesn’t carry that flag. That’s a genuine point in its favour.
The Number That Doesn’t Live On Either Statement
Here’s the part that surprises people. The number that’s actually failing this REIT right now doesn’t appear on the balance sheet or the income statement at all. It’s an operating disclosure: occupancy.
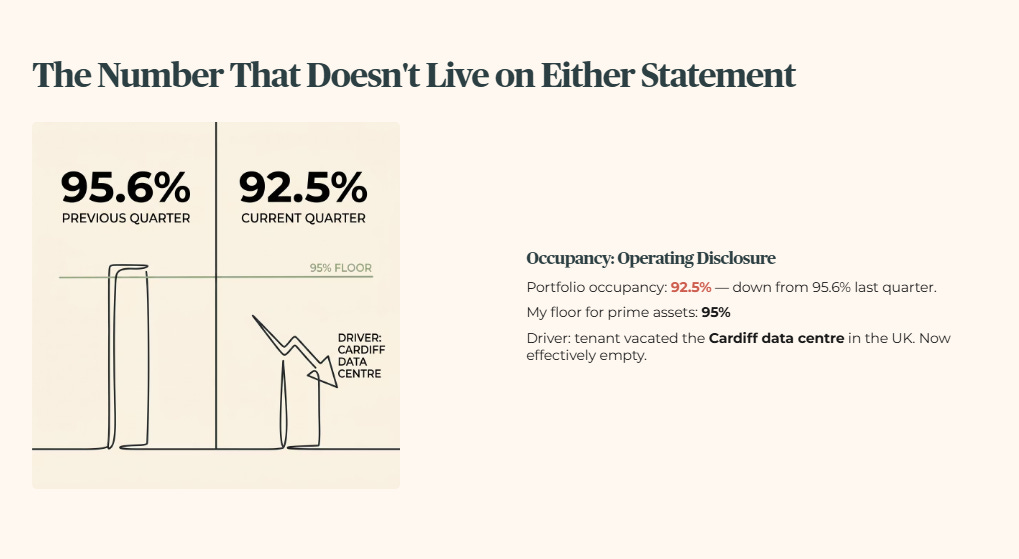
Keppel DC REIT’s portfolio occupancy sits at 92.5% by lettable area, down from 95.6% just one quarter earlier. My floor for prime assets is 95%. This isn’t a rounding miss. The driver is specific and traceable: a tenant vacated the REIT’s Cardiff data centre in the UK, which now sits effectively empty.
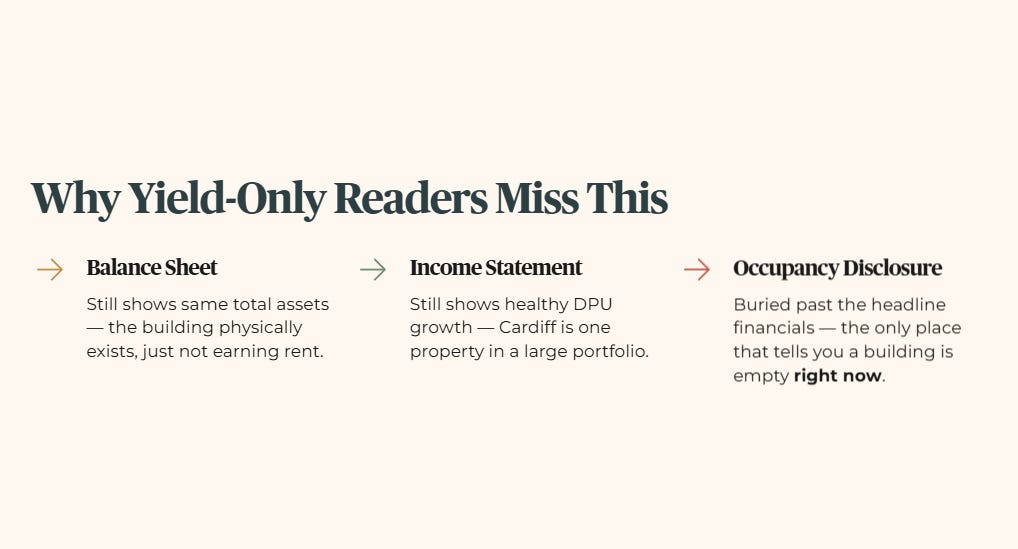
This is exactly the kind of number a yield-only read would never catch. The balance sheet doesn’t show an empty building, it shows the same total assets it showed last quarter, because the asset still physically exists, it’s just not earning rent. The income statement, at the REIT level, still shows healthy distribution growth this period, because Cardiff is one property in a much larger portfolio and the vacancy hasn’t fully worked its way through the numbers yet. Only the occupancy disclosure, buried well past the headline financials, tells you a specific building is sitting empty right now.
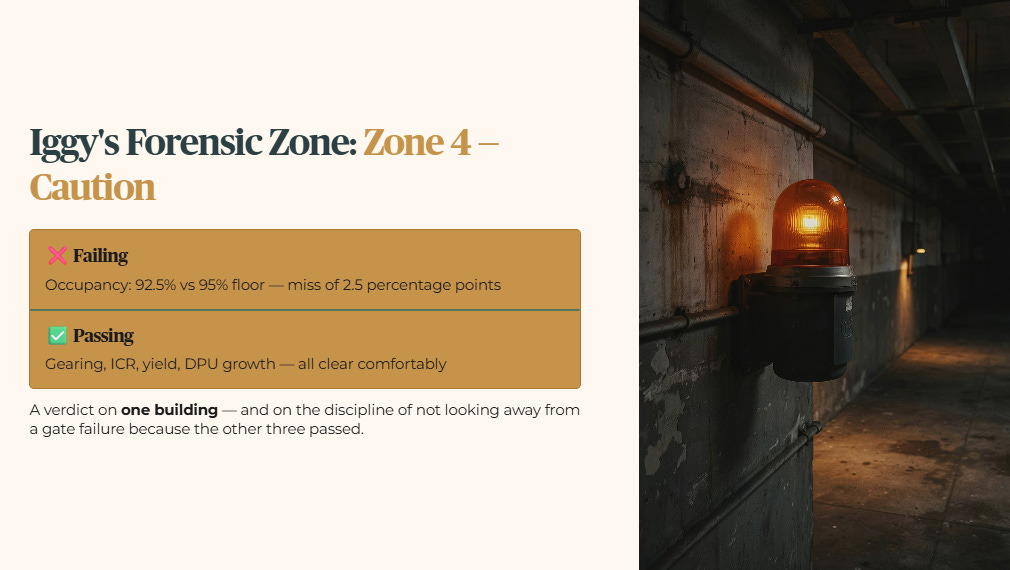
Iggy’s Forensic Zone: Zone 4, Caution. A single hard gate is failing here, occupancy, by 2.5 percentage points against the 95% floor. Everything else, gearing, ICR, yield, distribution growth, clears comfortably. I want to be direct about what that zone label does and doesn’t mean. It isn’t a verdict on Keppel DC REIT as a business. The rest of the portfolio is earning real, organic income, and the balance sheet gives the manager real flexibility to fix the specific problem rather than being forced into a fire sale. It’s a verdict on one building, and on the discipline of not looking away from a gate failure just because the other three gates passed.
Whether that single gate failure is something you can look past comes down to your own position, not mine to decide for you. If you’re years away from drawing down this money for retirement income, a single vacant property with a credible path to re-leasing is a very different risk than the same vacancy would be if you needed this distribution to cover expenses next year.
And if this is capital sitting outside your core retirement allocation, capital you’ve already decided can absorb more volatility in exchange for upside, the calculus shifts again. The framework doesn’t soften the gate. It just recognises that the same gate failure lands differently depending on the money behind it.

The Occupancy Trap
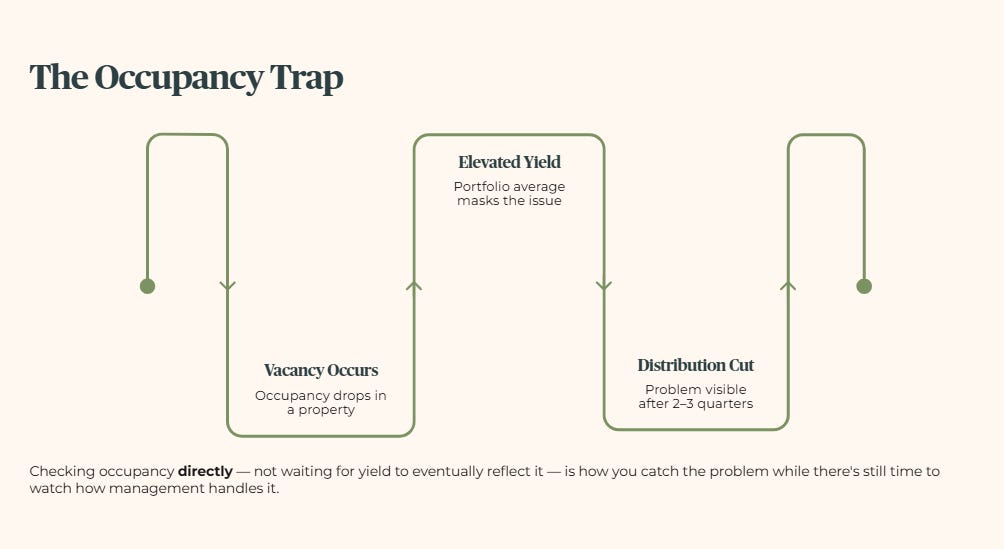
Here’s why I check occupancy separately from yield, gearing, and ICR, rather than assuming a healthy yield implies a healthy portfolio. Yield is a portfolio-wide average.
A single vacant property can sit inside a REIT with an otherwise excellent yield for several quarters before the vacancy fully shows up in the distribution number, because the rest of the portfolio is still carrying the average upward. By the time a vacancy-driven distribution cut actually appears in the yield figure, the problem has usually existed for two or three quarters already.
Checking occupancy directly, rather than waiting for yield to eventually reflect it, is how you catch the problem while there’s still time to watch how management handles it, rather than finding out only after the distribution has already been cut.
Longbridge Promo
Quick one before we get into it. Longbridge is running a special National Day promotion this month, and if you sign up through my channel, there’s an exclusive one hundred dollars on top of it.

Here’s how it works. Deposit and hold your funds, and every day through day 9, you’ll collect a piece of a top stock worth six dollars and ten cents. On day 10, you get a shot at a lucky draw to win shares of selected US stocks, worth anywhere from six dollars and ten cents to six hundred and ten dollars. And if your deposit hits ten thousand dollars, that’s when the extra hundred dollars cash kicks in. Full terms and the regular welcome rewards are both pinned in the comments below, worth a look if you’re already using Longbridge or thinking about it. Alright, let’s get into today’s numbers.
Cash Flow: The One Statement That’s Harder To Fake

I haven’t spent much time on cash flow in this walkthrough, and that’s deliberate, not an oversight. For a REIT specifically, cash flow analysis mostly confirms what the income statement already told you, since REITs are structurally required to distribute the bulk of taxable income, so distributable income and actual cash movement tend to track closely by design. Where cash flow statements earn their keep is in catching the REITs where they diverge, where a REIT reports healthy accounting income but its actual operating cash flow tells a different story, often because of aggressive revenue recognition or non-cash adjustments propping up the headline number.
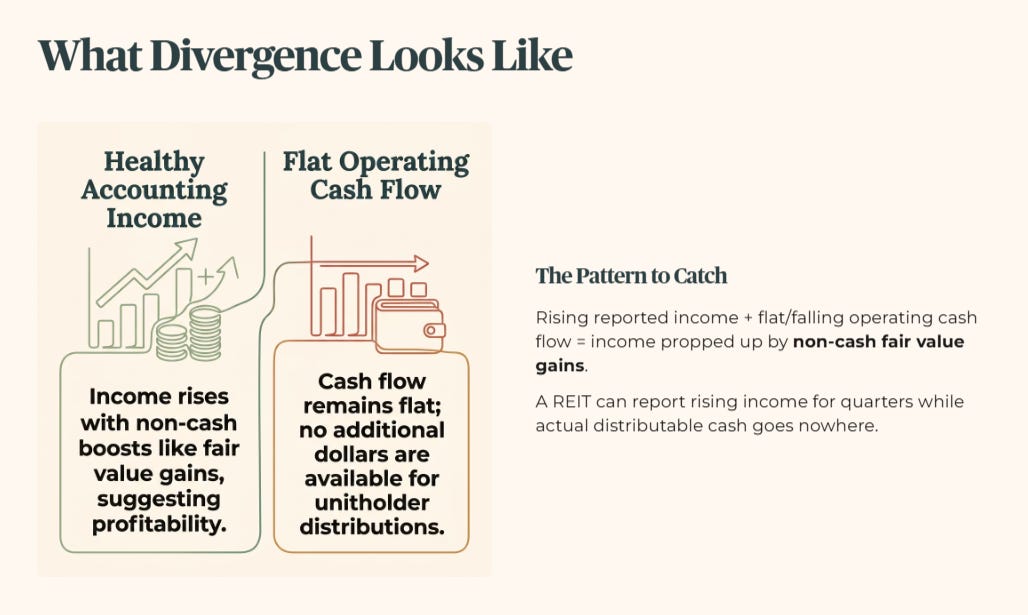
What does that divergence actually look like when it does show up. Picture a REIT reporting a healthy quarterly income figure while its cash flow statement shows operating cash flow that’s flat or falling. That gap usually means the income figure is being propped up by something non-cash, a fair value gain on the property portfolio, for instance, which boosts accounting profit without a single extra dollar landing in the bank account available to distribute.
A REIT can technically report rising income for several quarters this way while the actual cash available to pay unitholders is quietly going nowhere. That’s the specific pattern the cash flow statement exists to catch, and it’s why I always glance at it even on names where I don’t expect to find anything.
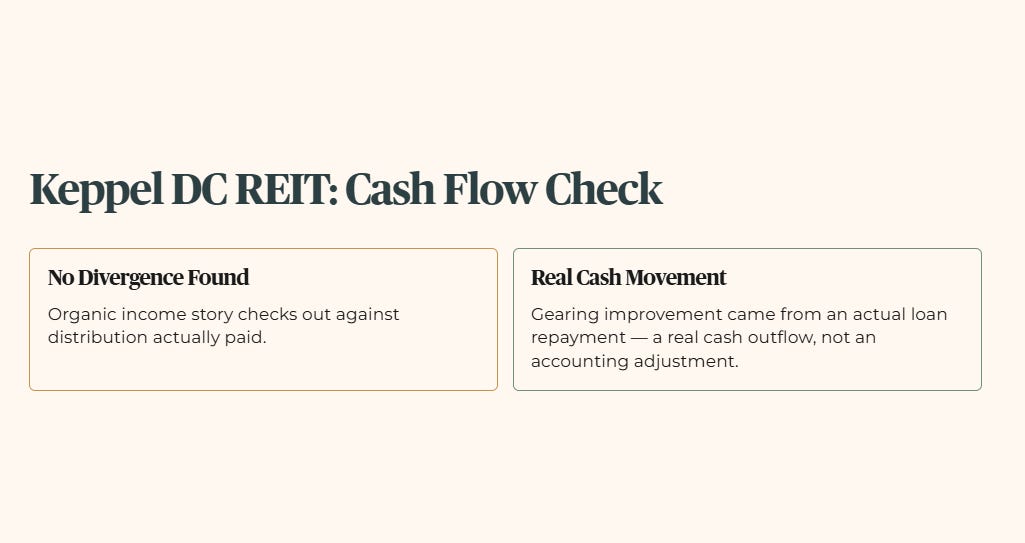
For Keppel DC REIT, nothing in the numbers above suggests that kind of divergence. The organic income story checks out against the distribution actually paid, and the improvement in gearing this period came from an actual loan repayment, a real cash outflow, not an accounting adjustment.
Reading The Statements In The Right Order
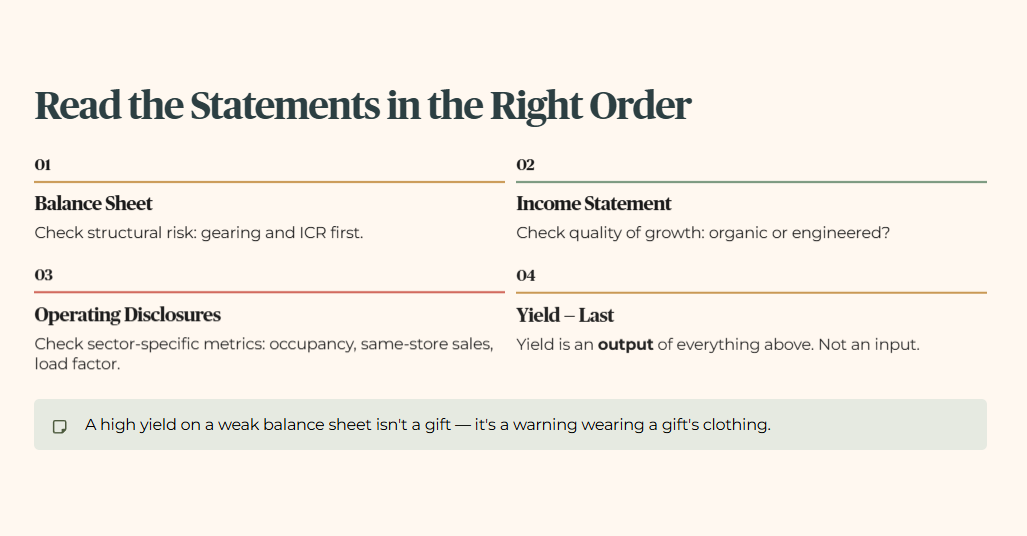
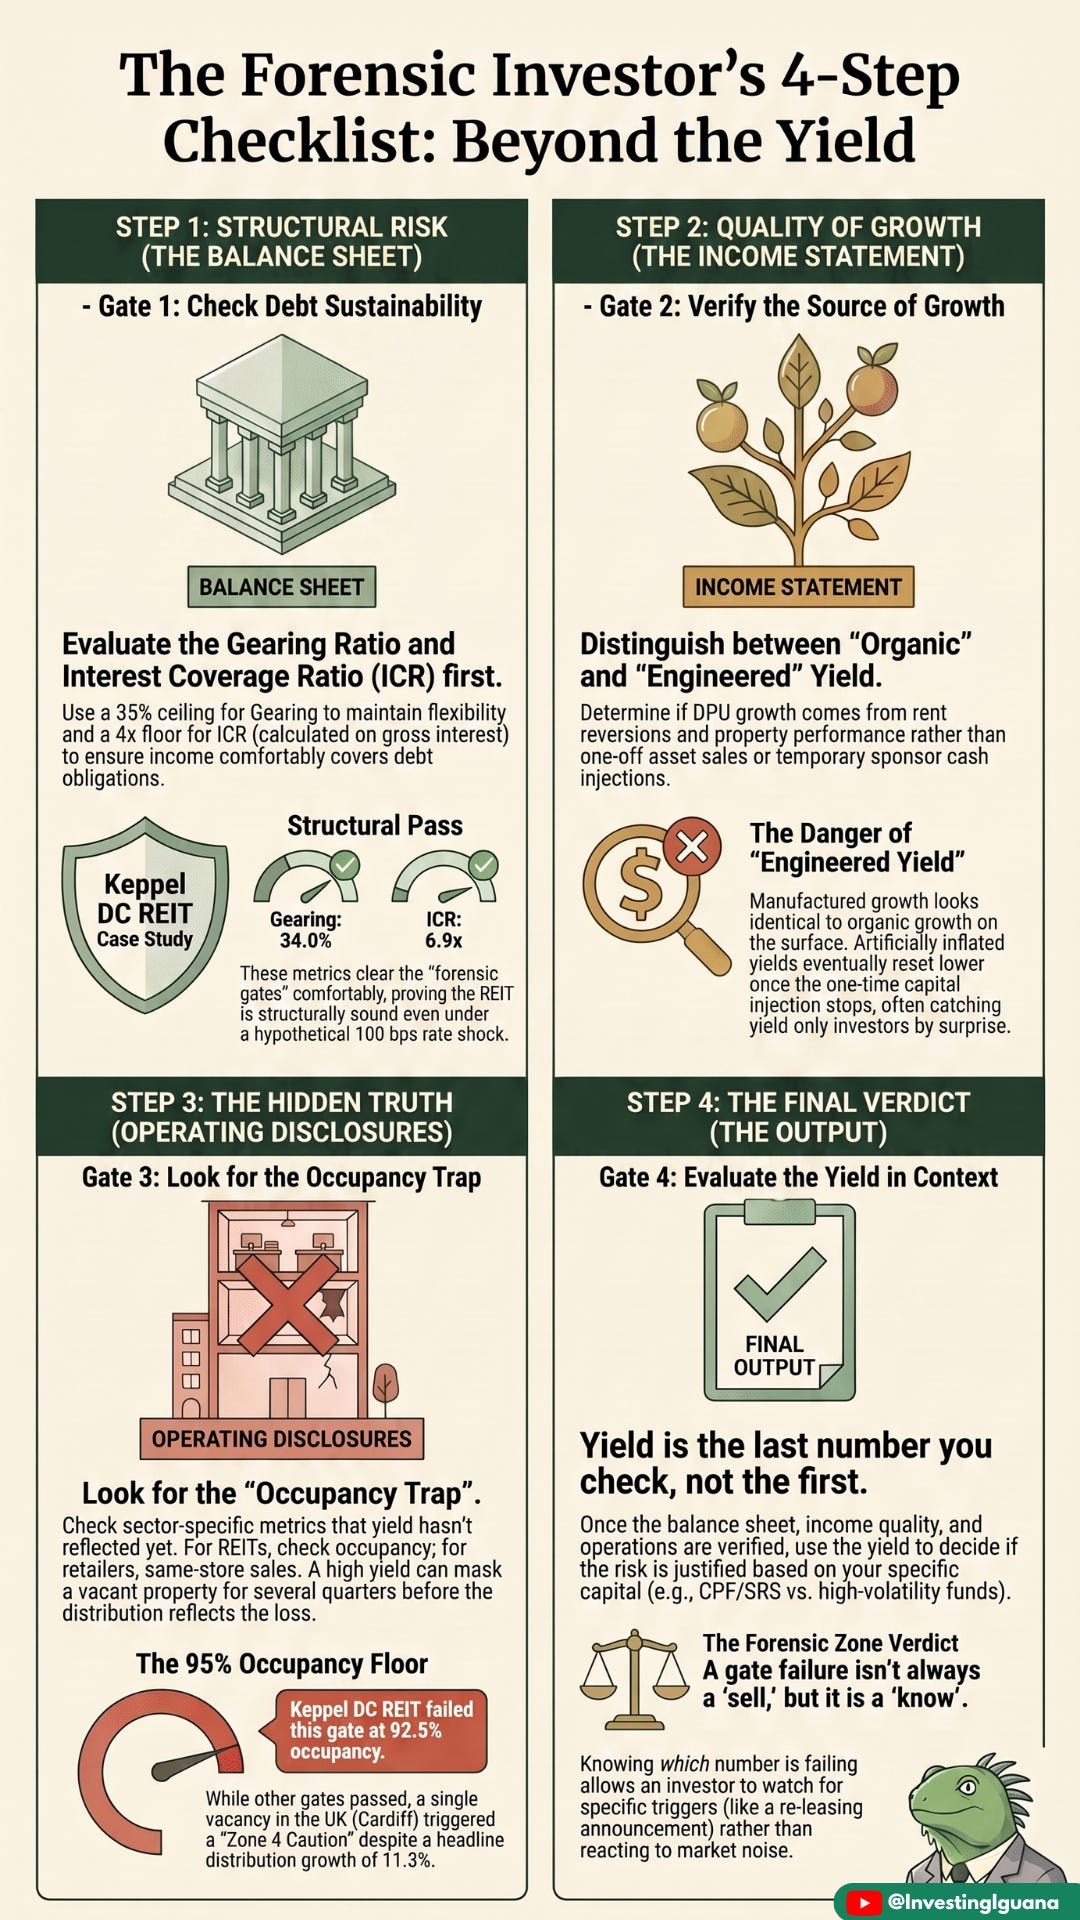
If you only remember one sequencing rule from this piece, make it this one: check the balance sheet for structural risk first, then the income statement for the quality of growth, then any operating disclosures specific to the business, before you ever look at the yield. Yield is the last number I check, not the first, because yield is an output of everything else, not an input. A high yield sitting on top of a weak balance sheet or manufactured income growth isn’t a gift, it’s a warning wearing a gift’s clothing. Checking in this order doesn’t guarantee you’ll never own a stock that later disappoints. It guarantees you’ll know exactly why, when it happens, instead of being surprised by a number you never thought to check.
You’ve seen how the balance sheet, income statement, and operating disclosures stack up here, the next section distils that full audit into a single zone label and one-page verdict that re-rates the yield you started with.
One Last Thing Before You Go
A Quick Note Before the Verdict. You aren’t here for the kopi tips or the hype. You’re here because you want the forensic truth before you commit a single dollar of your capital. That tells me something about the kind of investor you are.

But here’s the uncomfortable truth about how independent publishing works. The algorithm doesn’t know you read every word. It doesn’t know you checked the gearing ratio twice. It only sees one signal, whether you’ve hit that subscribe button. Every forensic investor who reads without subscribing is invisible to the machine.

If this analysis has ever helped you identify a risk or calculate a margin of safety, subscribe for free now and share this with one person who needs to hear it. Not for me. To tell the algorithm that data-driven SGX analysis deserves a seat at the table alongside the noise.
Try This On Your Own Holdings
The point of walking through Keppel DC REIT wasn’t to give you a verdict on Keppel DC REIT. It was to give you a sequence you can run on whatever you actually hold. The next time you pull up a REIT or dividend stock’s latest report, before you look at the yield, try this order instead.

First, check gearing and interest coverage. Is the debt load manageable, and does income comfortably cover the interest bill even before accounting for growth.
Second, check where distribution growth is actually coming from. Organic rental income and repricing is durable. Sponsor top-ups, asset sales, and one-off gains are not, however healthy the headline percentage looks.
Third, check any operating disclosure specific to that business, occupancy for a REIT, same-store sales for a retailer, load factor for an airline, whatever the sector-specific number is that the yield figure hasn’t caught up to reflecting yet. Only then, fourth, look at the yield itself, now with the context to actually judge whether it’s being earned or engineered.
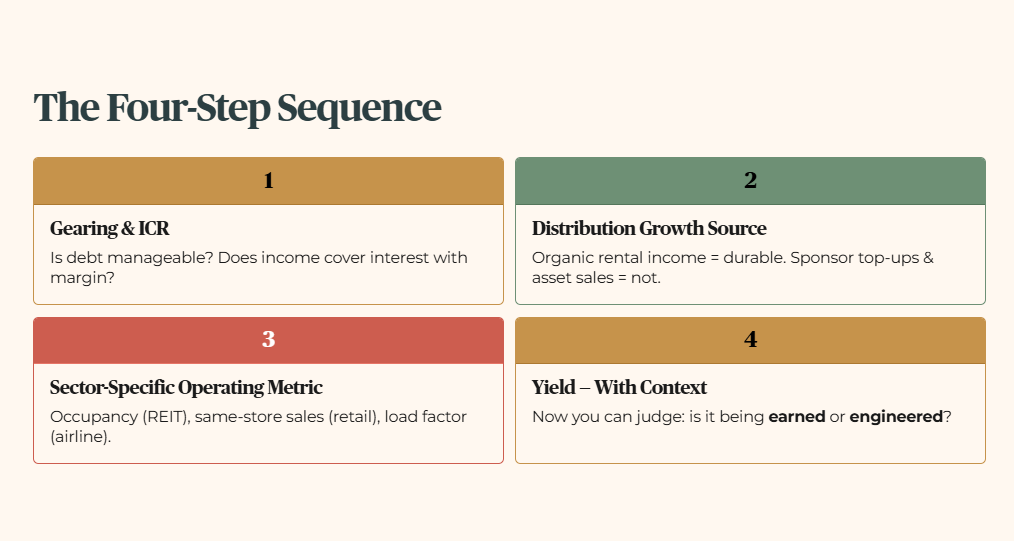
Run that sequence on a name you already own. You may well land on a clean pass across all four. You may also find, the way this walkthrough did, a business that’s fundamentally sound sitting on top of one number quietly failing where the yield hasn’t caught up to it yet. Either way, you’ll know which one you’re holding, instead of finding out later.
What I’m Actually Watching Next
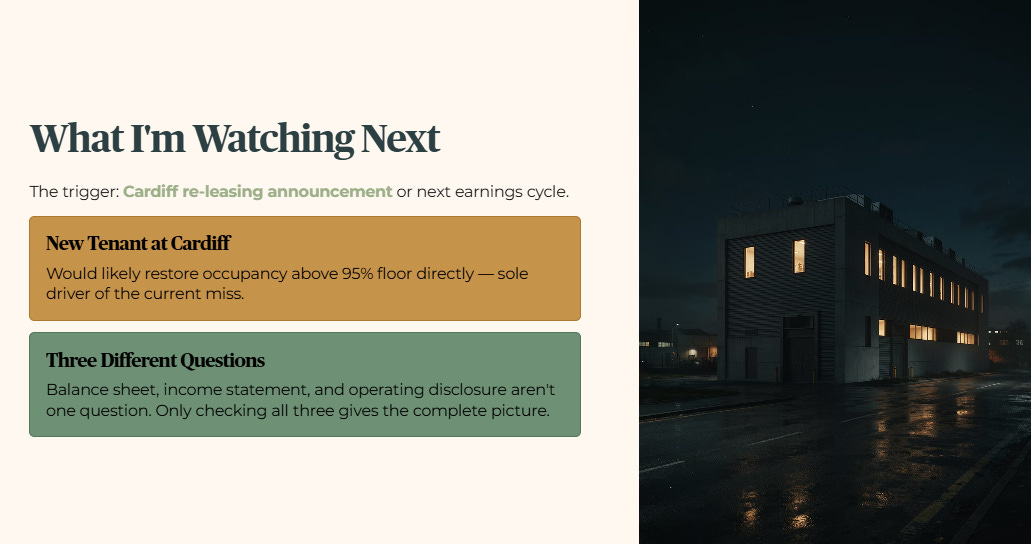
Keppel DC REIT’s next earnings cycle, or any Cardiff re-leasing announcement, is the trigger that resolves this specific gate. A new tenant at Cardiff would likely restore occupancy above the floor directly, since it’s the sole driver of the current miss. Until then, the balance sheet, the income statement, and the operating disclosure aren’t giving me three separate opinions on the same question.

They’re giving me three genuinely different questions, and only by checking all three do you get the complete picture that a single yield number, on its own, was never built to give you.
YOUR FORENSIC VERDICT, ONE PAGE.
The full audit is above. This is the Iggy Forensic Audit distilled to one A4 page — every number that matters, every flag that triggered, one clear verdict. Save it, print it, pull it out when this stock crosses your radar again, or when you need to refer to these data points for your retirement planning.

Iggy’s Forensic Disclaimer
This content is produced for educational and informational purposes only. I am not a financial advisor — I am a retail investor who applies forensic analysis to my own portfolio and shares that process publicly. Nothing here constitutes a recommendation to buy, sell, or hold any security, and no specific target prices or personalised financial advice are offered. Stocks assessed under Iggy’s Forensic Yield Standard are benchmarked against a 4.7% minimum yield hurdle; stocks flagged as Growth Watch fall below this threshold but demonstrate clean balance sheet metrics and an identifiable growth catalyst — these carry a materially different risk profile and are not suitable as yield replacements for income-dependent investors. All data is sourced from public filings and verified sources; where data is unverified it is explicitly flagged. All investments carry risk, including the potential loss of principal, and past performance is not indicative of future results. If you are making investment decisions involving CPF, SRS, or personal capital, please conduct your own due diligence or consult a MAS-licensed financial adviser before committing funds.

LONGBRIDGE AUGUST PROMOTION
Sign up through my link below to get started: https://longbridge.com/sg/promotions/activity/textActivity2?channel=ZH000018&invite-code=UITSY20E
REGULAR WELCOME REWARDS
Lifetime zero commission on US, HK, and SG stocks*, plus limited-time zero commission on US options* and free real-time Level 1 quotes across all three markets. Deposit S$500 and platform fee coupons activate across US, HK, and SG stocks, worth up to S$450 combined*. Deposit S$2,000 and hold it, and you get an 8.9% per annum interest boost for 180 days*.
NATIONAL DAY PROMOTION
Deposit and hold your funds, and collect a piece of a top stock worth S$6.1 every day through day 9*. On day 10, you get a shot at a lucky draw to win shares of selected US stocks, worth anywhere from S$6.1 to S$610. Deposit S$10,000, maintain it for 90days and complete at least 3 buy trades,and you'll also receive an exclusive S$100 cash bonus in terms of cash coupon, available only through my channel*.
Terms and conditions and other fees apply. Full T&Cs: https://support.longbridge.sg/topics/28nggs8/wr2608_deposit
https://support.longbridge.sg/topics/28nggs8/ndp2026?locale=en
This is a paid partnership with Longbridge. I am not a financial advisor, please do your own research before making any investment decisions.