



How to Spot a Dividend Cut Coming, 5 Signs I Check on Every SGX Stock
A checklist built from years of watching SGX yield traps unravel, before the market catches on.
Every SGX dividend stock that has ever cut its payout looked completely fine on the headline yield number, right up until the day it didn’t. The yield is the last number to move. The balance sheet moves first, if you know where to look.
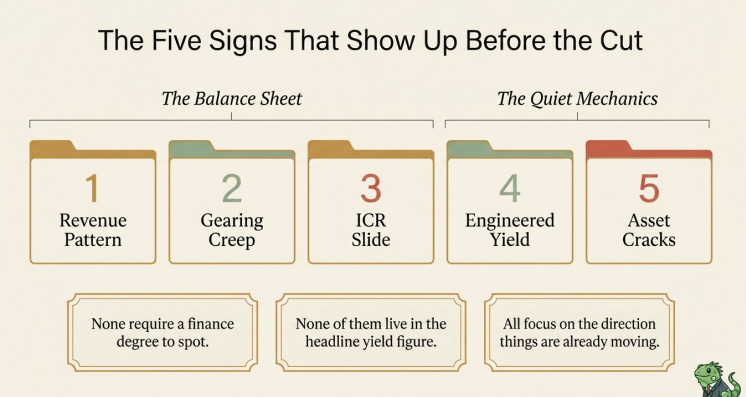
I built this five-point checklist after watching too many yield stories play out the same way: strong headline number, deteriorating fundamentals underneath, then a distribution cut that caught income investors by surprise. None of these five signs require a finance degree to check, and none of them live in the yield figure itself. If you are holding SGX dividend stocks for retirement income, these are the same five things I check before any stock earns a place on my own watchlist.
If you are further from drawdown and comfortable with more volatility, they are still worth knowing, because a business showing these signs is telling you something about its trajectory regardless of your own timeline.

Why the Yield Number Lies
The 4.7% Floor Isn’t About What You Could Get Elsewhere
The Five Signs That Show Up Before the Cut
Sign 1: Revenue or Profit Declining for Two Straight Periods
Sign 2: Gearing Creeping Up, Quarter on Quarter
Sign 3: Interest Coverage Sliding Toward the Floor
Sign 4: A Yield That Isn’t Actually Earned
Sign 5: Occupancy or Asset-Level Cracks Beneath the Portfolio Number
Running the Checklist Yourself
Why the Yield Number Lies
A stock’s yield is a snapshot, price and dividend divided into a single percentage, calculated today.
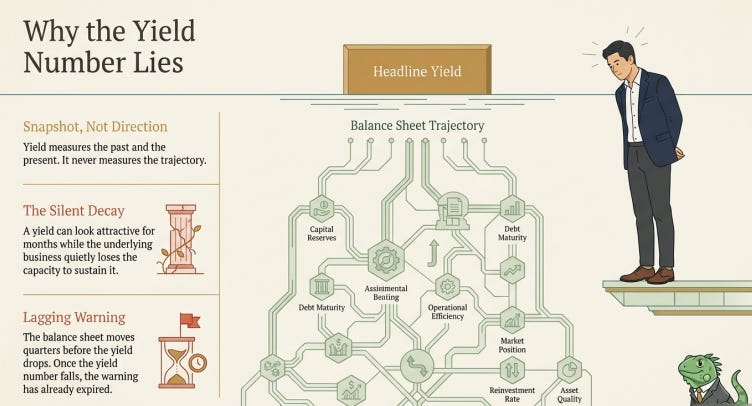
It tells you nothing about whether that dividend survives the next four quarters. A yield can look attractive for months while the business underneath it is quietly losing the capacity to keep paying it, and the yield number itself won’t move until the cut is actually announced, by which point the warning has already expired.
That is the core problem with using yield alone as a safety signal. It measures the past and the present, never the trajectory. The five signs below are all trajectory signals. They show up in filings and financial statements before a cut, sometimes two or three quarters before, and none of them require you to predict the future.
They only require you to look at the direction things are already moving.
The 4.7% Floor Isn’t About What You Could Get Elsewhere
Before the checklist itself, one clarification is worth making, since it comes up often. My minimum yield hurdle for any SGX income stock is 4.7% a year, built from a 3.2% forensic floor plus 150 basis points for equity risk.
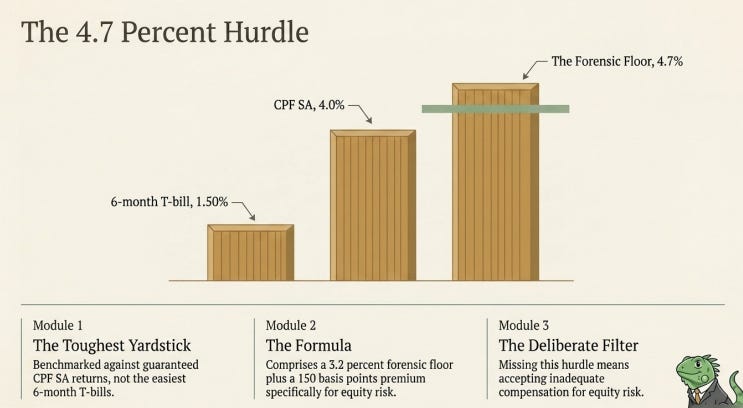
Readers sometimes assume this number is meant as “here’s what you could get instead with this exact dollar,” and that’s not quite it. CPF Special Account currently pays 4.0% a year (confirmed for Q3 2026, covering 1 July to 30 September), and it is the highest-quality guaranteed SGD yield available in the system, not the easiest one to access, since contributions are capped by the prevailing Retirement Sum ceiling. A 6-month T-bill, by contrast, cleared at just 1.50% at the most recent completed auction (2 July 2026), well below both CPF SA and the 3.2% floor itself.
The 4.7% hurdle is benchmarked against the toughest yardstick available, not the easiest one, because a hurdle set against T-bills would clear on almost every SGX dividend name and stop functioning as a filter at all.
A stock that misses this hurdle isn’t automatically a bad business. It’s a business asking you to accept less compensation for equity risk than the safest instrument in the system already pays, and that’s a call worth making deliberately rather than by default.
No One Pays Him To Be Right
The Verdict Doesn’t Change Because The Bill Needs Paying. Every finance channel says “unbiased.” Most of them also have a sponsor, an affiliate link, or a subscriber count to protect deciding what gets softened. Iggy doesn’t. This channel started as, and still is, a passion project, not an income source. That’s not a slogan, it’s the actual reason a Zone 4 verdict stays a Zone 4 verdict even when the stock is one half of Singapore holds.
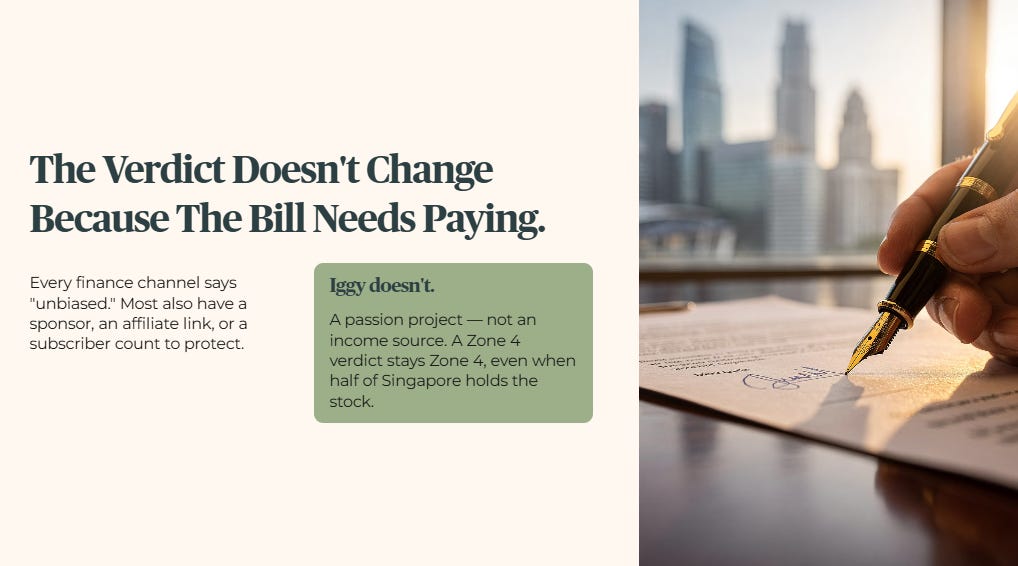
Iggy’s Elite Investors aren’t paying for faster access to opinions that were always going to be diplomatic anyway. You’re paying for the version of this analysis that exists because it doesn’t need to please anyone, zero-day forensic breakdowns, the complete “Red Zone” watchlist, and institutional-grade cheatsheets built without a single sponsor’s name attached to the verdict.
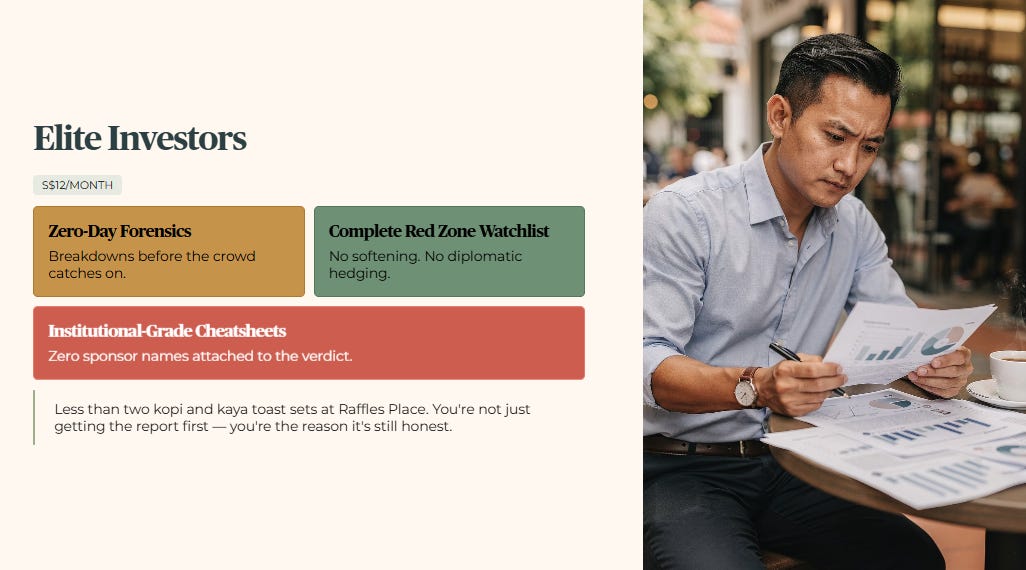
For S$12/month, less than two kopi and kaya toast sets at Raffles Place, you’re not just getting the report first. You’re the reason it’s still honest.
The Five Signs That Show Up Before the Cut
Sign 1: Revenue or Profit Declining for Two Straight Periods

A single weak quarter happens to almost every company at some point, a one-off cost, a currency swing, a delayed contract. It is not, by itself, a warning sign.
Two consecutive periods of declining revenue or net profit tell a different story. That’s a pattern, not an accident, and it’s the single most common precursor to a dividend cut across SGX history, because dividends are ultimately paid from earnings, and a business that can’t grow or even hold its earnings line eventually runs out of room to hold its payout line too.
This is why I treat it as a major soft flag in my own framework rather than a minor one. It doesn’t fail a stock on its own, but it changes how much benefit of the doubt every other number in the analysis deserves.
Sign 2: Gearing Creeping Up, Quarter on Quarter
Watch the direction, not just the level.
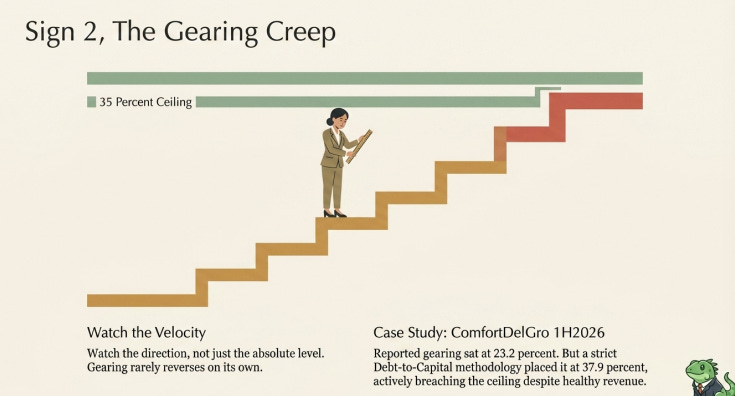
A REIT or corporate sitting comfortably under my 35% gearing ceiling can still be flashing a warning if that number has been climbing steadily for several quarters in a row, because gearing rarely reverses on its own. It usually keeps climbing until either a rights issue, an asset sale, or a distribution cut brings it back down, and a cut is often the cheapest lever management has available.
ComfortDelGro’s 1H2026 results (announced 14 August 2026) are a clean live example. Net gearing on the company’s own reported basis rose from 19.7% at end-2025 to 23.2% by June 2026, a genuine move within a single half. On the Ledger’s own governing Debt/Capital methodology the figure comes in higher still, at 37.9%, actually breaching the 35% ceiling by 2.9 percentage points.
The business itself is fine, revenue grew 5.7% year on year, and the yield still clears my hurdle comfortably at 6.30%. But the gearing direction is exactly the kind of signal that’s worth tracking now, well before it becomes a problem the yield number reflects.
Sign 3: Interest Coverage Sliding Toward the Floor
Interest Coverage Ratio, ICR, measures how many times over a company’s earnings could cover its interest payments. My floor is above 4.0x. A business sitting comfortably above that line has real breathing room if rates rise or earnings soften. A business sitting exactly on that line, or drifting toward it over successive quarters, has none.
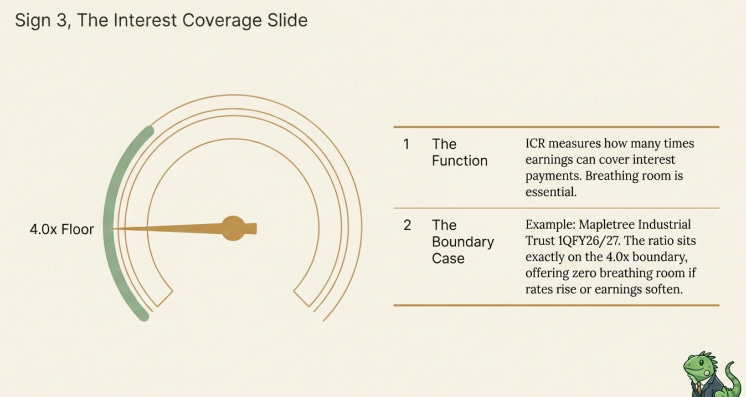
Mapletree Industrial Trust’s most recent quarter (1QFY26/27, reported August 2026) shows exactly why this matters as a leading indicator rather than a lagging one. The REIT’s own disclosed ICR comes in at precisely 4.0x, sitting directly on the floor rather than clearing it.
Read literally, “above 4.0x” isn’t met by a number that equals 4.0x exactly, which is the kind of boundary case that deserves scrutiny rather than a pass by default. Whichever way that specific boundary call resolves, the more important point for you as a reader is the habit itself: check where ICR sits relative to the floor, not just whether the current yield still looks fine.
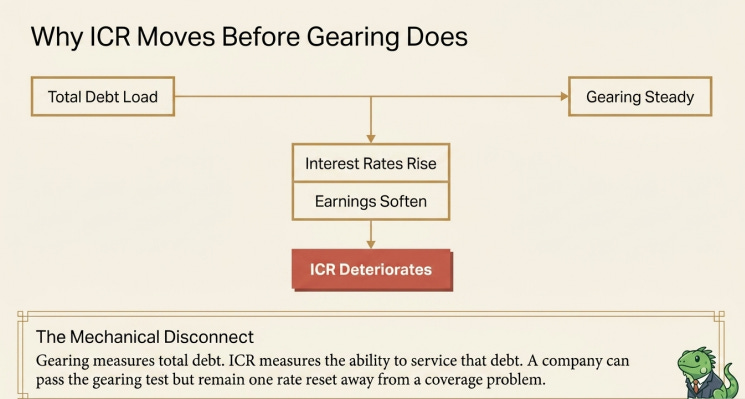
Insight Callout Box: Why ICR Moves Before Gearing Does
Gearing tells you how much debt a company is carrying. ICR tells you whether current earnings can actually service that debt comfortably. The two don’t always move together. A company can hold gearing steady while ICR quietly deteriorates, if interest rates rise, if debt gets refinanced at a worse rate, or if earnings simply soften while debt stays flat.
That’s why I check both separately rather than treating gearing as a proxy for coverage. A business can pass the gearing test and still be one rate reset away from a coverage problem the gearing number never showed you.
🔒 What’s Next
The first three signs above all live on the balance sheet and income statement. The next two are quieter, and both explain why a distribution can look perfectly healthy on paper while actually being propped up by something that isn’t sustainable.
