



I Tested An AI Stock Tool Against My Own Forensic Checklist. It Failed On The One Number That Matters. Here is the exact gap between what the tool said and what the balance sheet actually showed, and the four checks I now run before trusting any AI stock claim.
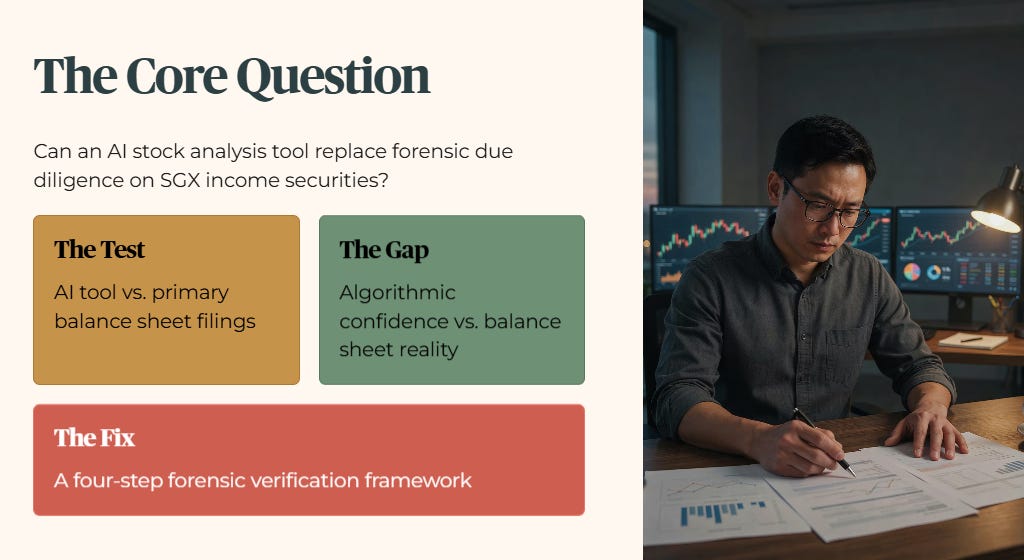
Most Singapore retail investors assume an AI stock analysis tool acts like a tireless financial analyst. But relying on a chatbot without live data checks turns your portfolio into a playground for dangerous hallucination. The moment an automated tool labels a dividend yield as fair without auditing whether that income is organic, your retirement capital is exposed to unpriced capital risk. Here is the four-step verification framework I run to spot these algorithmic blind spots before they cost you real money.
Whether you are managing long-term capital in your SRS account or evaluating dividend names for retirement drawdown, trusting unverified algorithmic outputs can quietly undermine your financial security. When I ran a standard prompt through a general AI chatbot with no direct live market data connection, the model presented a polished, confident narrative that appeared entirely convincing at first glance. But a forensic audit against primary filings revealed that the tool stumbled on the single most critical metric in SGX income investing: verifying whether a dividend yield actually clears a mandatory risk hurdle.


The Audit Experiment: What I Prompted vs. What Was Returned
The Headline Failure: The Yield Hurdle Gap
Secondary Algorithmic Blind Spots: Debt and Credit Metrics
The 4-Step Verification Framework
Step 1: The Health Filter (Solvency Audit)
Step 2: The Valuation Reality
Step 3: The Income Stress Test
Step 4: The Peer Comparison
Live Case Study: SingTel (Z74)
Iggy’s Forensic Disclaimer
The Audit Experiment: What I Prompted vs. What Was Returned
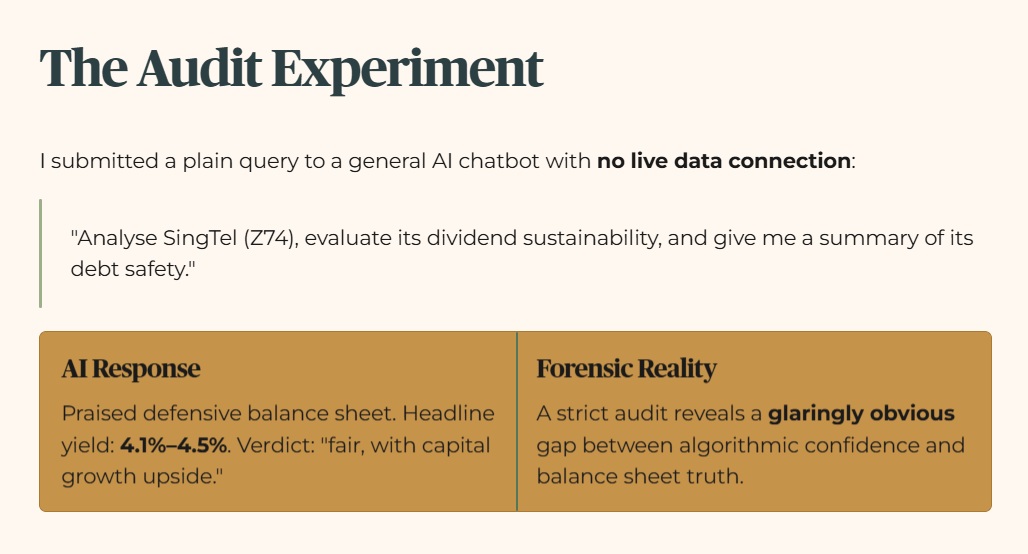
To test how a standard AI model handles SGX income securities, I submitted a plain, explicit query into a general chatbot operating without live data fetch capabilities:
“Analyze SingTel (Z74), evaluate its dividend sustainability, and give me a summary of its debt safety.”
The AI tool generated a structured response, praising the company’s defensive balance sheet and highlighting a headline dividend yield range of 4.1% to 4.5%. The tool explicitly categorised this yield range as “fair, with capital growth upside.”
To an investor scanning for steady distribution income, that summary reads like an immediate green light. But when you apply a strict forensic audit to those figures, the gap between algorithmic confidence and balance sheet reality becomes glaringly obvious.
The Headline Failure: The Yield Hurdle Gap
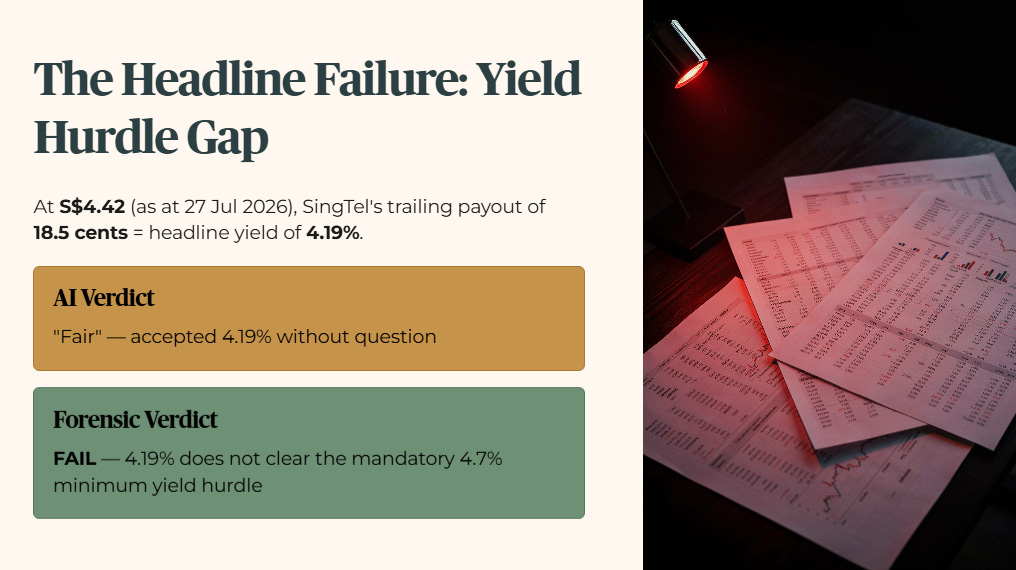
The primary discovery of this audit was not a minor math error. It was a total failure of financial logic. At a market price of S$4.42 (as at 27 Jul 2026), SingTel’s total trailing dividend payout of 18.5 cents translates to a headline yield of 4.19%.
The tool looked at 4.19% and called it “fair.” From a forensic standpoint, a 4.19% total yield fails my mandatory 4.7% minimum yield hurdle outright.
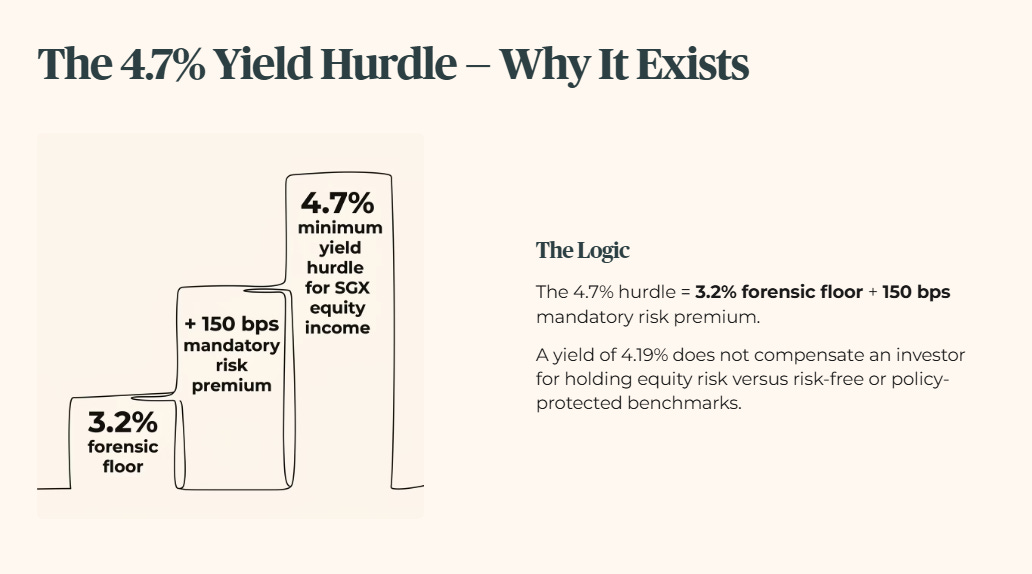
When evaluating SGX income securities, my minimum yield hurdle is fixed at 4.7%. This hurdle is benchmarked against the 3.2% forensic floor plus a mandatory 150 basis points risk premium to compensate for equity price risk. A yield of 4.19% does not compensate an investor for holding equity risk when compared against risk-free or policy-protected benchmarks.
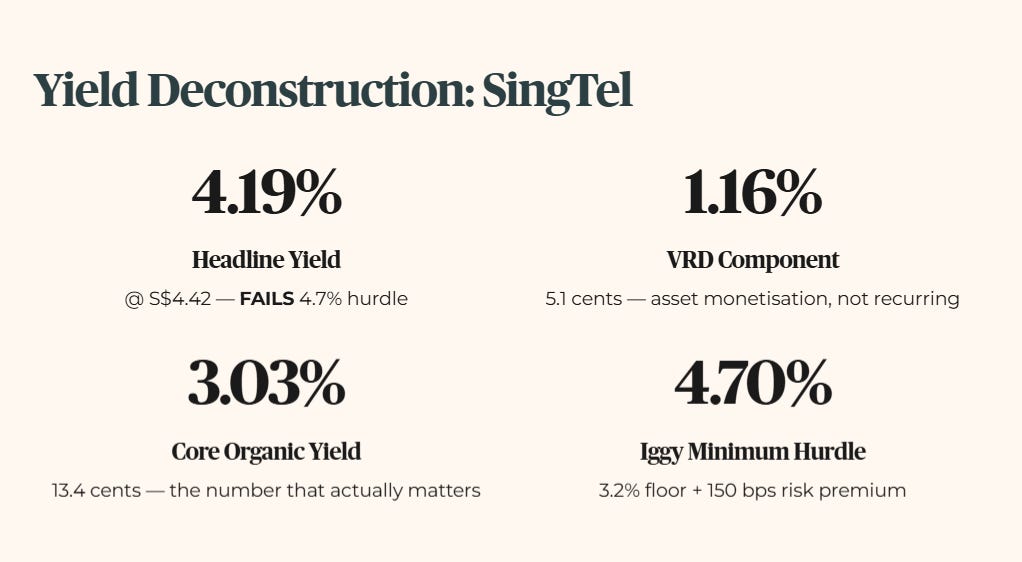
Furthermore, the breakdown of that 18.5 cents distribution exposes an even deeper issue. The payout includes 5.1 cents of Value Realisation Dividends (VRD), which are special distributions funded by asset monetisation rather than recurring operational cash flow.
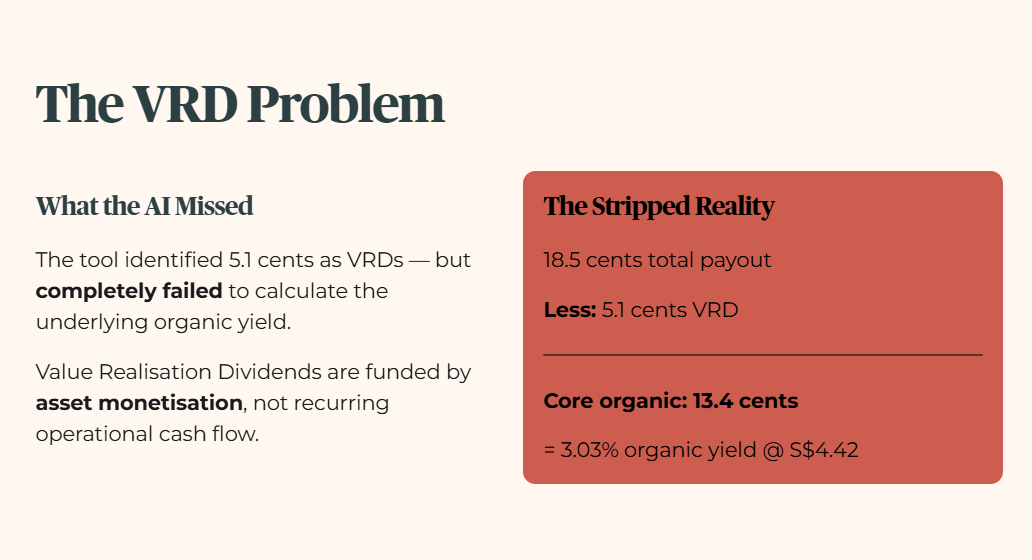
While the tool correctly identified that 5.1 cents of the total payout came from VRDs, it completely failed to calculate the underlying organic yield. Stripping out the 5.1 cents VRD leaves a core organic distribution of 13.4 cents. At S$4.42, this represents a core organic yield of just 3.03%.
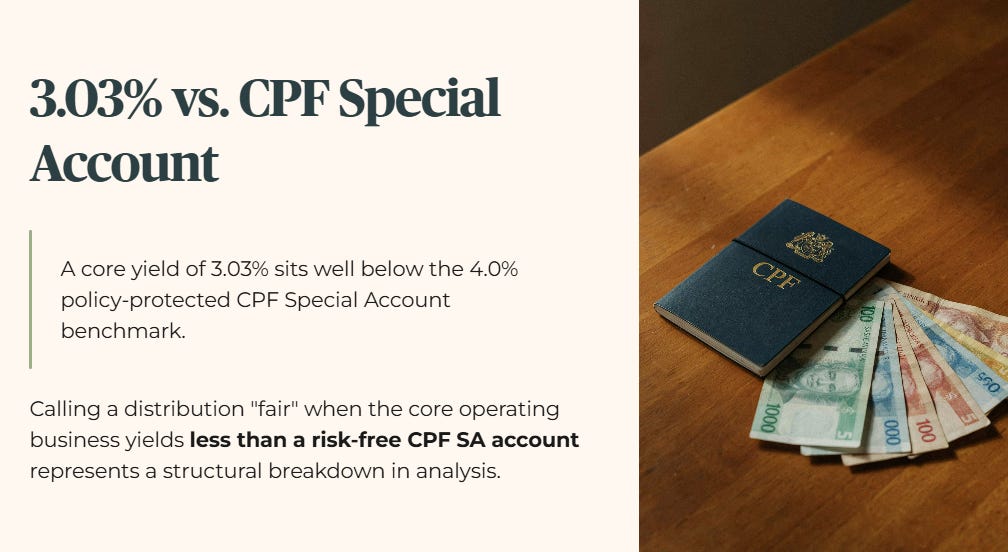
A core yield of 3.03% sits well below the 4.0% policy-protected benchmark of the CPF Special Account. Calling a distribution “fair” when its core operating business yields less than a risk-free CPF SA account represents a structural breakdown in analysis.
Secondary Algorithmic Blind Spots: Debt and Credit Metrics
Beyond the yield hurdle failure, the AI tool generated specific, highly confident data errors across key balance sheet metrics:
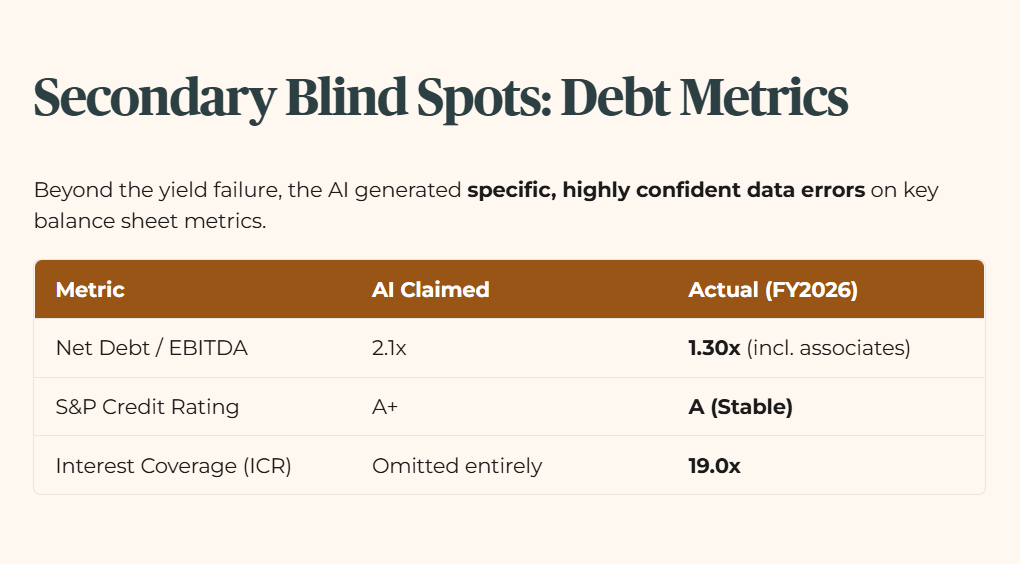
Net Debt to EBITDA: The tool claimed SingTel maintained a Net Debt to EBITDA ratio of 2.1x. SingTel’s own FY2026 financial disclosures report Net Debt to EBITDA, including share of associates’ pre-tax profits, at 1.30x as at 31 March 2026. The tool’s 2.1x figure doesn’t match SingTel’s own reported metric under any reasonable reading. It invented a leverage ratio that isn’t grounded in the company’s actual disclosures.
S&P Credit Rating: The tool reported SingTel’s credit rating as A+. The actual current credit rating from S&P is A (Stable). While a single notch difference might seem minor, accurate credit ratings are vital for assessing long-term refinancing costs.
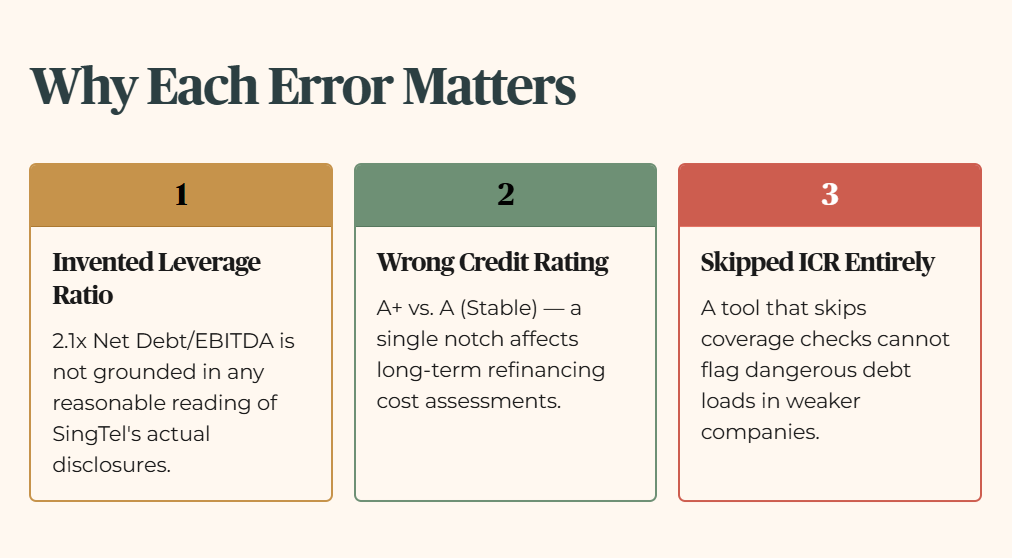
Interest Coverage Ratio (ICR): The tool completely omitted any ICR calculation. It did not get the number wrong. It simply skipped the metric entirely. Verifying primary filings reveals a strong ICR of 19.0x. While SingTel comfortably passes the ICR floor, an automated tool that skips coverage checks entirely cannot be trusted to flag dangerous debt loads in weaker companies.
The 4-Step Verification Framework
To prevent algorithmic errors from compromising your capital, you must run every AI-generated stock claim through a rigorous four-step verification process before taking any action.
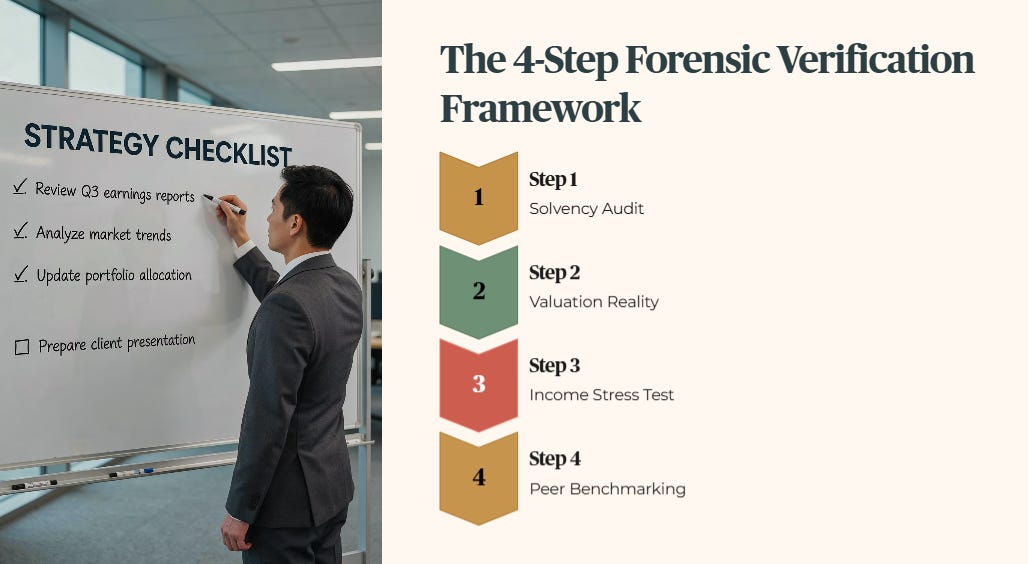
Step 1: The Health Filter (Solvency Audit)
The first step in verifying any AI stock claim is auditing the issuer’s balance sheet for three non-negotiable solvency criteria: a gearing ratio below 35%, an Interest Coverage Ratio (ICR) above 4.0x, and a Net Debt to EBITDA ratio below 5.0x.
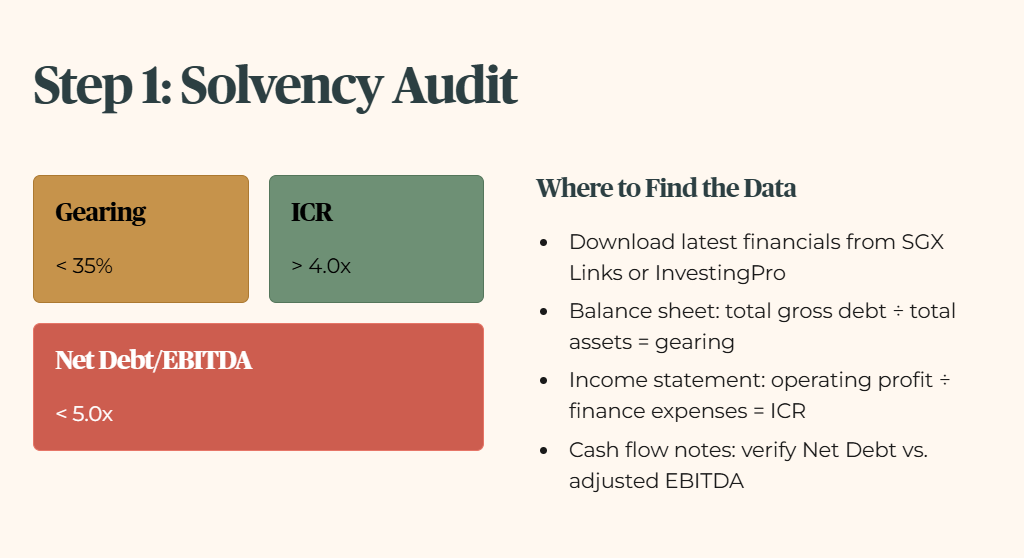
To locate these metrics independently, download the latest annual or semi-annual financial statements directly from SGX Links or cross-reference primary data platforms like InvestingPro. Open the balance sheet to locate total gross debt and total assets, then divide total debt by total assets to establish true gearing. Next, open the income statement and compare operating profit against total finance expenses to calculate ICR. Finally, check the cash flow statement and financial notes to verify Net Debt relative to adjusted EBITDA.
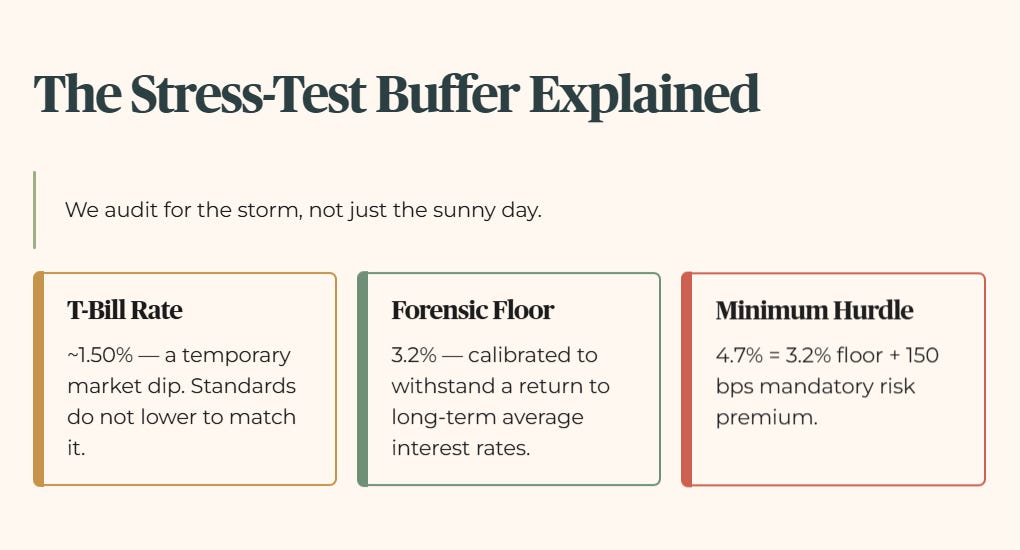
Note on the Stress-Test Buffer: For this audit, I apply a conservative floor of 3.2%. We audit for the storm, not just the sunny day. While the T-Bill sits at approximately 1.50%, I do not lower my standards to match a temporary market dip. My floor remains at 3.2% to ensure sanctuary assets can withstand a return to long-term average interest rates. The minimum yield hurdle is 4.7%. That is the 3.2% floor plus 150 basis points of mandatory risk premium.
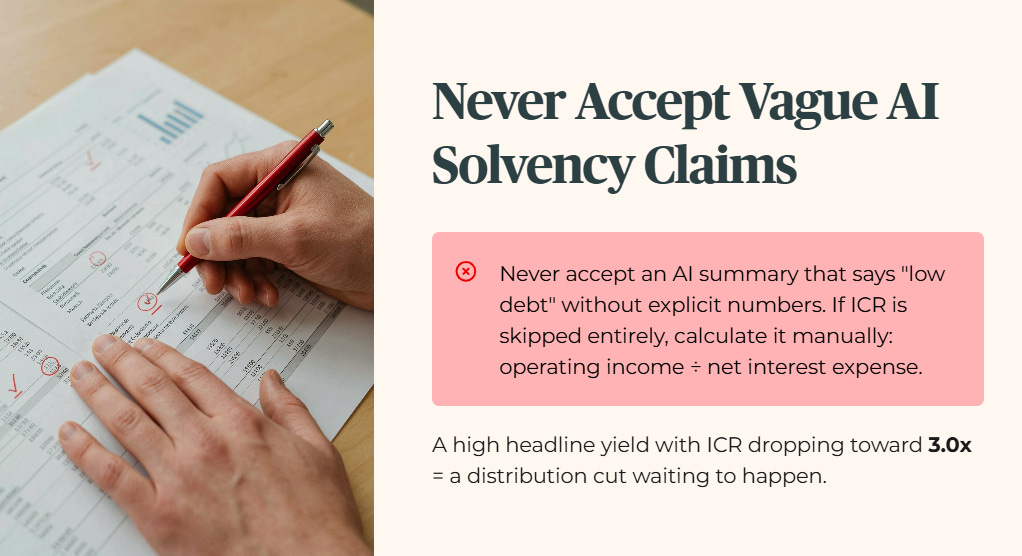
When auditing solvency, never accept an AI summary that provides general statements like “low debt” without providing explicit numbers. If an automated tool skips ICR entirely, as occurred in our test prompt, you must manually calculate operating income divided by net interest expense. A company with a high headline yield but an ICR dropping toward 3.0x represents a distribution cut waiting to happen.
Step 2: The Valuation Reality
The second step requires calculating the Forensic Gap: the percentage difference between an asset’s current market price and its verified fair value. AI tools frequently confuse market consensus price targets with true balance sheet fair value.
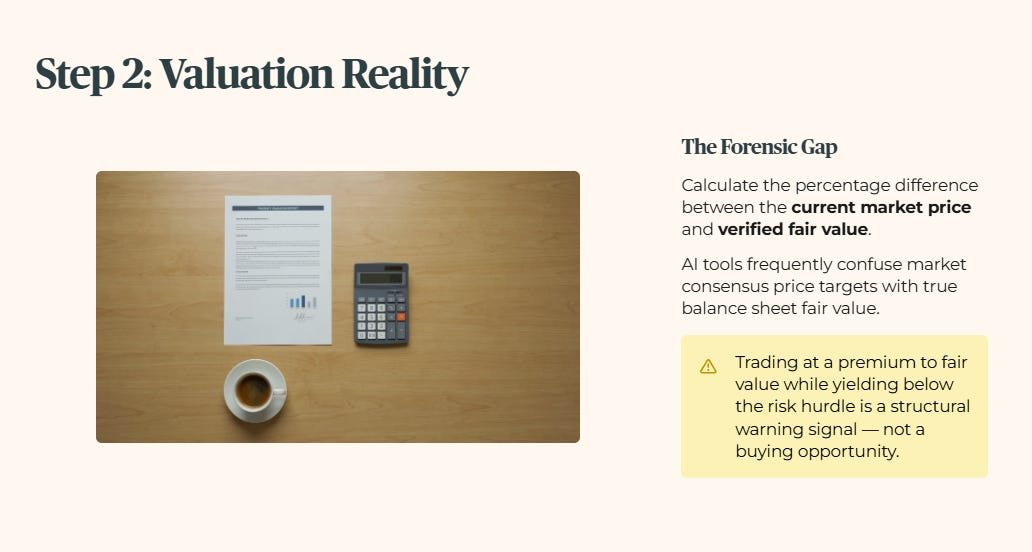
To audit valuation, pull the multi-model intrinsic value calculation from InvestingPro. Compare this figure directly against the current market trading price. If a stock trades at a significant premium to its fair value, a high headline yield does not provide a margin of safety. Trading at a premium to fair value while offering a yield below our risk hurdle indicates that investors are paying up for perceived safety while accepting inferior risk-adjusted cash flows.
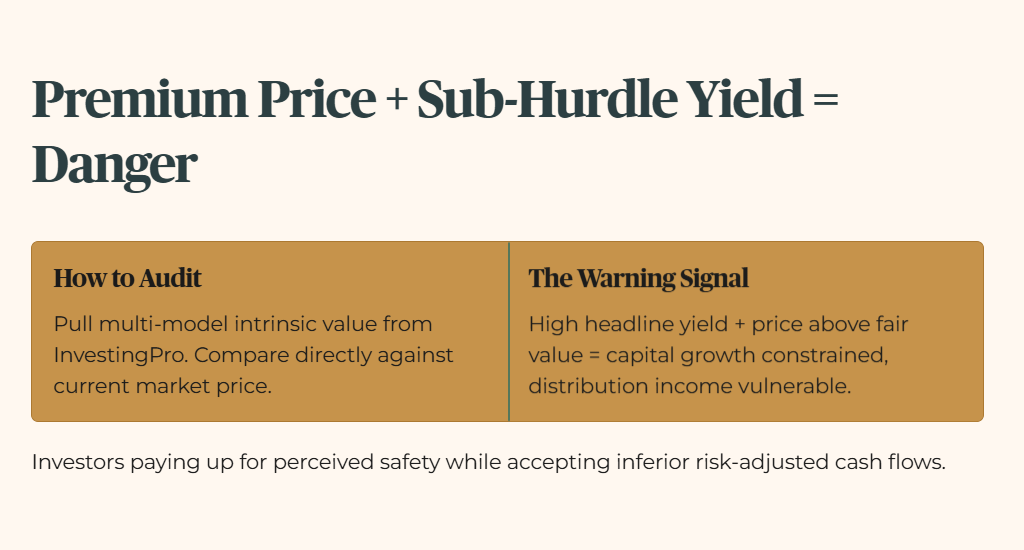
A high headline yield combined with a market price trading above fair value is never a buying opportunity. It is a structural warning signal that capital growth upside is constrained while distribution income remains vulnerable.
Step 3: The Income Stress Test
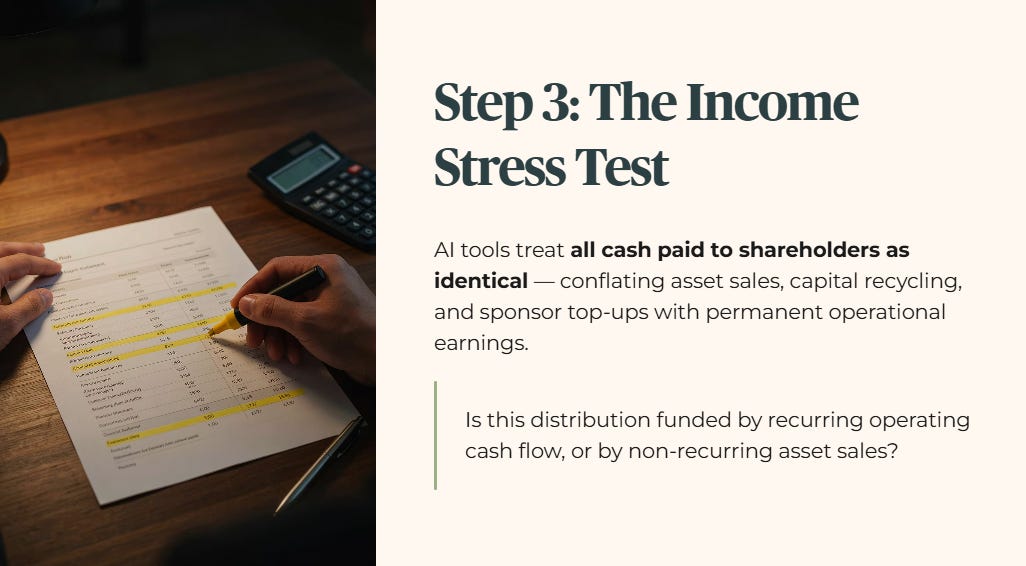
The third step is distinguishing between Organic Net Property Income (NPI) or operating cash flow and Engineered Yield. AI tools consistently treat all cash paid out to shareholders as identical, treating temporary asset sales, capital recycling proceeds, and sponsor top-ups as if they were permanent operational earnings.
The core diagnostic question you must answer is simple: Is this distribution funded entirely by recurring operating cash flow, or is it supported by non-recurring asset sales and distribution reinvestment plans?
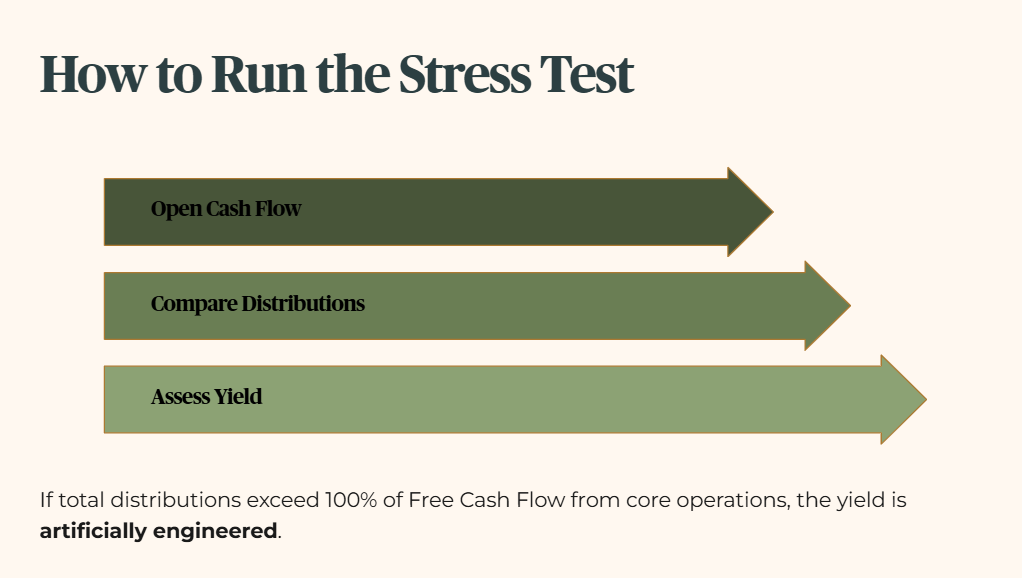
Open the consolidated statement of cash flows in the company’s financial report. Compare net cash generated from operating activities against the total cash distributed to shareholders.
Distribution sustainability alert: if total distributions exceed 100% of Free Cash Flow (FCF) generated from core operations, the yield is artificially engineered.
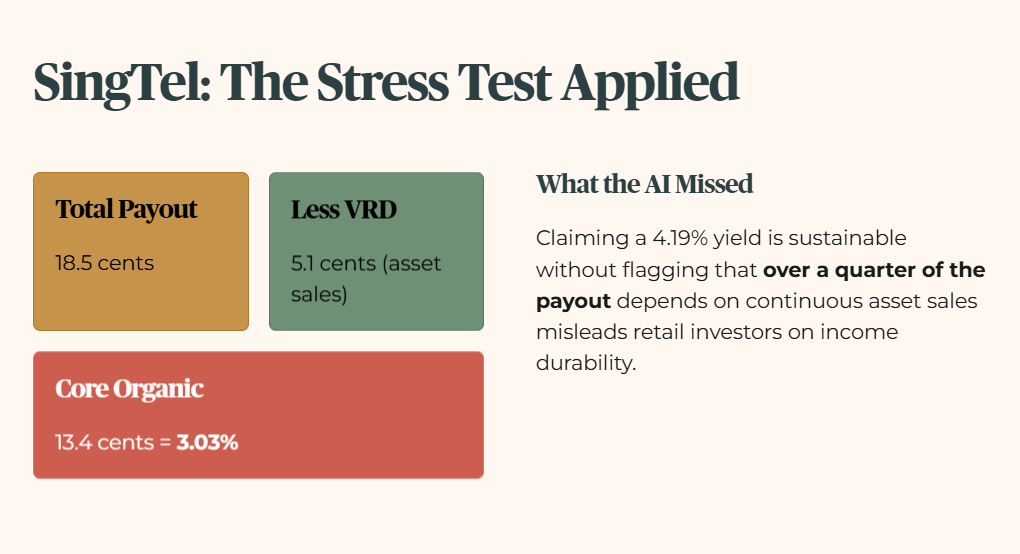
When analysing SingTel, stripping away the 5.1 cents Value Realisation Dividend exposes a core operating distribution of 13.4 cents per share. At S$4.42, that organic yield stands at 3.03%. When an AI tool claims a 4.19% yield is sustainable without highlighting that over a quarter of that payout depends on continuous asset sales, it misleads retail investors on income durability.
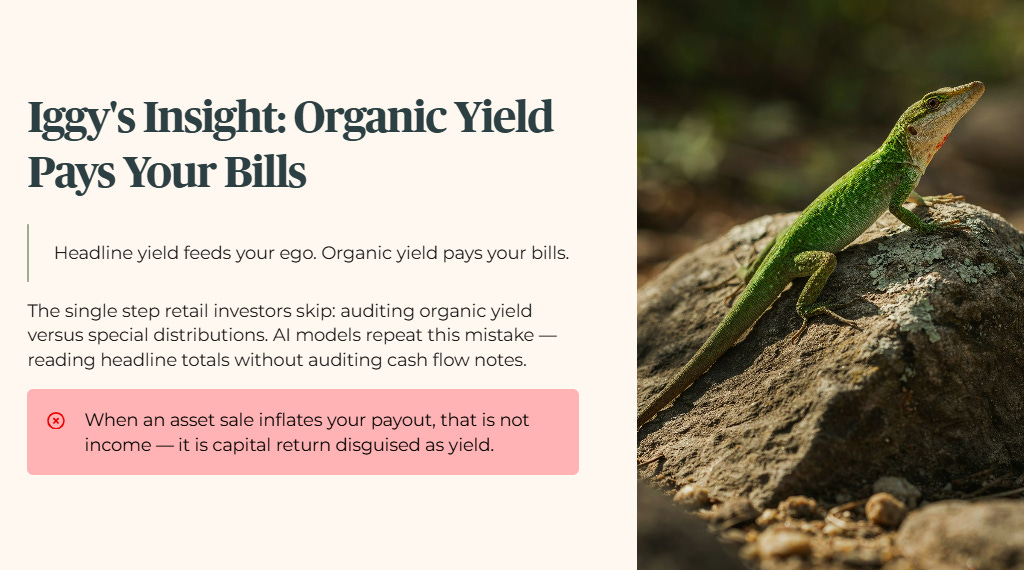
🦎 Iggy’s Insight — Block 1
The single step retail investors skip is auditing organic yield versus special distributions.
Most investors glance at the headline yield, see a respectable number, and assume the cash flow is permanent. AI models repeat this mistake because they read headline distribution totals without auditing cash flow notes.
When an asset sale inflates your payout, that is not income. It is capital return disguised as yield. Skipping the organic yield calculation is the single most expensive error in SGX income investing.
Headline yield feeds your ego. Organic yield pays your bills.
The yield hurdle failure and organic yield gap above are only half the story, the peer comparison and framework scorecard that follow show exactly how SingTel’s numbers translate into a Zone 4 verdict on your retirement income.
