

The 100% Payout Ratio Warning (M44U Analysis)
Here’s why 14.4% returns don’t tell the full story about S-Reits in 2025.

If you’re new here, welcome. I’m Iggy, your Singapore-based market analyst. Since October 2025, we’ve produced over 1,300 videos and 400 articles with 1.1 million watch hours. We are also home to a growing community of over 60 YouTube Premium subscribers and 30 paid Substack members.
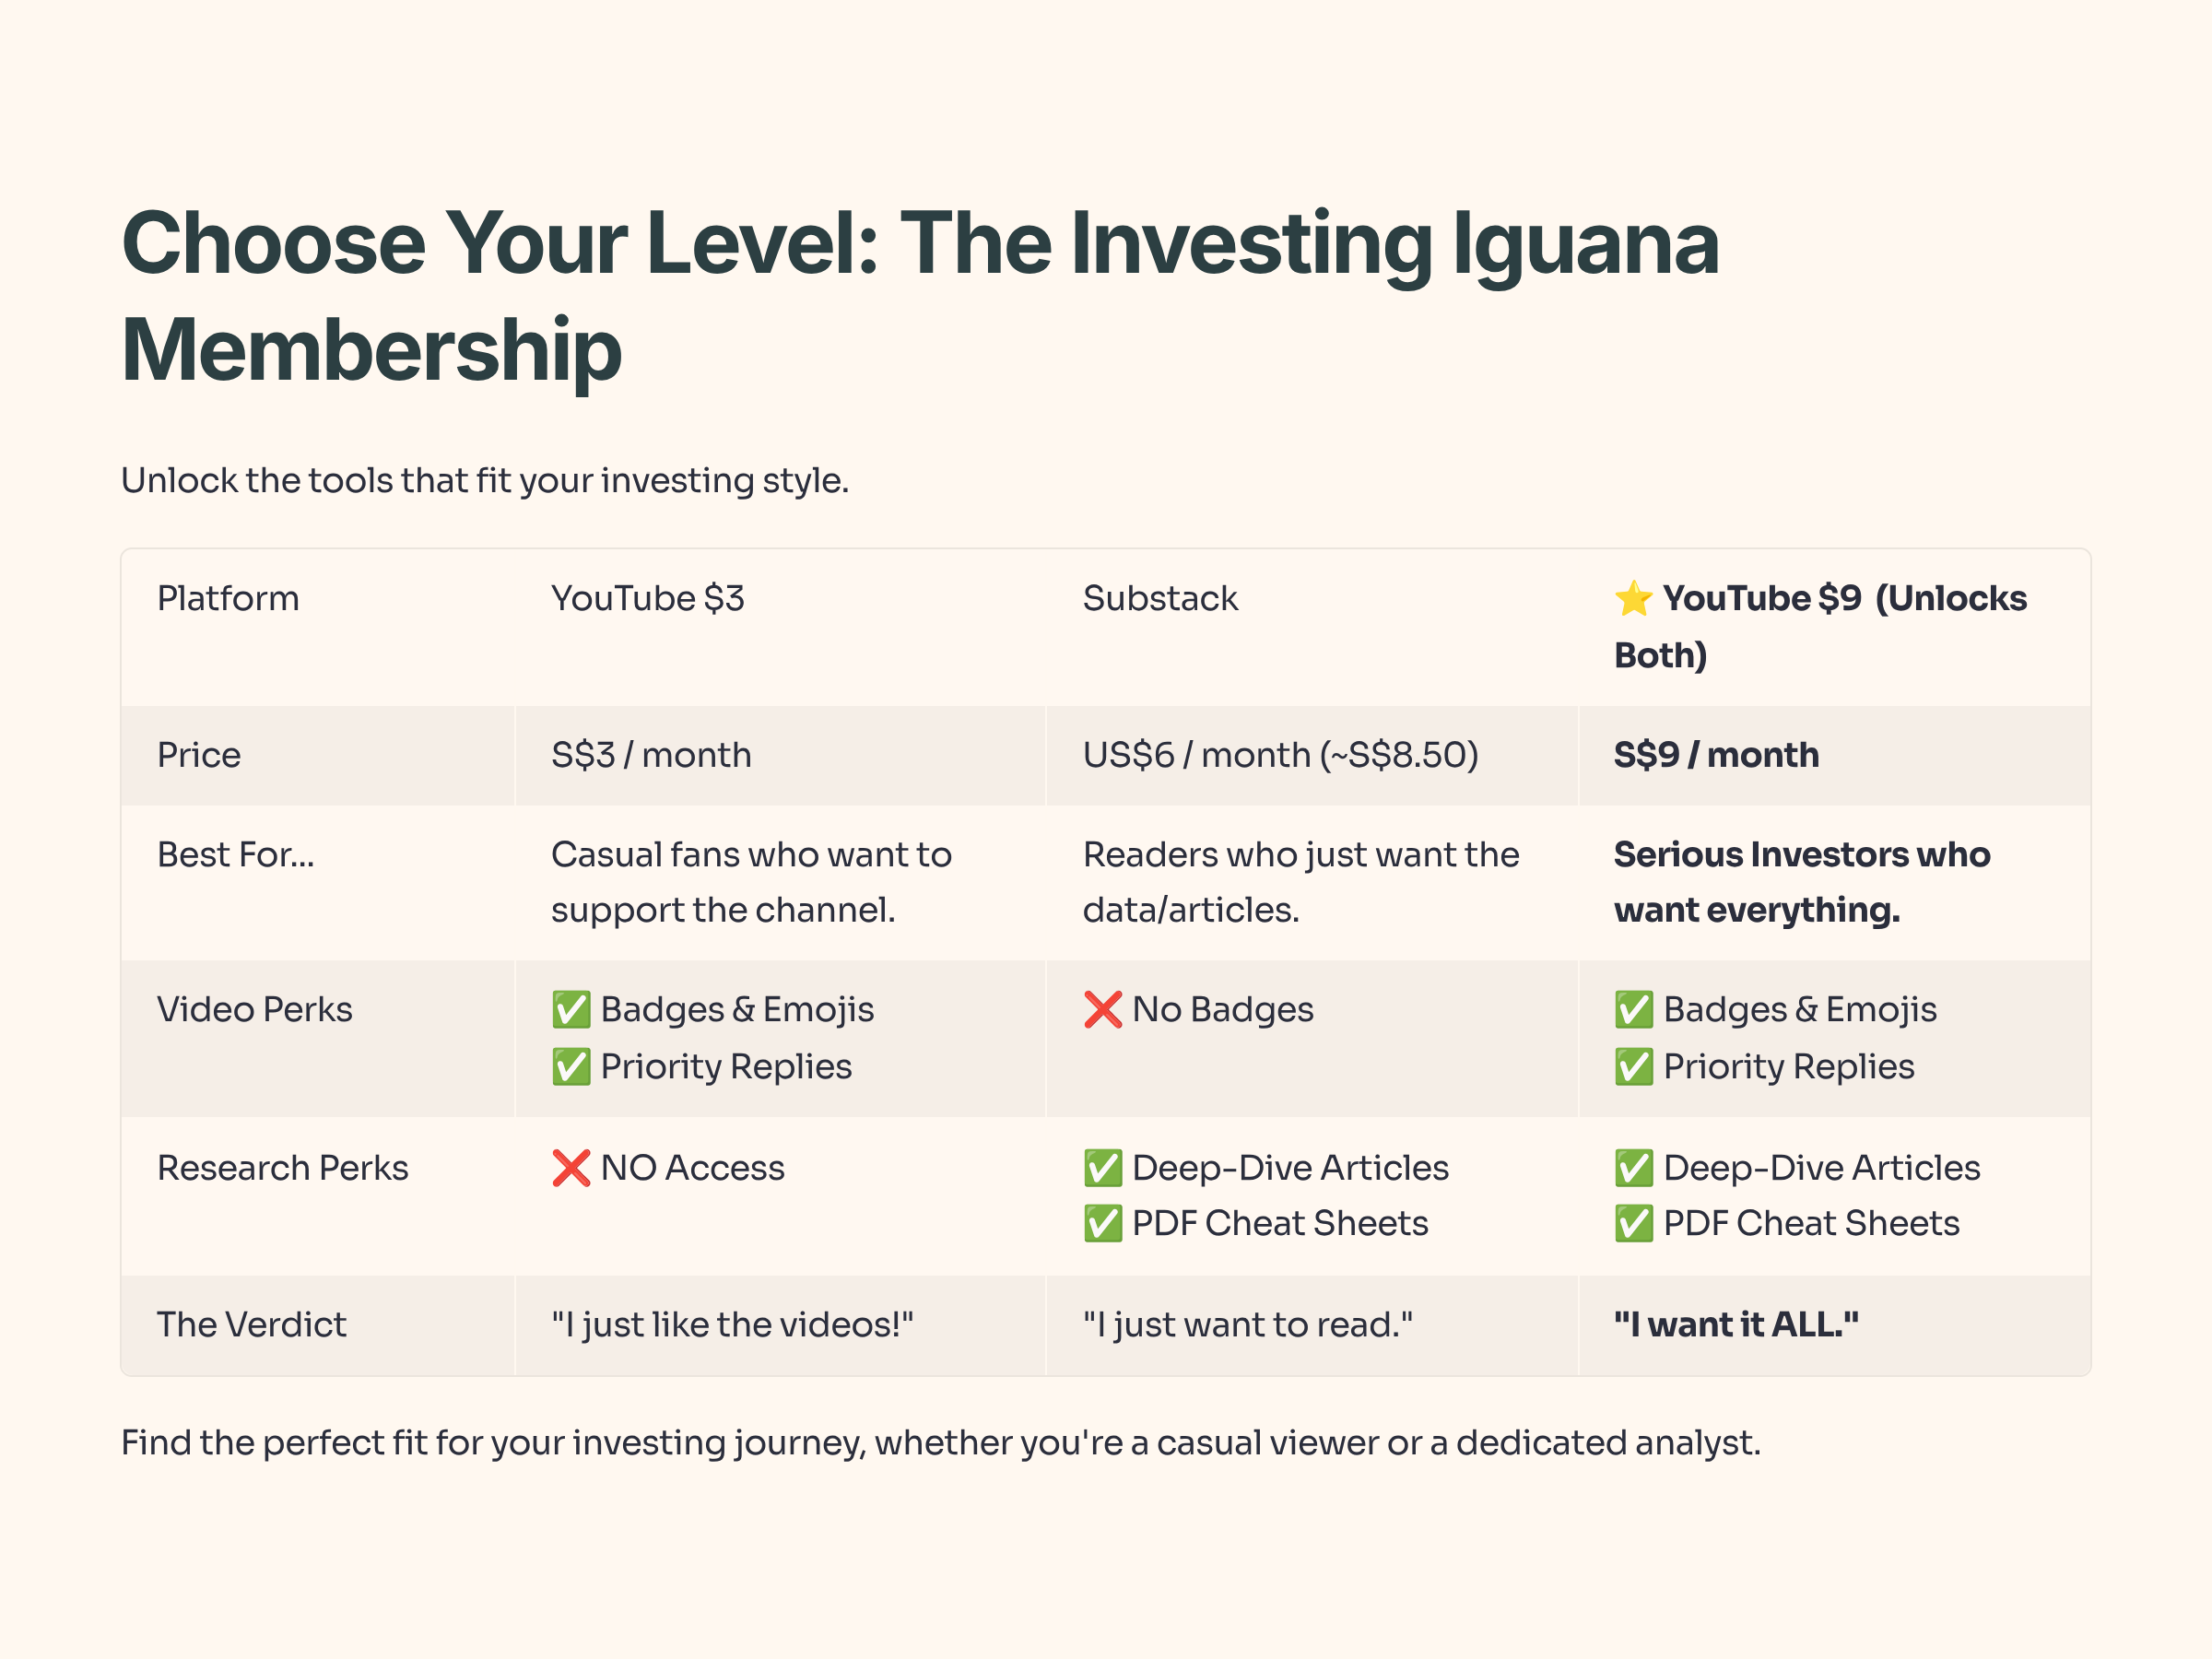
Quick Housekeeping: If you want the best value, the YouTube Premium Membership (S$9/mth) bundles these deep-dive articles with the podcast videos. Substack alone is US$6, so the bundle is the “smart money” move. Now, let’s get to the numbers.
In This Article:

• S-Reits Just Had Their Best Year Since 2019
• Why Did Retail Buy S$1B While Institutions Sold?
• The Interest Rate Story Isn’t Over
• InvestingPro Reality Check
• The Mapletree Question: Are Dividends Sustainable?
• What This Means for Your CPF and SRS Portfolio
• Iggy's Verdict / Conclusion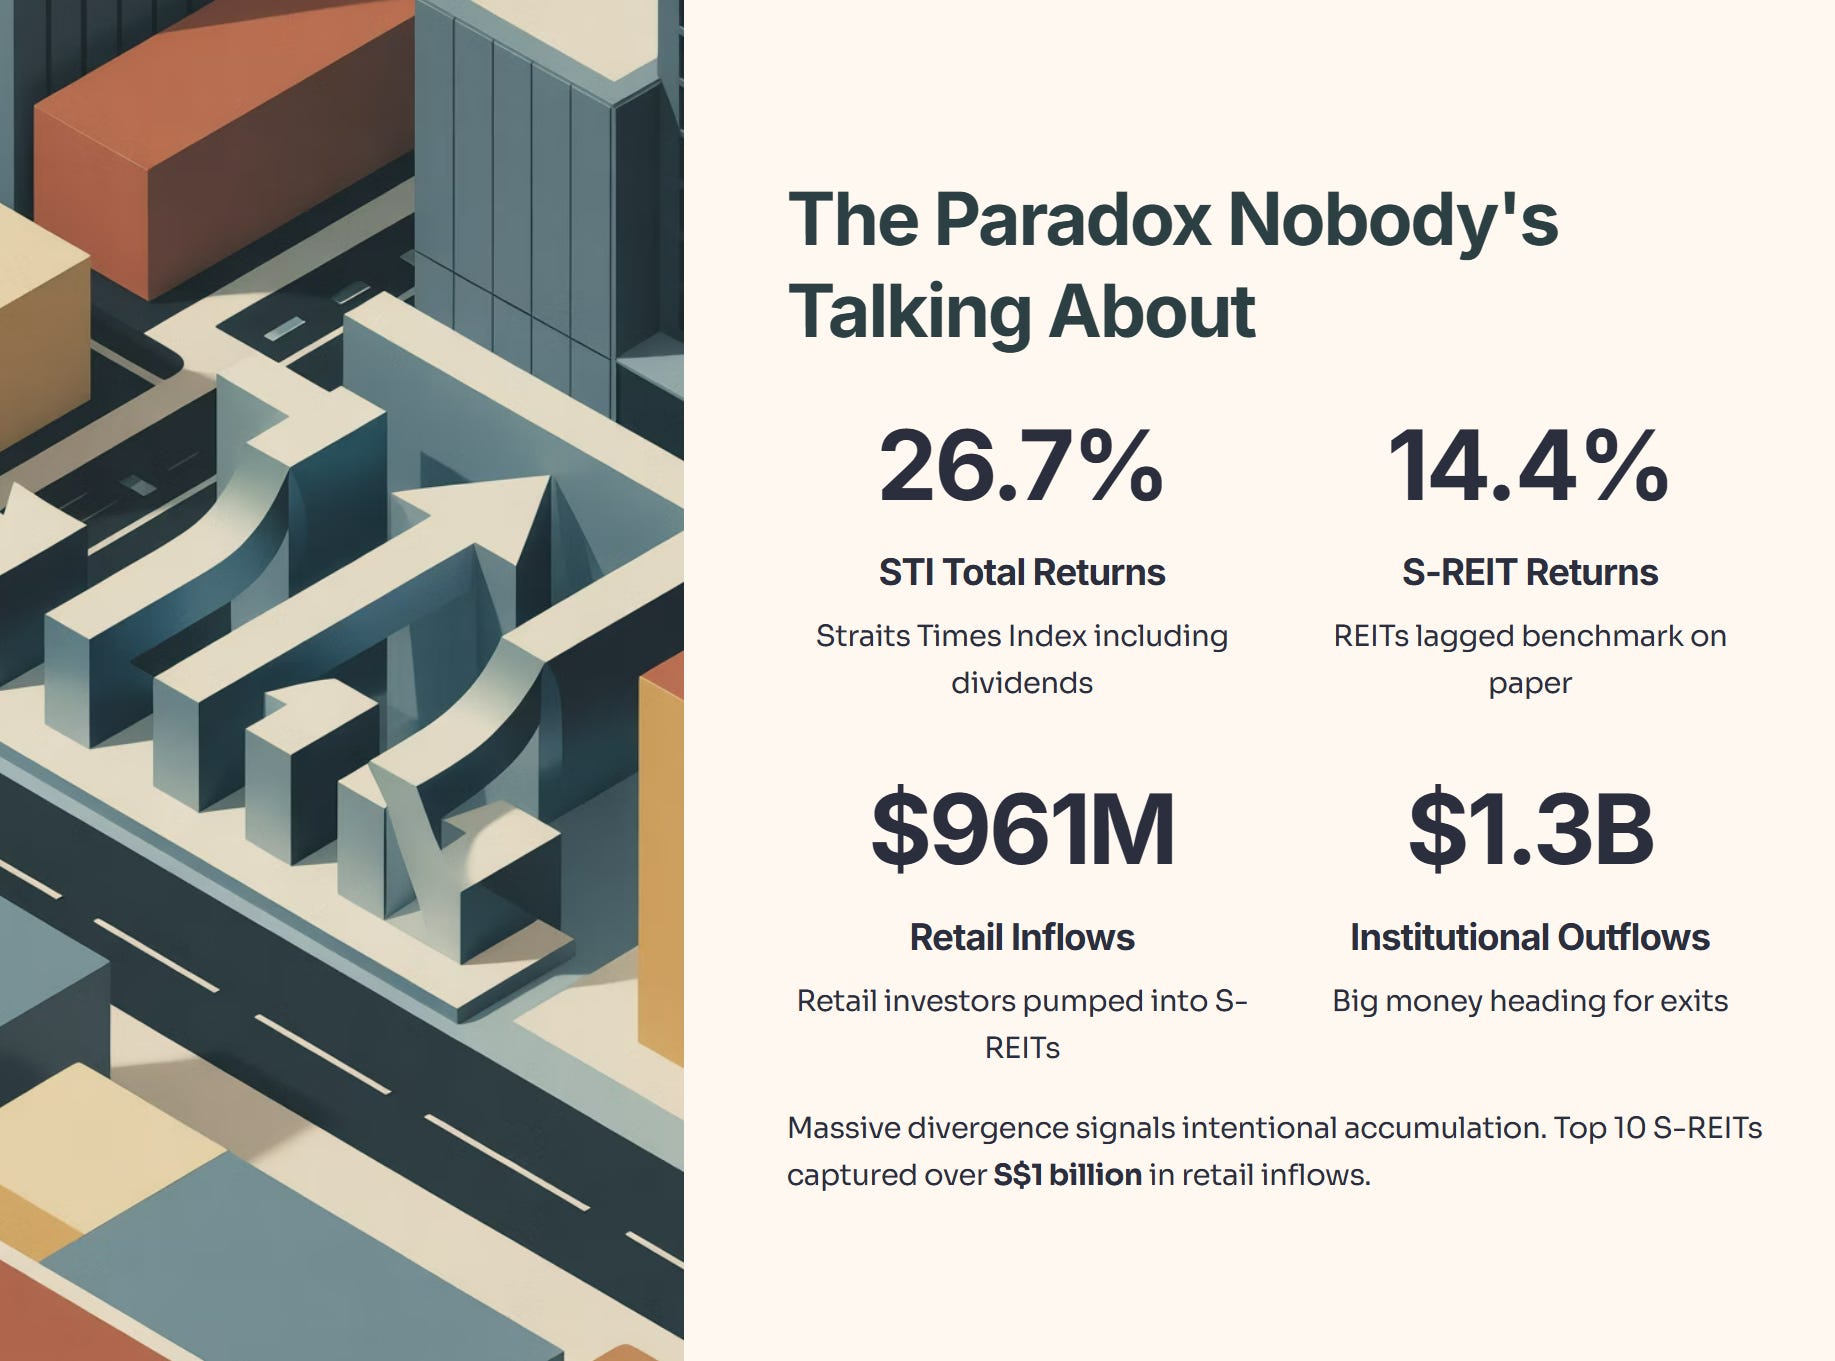
The Paradox Nobody’s Talking About
With just a week left in 2025, the numbers are clear: the Straits Times Index delivered 26.7% total returns (including dividends), while Singapore REITs landed at 14.4%.
On paper, REITs lagged the benchmark. But here’s the plot twist that matters more: retail investors pumped S$961 million into S-Reits while institutional investors pulled out S$1.3 billion.

That’s a massive divergence. And it signals something important.
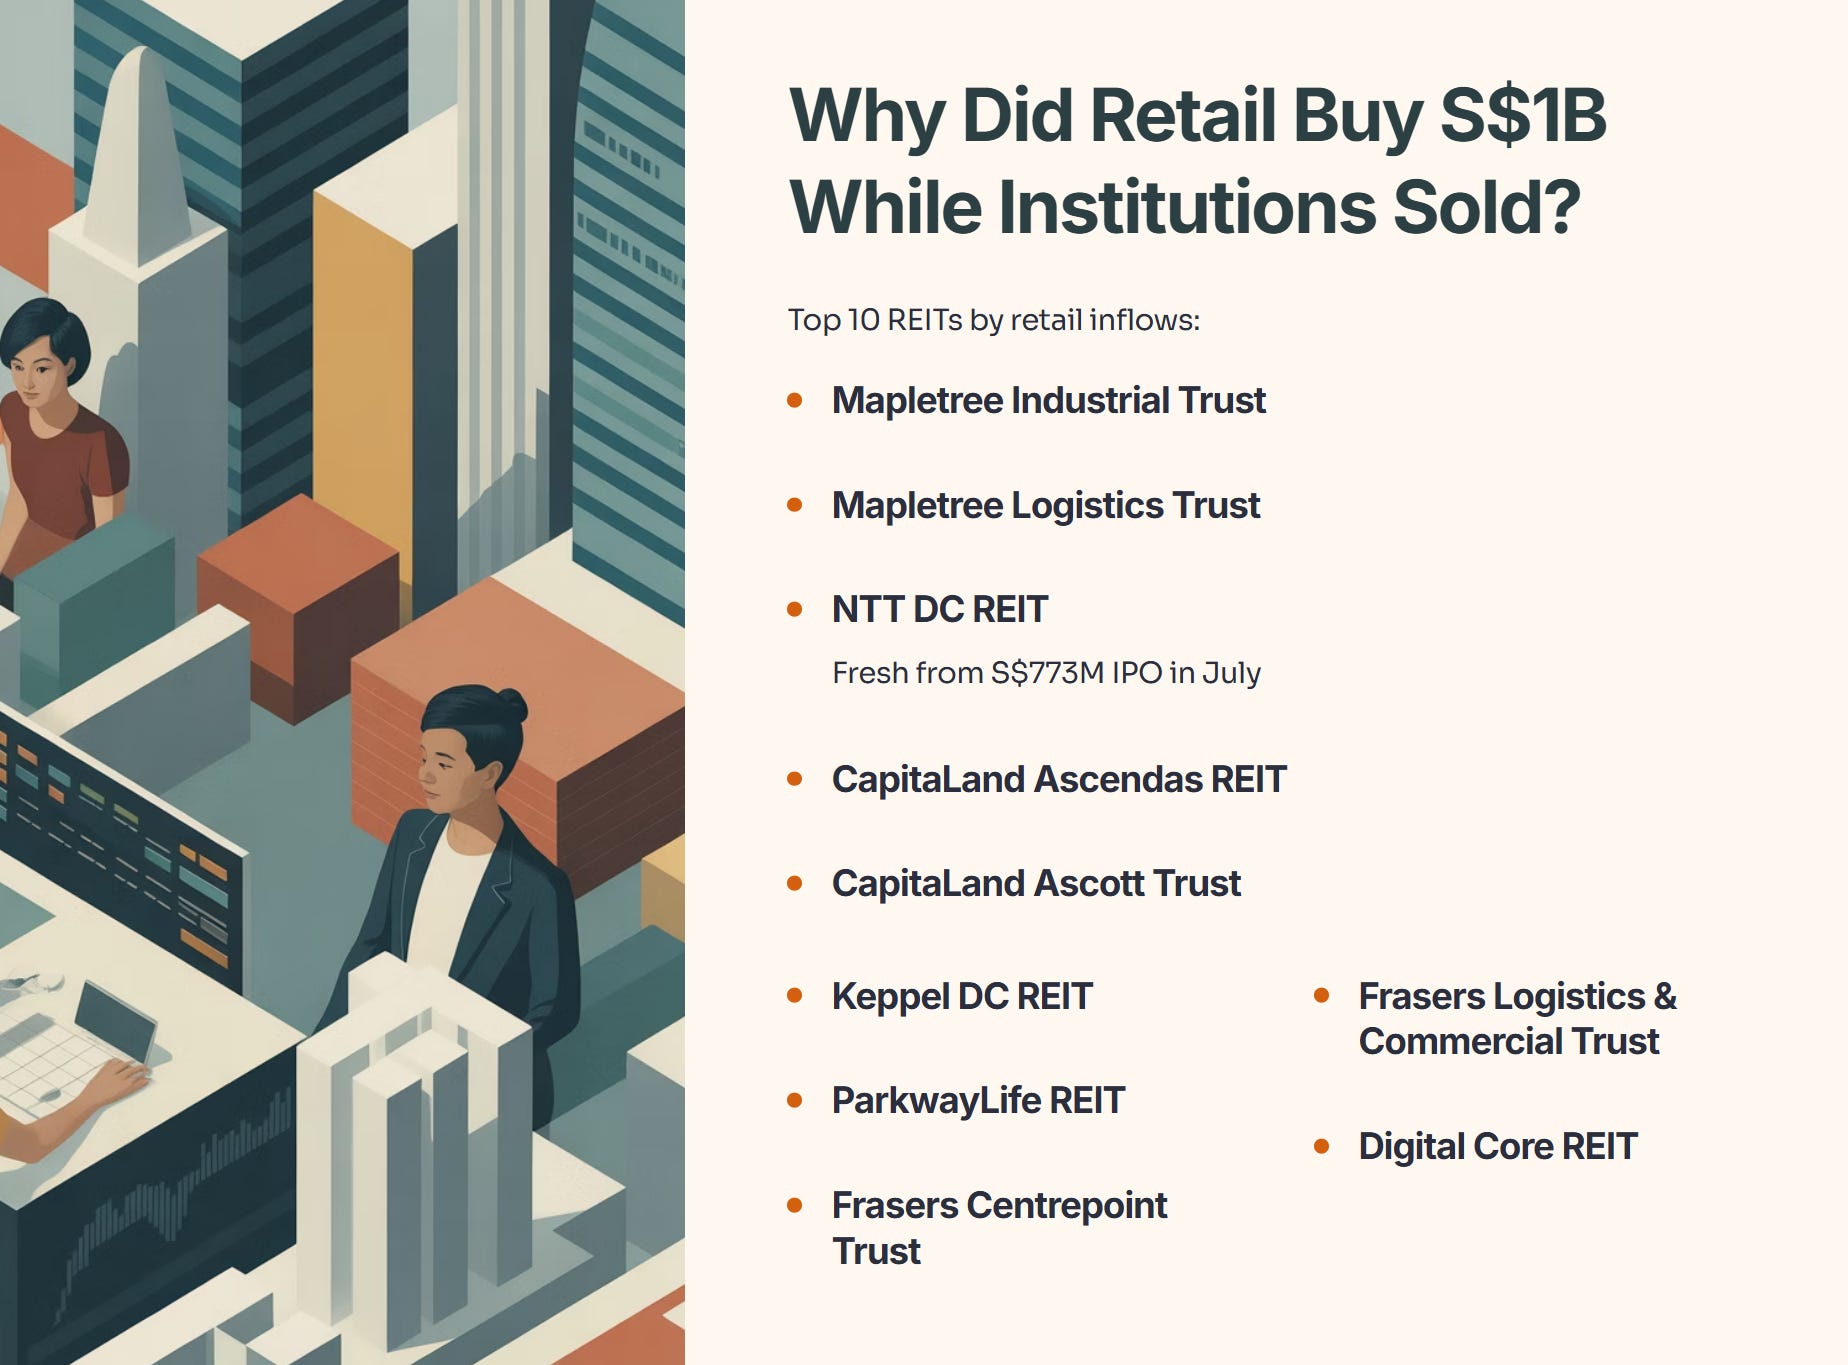
This isn’t casual buy-and-hold money. It’s intentional accumulation. The top 10 S-Reits alone captured over S$1 billion in retail inflows—enough to rebuild a portfolio, enough to signal conviction. Meanwhile, the big money was heading for the exits. So the question isn’t “Did REITs perform well?” It’s “Why did retail investors load up precisely when institutions dumped?”
The answer sits at the intersection of three forces: lower interest rates, attractive valuations, and a rational bet on dividend sustainability.
Iggy’s Take:
Whenever I see retail zig while institutions zag, I pay attention. Usually, retail is the “dumb money” chasing a top. But this time? Retail money is stickier. It’s often aimed at 5-year+ holding periods, CPF contribution schedules, or SRS tax-deductible investing. When retail money pours in despite institutional selling, it’s often a contrarian signal worth respecting: they are buying the yield floor while institutions are forced to chase growth elsewhere.
S-Reits Just Had Their Best Year Since 2019
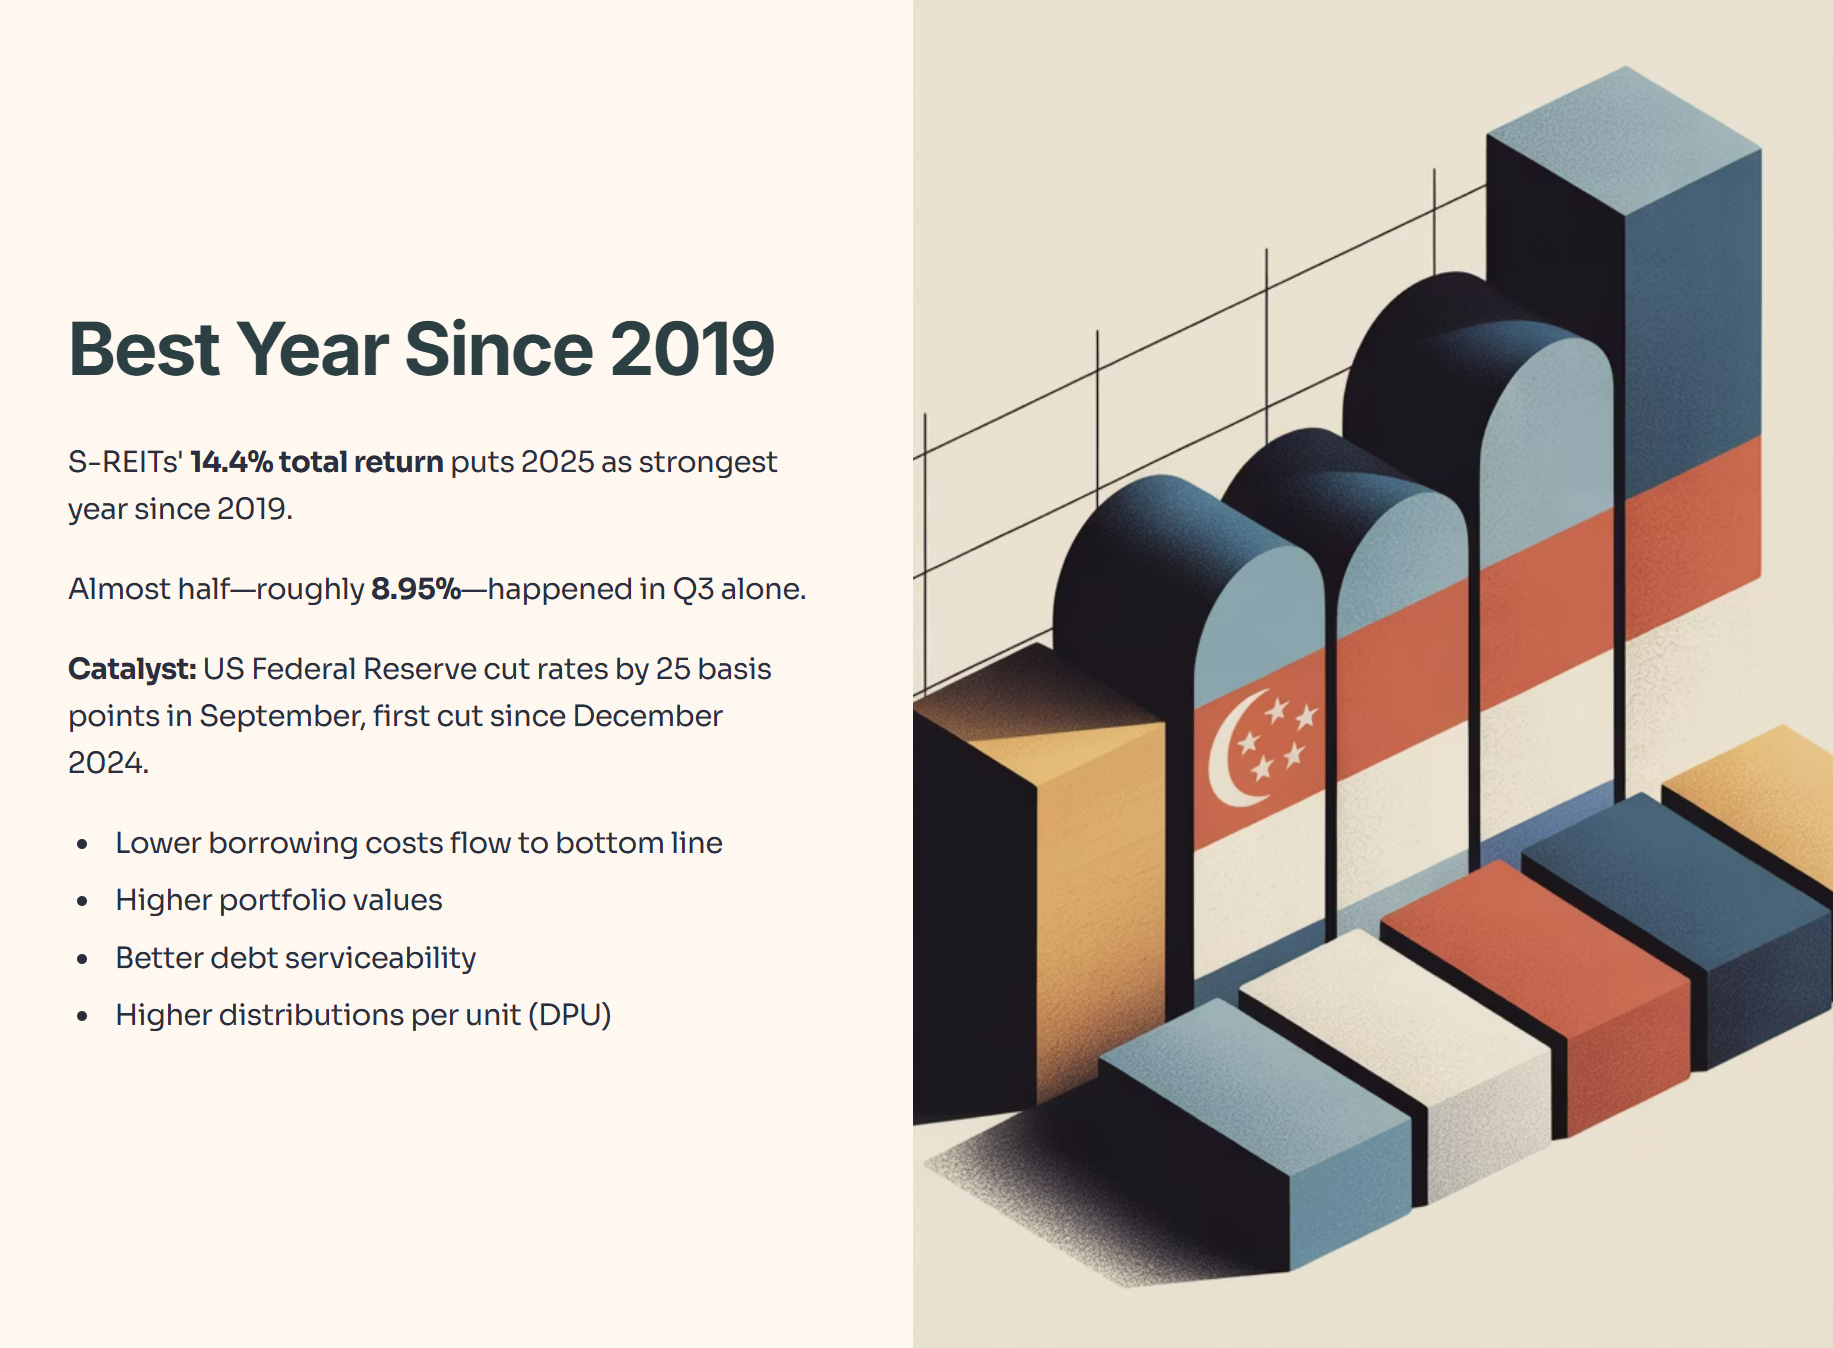
Let’s anchor the numbers first. S-Reits’ 14.4% total return puts 2025 on track as the sector’s strongest year since 2019. That performance didn’t come evenly. Almost half of it—roughly 8.95% in total returns—happened in a single quarter: Q3. The catalyst was clear: the US Federal Reserve cut rates by 25 basis points in September, the first cut since December 2024.
This matters because REITs are inherently sensitive to interest rates. Lower borrowing costs flow directly to the bottom line. Higher portfolio values. Better debt serviceability. And crucially, higher distributions per unit (DPU)—the metric that turns your dividend yield from a promise into a paycheck.
Within the sector, diversified REITs led the pack.
Table 1: S-Reits Segment Performance (2025 YTD)
Why Did Retail Buy S$1B While Institutions Sold?
This bifurcation—retail in, institutions out—shouldn’t be dismissed as retail FOMO. Look at the stocks they chose.
The top 10 REITs by retail inflows include: Mapletree Industrial Trust, Mapletree Logistics Trust, NTT DC REIT (fresh from a S$773 million IPO in July), CapitaLand Ascendas REIT, CapitaLand Ascott Trust, Keppel DC REIT, ParkwayLife REIT, Frasers Centrepoint Trust, Frasers Logistics & Commercial Trust, and Digital Core REIT.
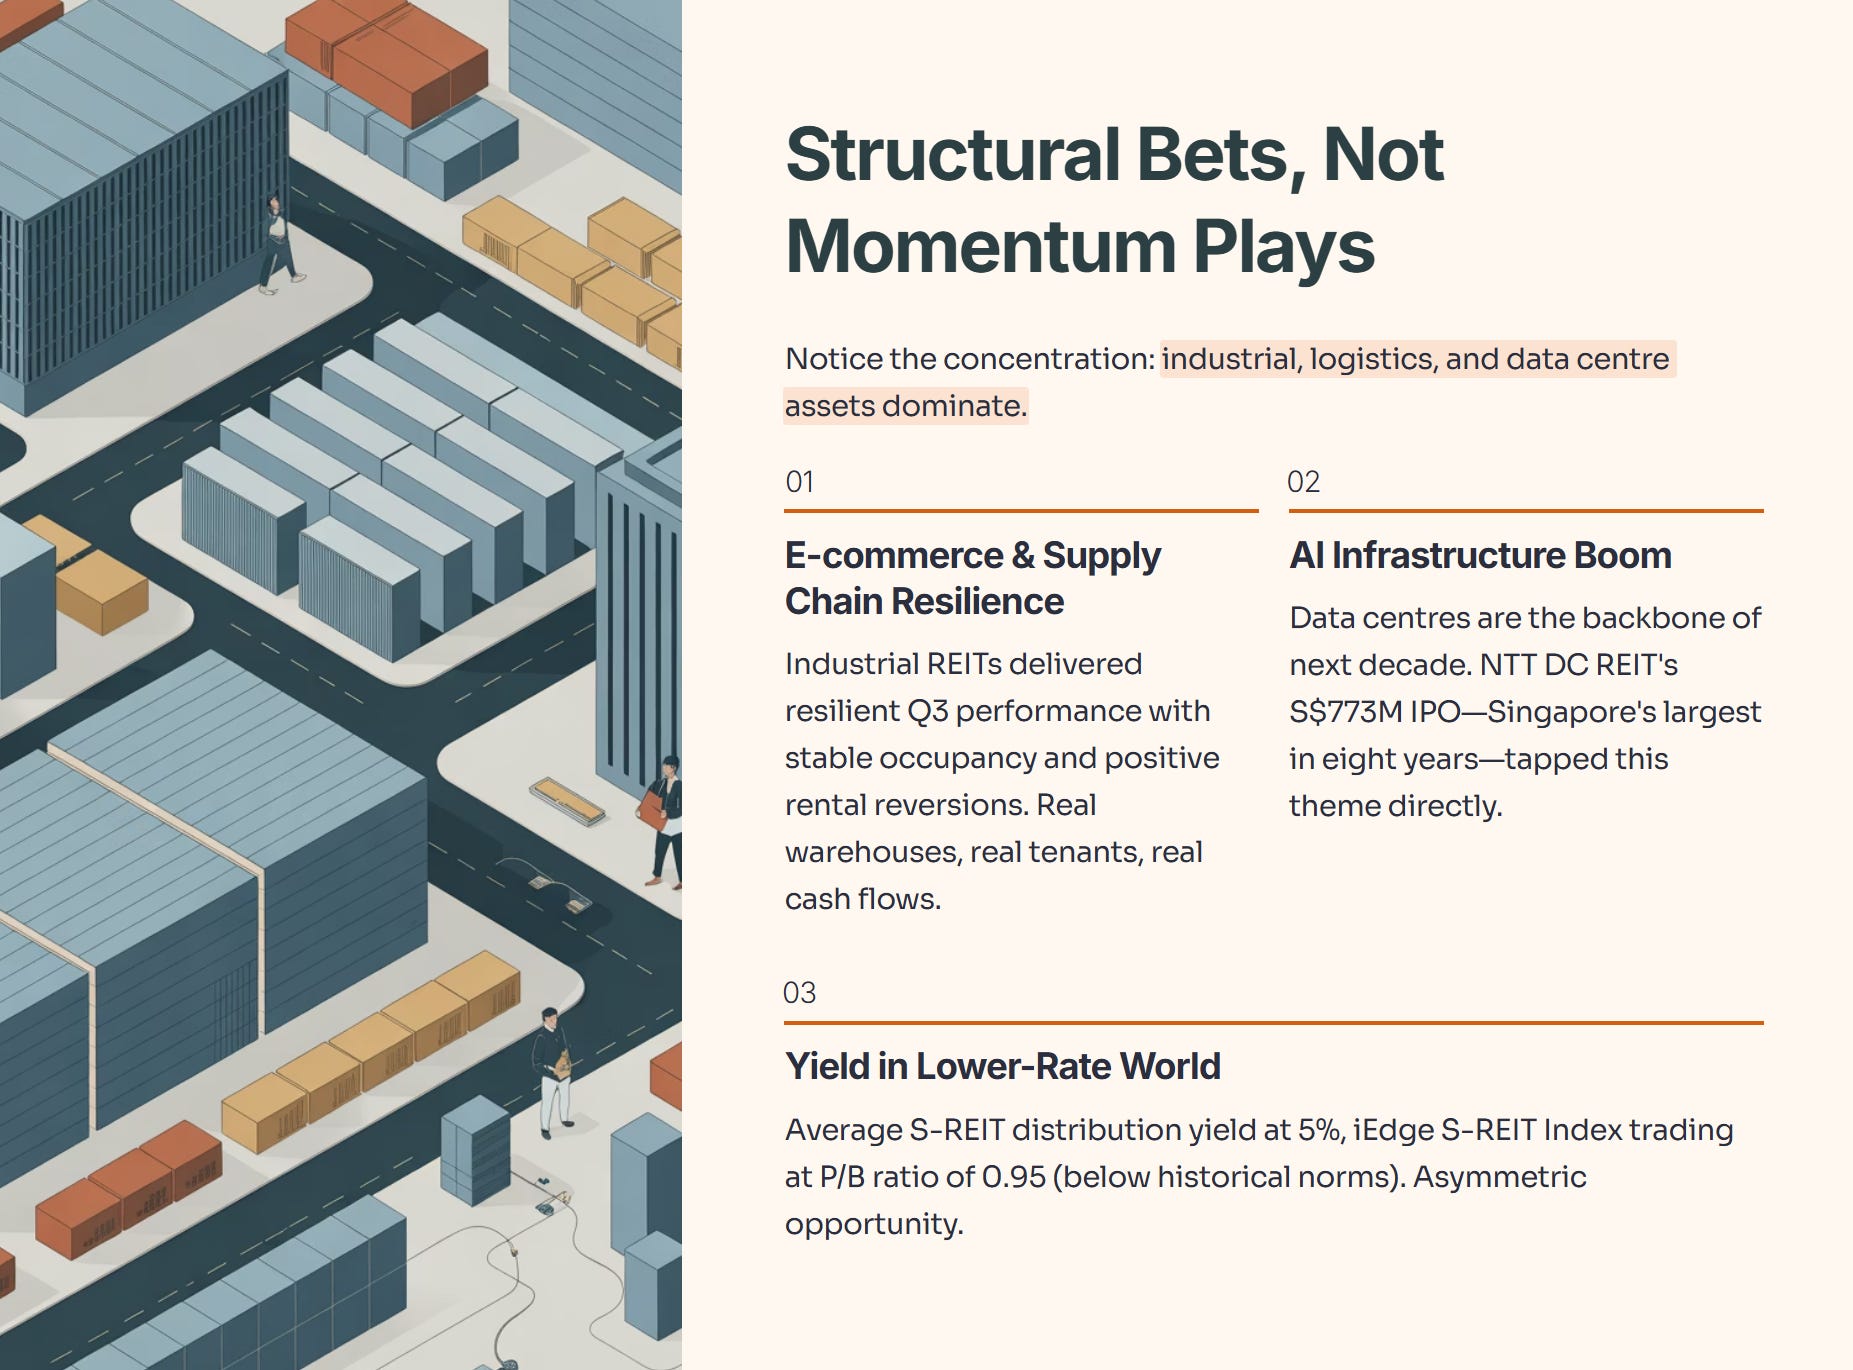
Notice the concentration: industrial, logistics, and data centre assets dominate. These aren’t momentum plays. They are structural bets on:
E-commerce and supply chain resilience. Industrial REITs delivered resilient performance in Q3 with stable occupancy and positive rental reversions. Real warehouses. Real tenants. Real cash flows.
The AI infrastructure boom. Data centres are the backbone of the next decade. NTT DC REIT’s IPO at S$773 million—Singapore’s largest IPO in eight years—tapped into this theme directly.
Yield in a lower-rate world. With the average S-REIT distribution yield at 5%, and the iEdge S-Reit Index trading at a P/B ratio of 0.95 (below historical norms), retail investors saw an asymmetric opportunity.
Iggy’s Insight:
Institutions operate on quarterly cycles; they must rotate to where the momentum is (currently tech and banks). You, the retail investor, don’t have that mandate. You can afford to buy assets trading below book value and wait for the cycle to turn. You are getting paid 5-6% to wait. That is the definition of “getting paid to be patient.”
The Interest Rate Story Isn’t Over
Here’s what most analysts miss: the S-Reit upside isn’t done.
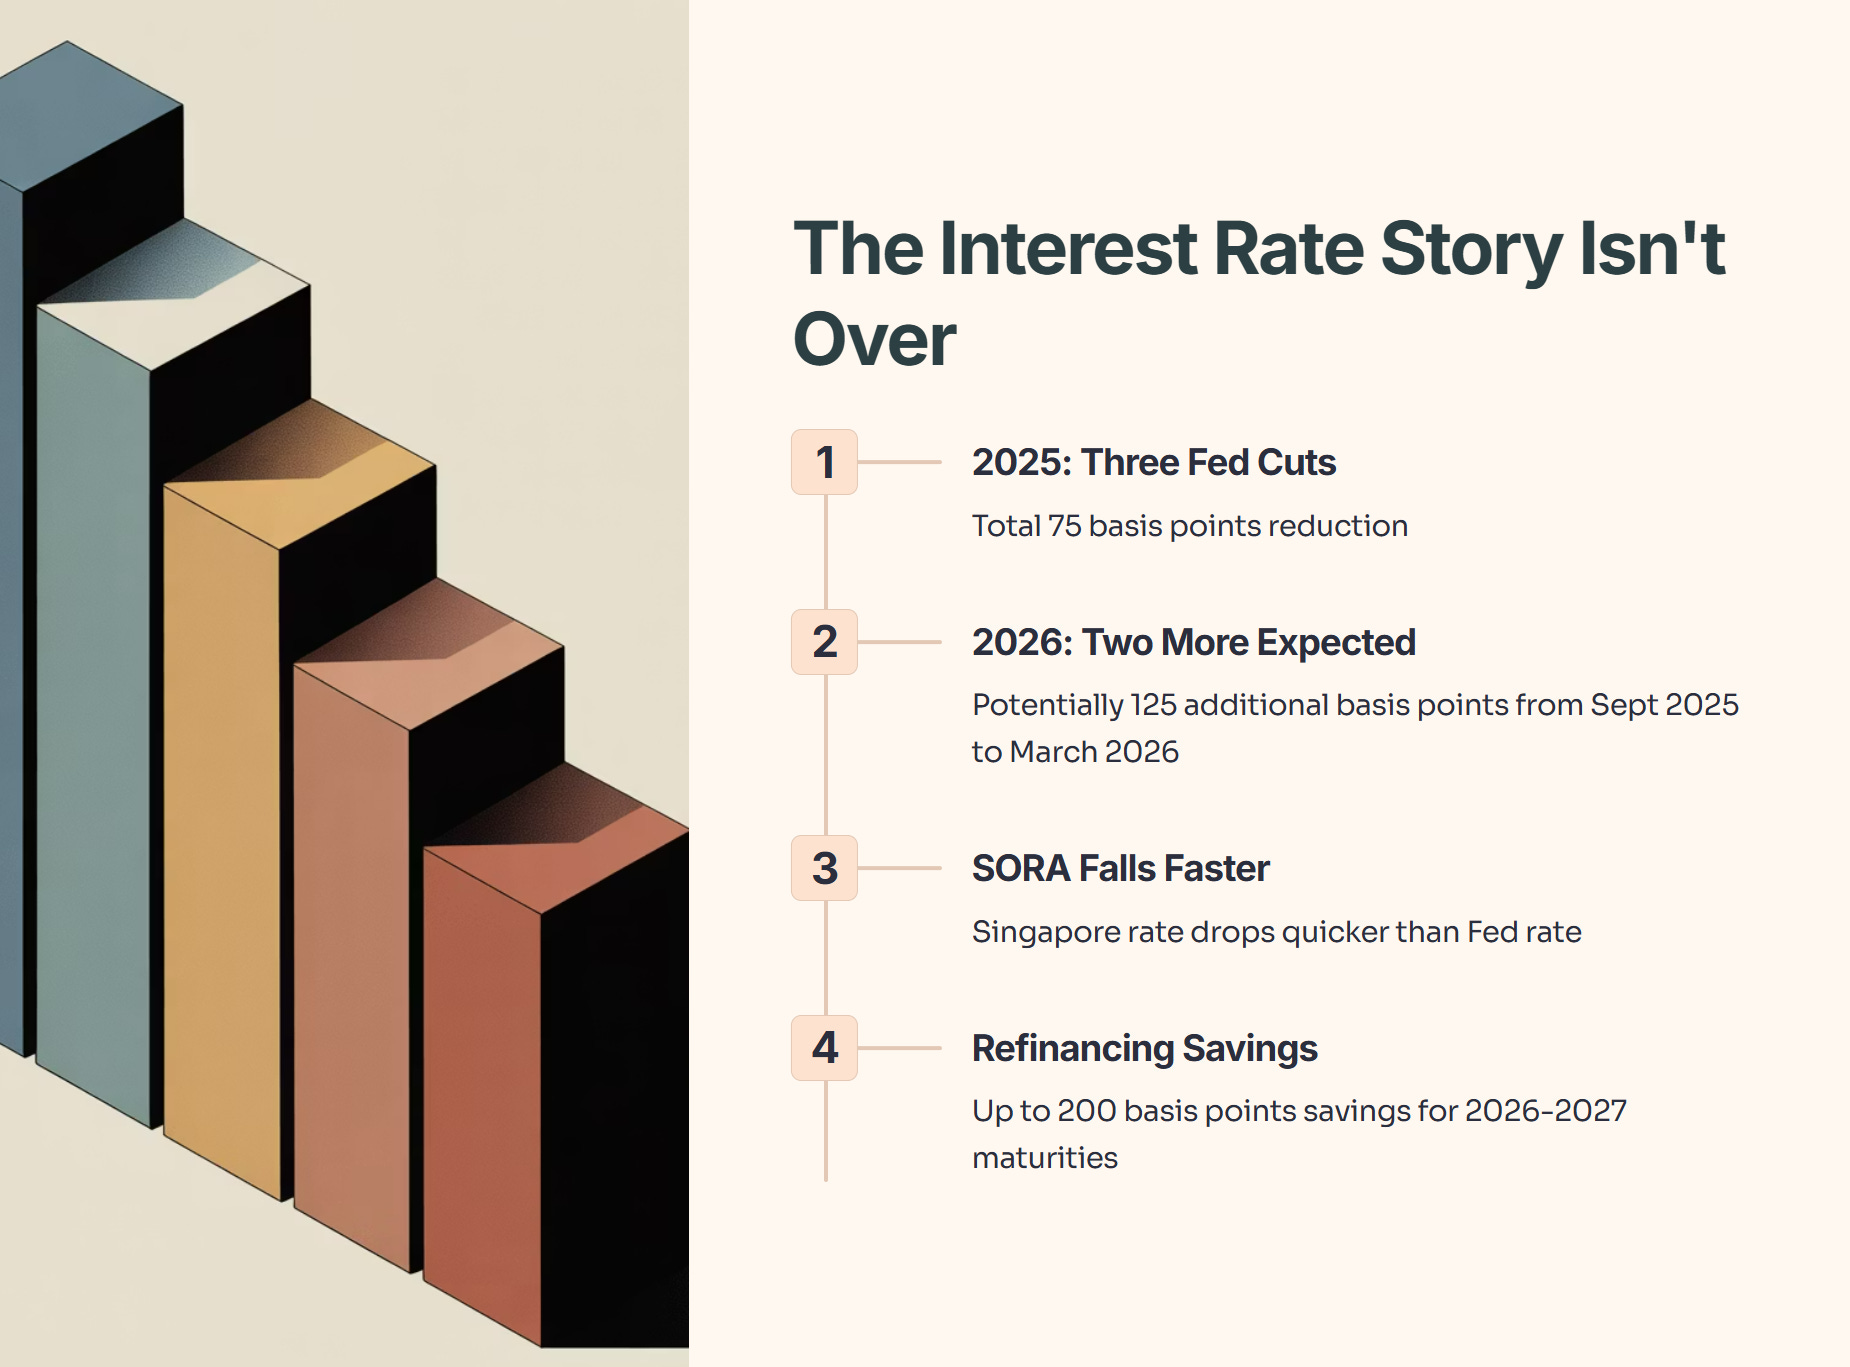
The US Federal Reserve cut rates three times in 2025 (total 75 basis points). Market consensus expects at least two more cuts in 2026, potentially 125 additional basis points from September 2025 to March 2026.
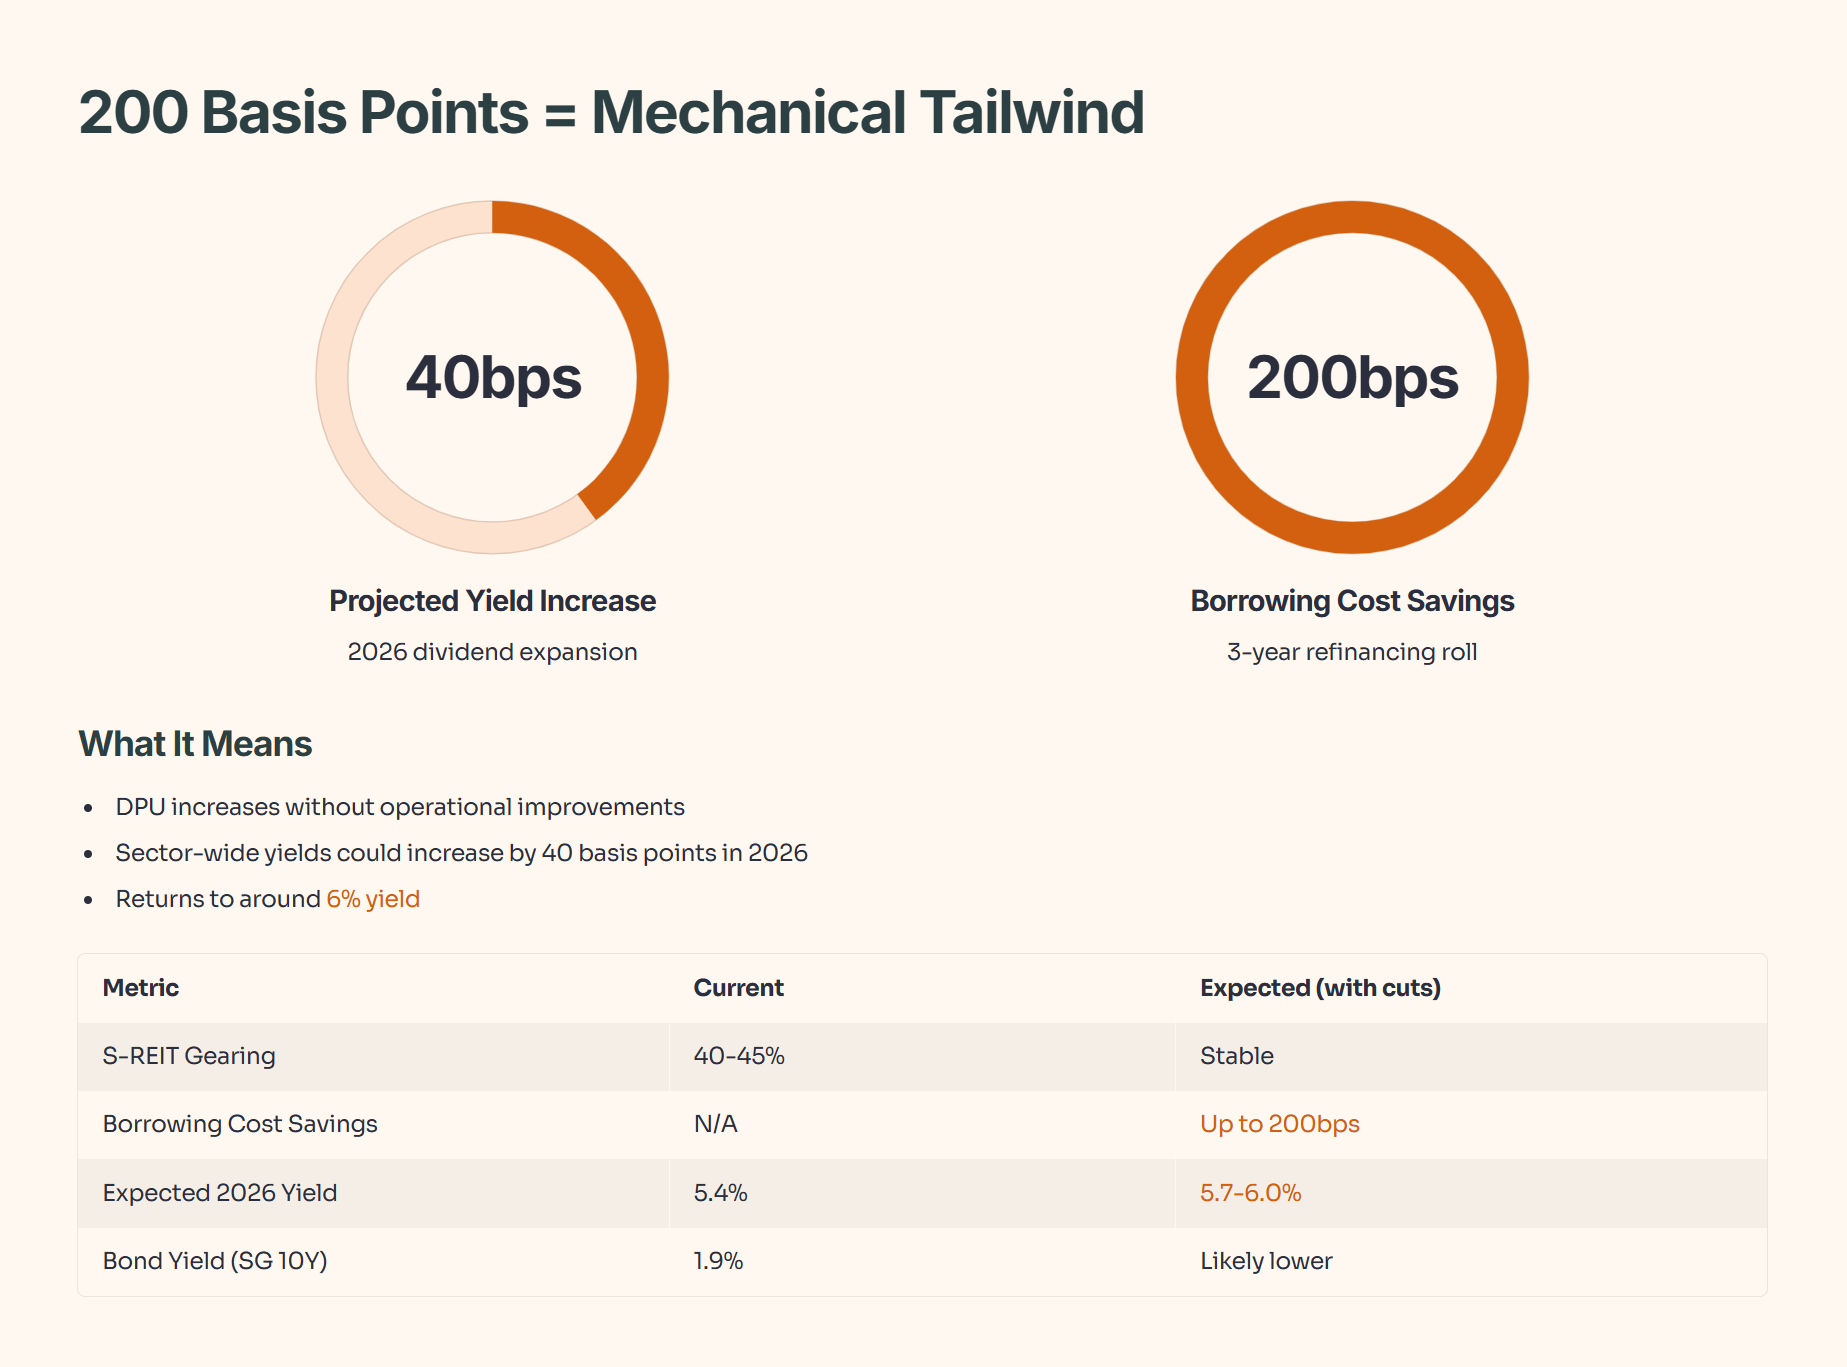
For S-Reits with Singapore dollar borrowings, the picture is even better. SORA (Singapore Overnight Rate Average) tends to fall faster than the Fed rate, meaning refinancing of loans maturing in 2026–2027 could see up to 200 basis points in savings, assuming a 3-year refinancing roll.
What does 200 basis points in borrowing cost savings mean?
It means DPU increases without underlying operations needing to improve. It’s a mechanical tailwind. Analysts project that sector-wide yields could increase by about 40 basis points in 2026, returning to around 6%.
Table 2: Interest Rate Refinancing Impact (2026-2027)
The Valuation Case (And Where to Validate It)
Numbers matter, but so does the framework you use to evaluate them. Valuation is where the rubber meets the road.
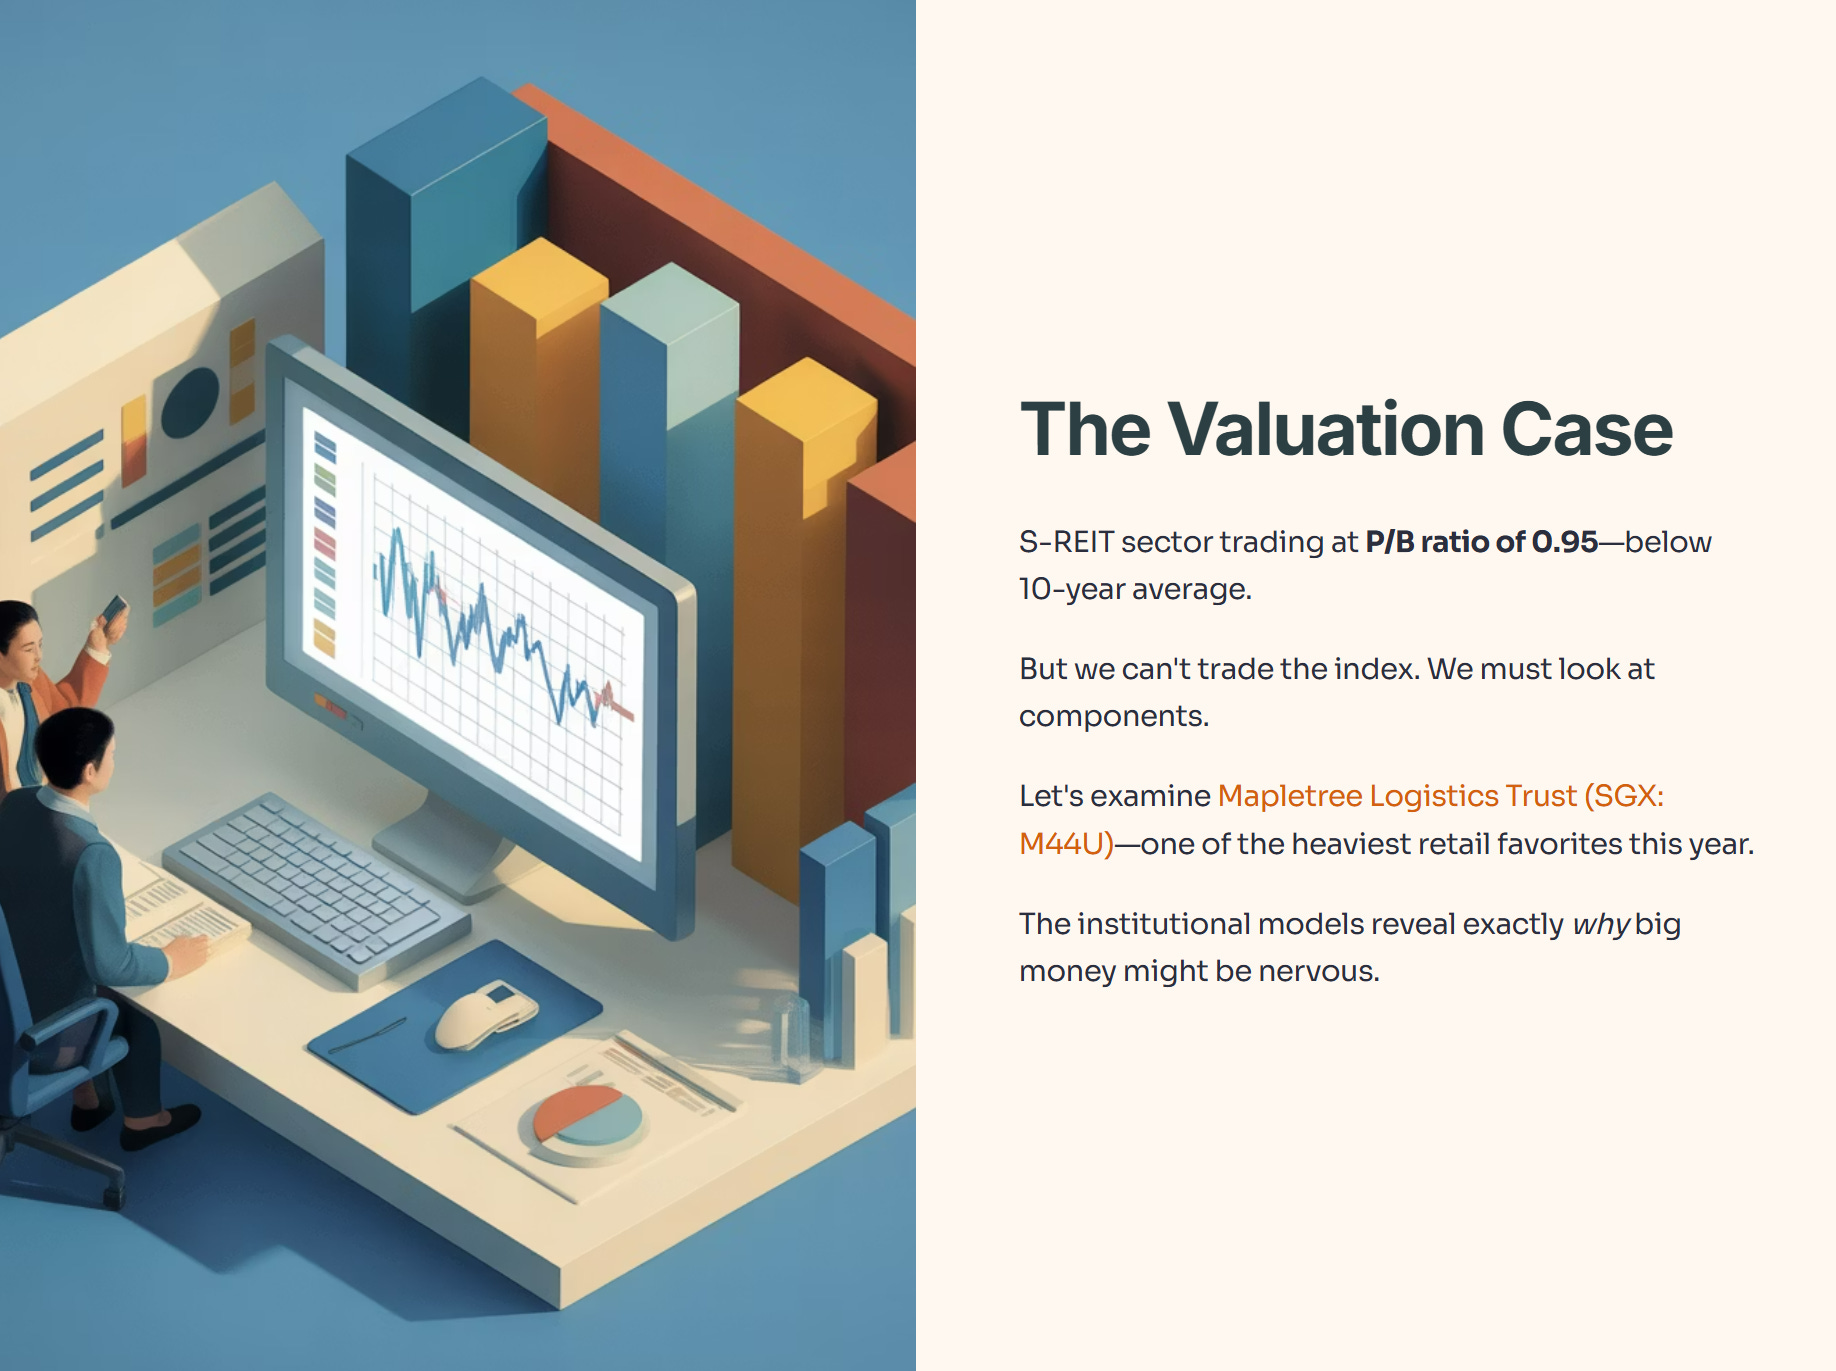
The S-REIT sector is trading at a price-to-book (P/B) ratio of roughly 0.95. That’s below its 10-year average. But since we can’t trade the index, we have to look at the components. I always stress-test the popular names.
Let’s look at Mapletree Logistics Trust (SGX: M44U), one of the heaviest retail favorites this year. I don’t just guess at valuations—I check the institutional models. And this time, the models reveal exactly why the big money might be nervous.
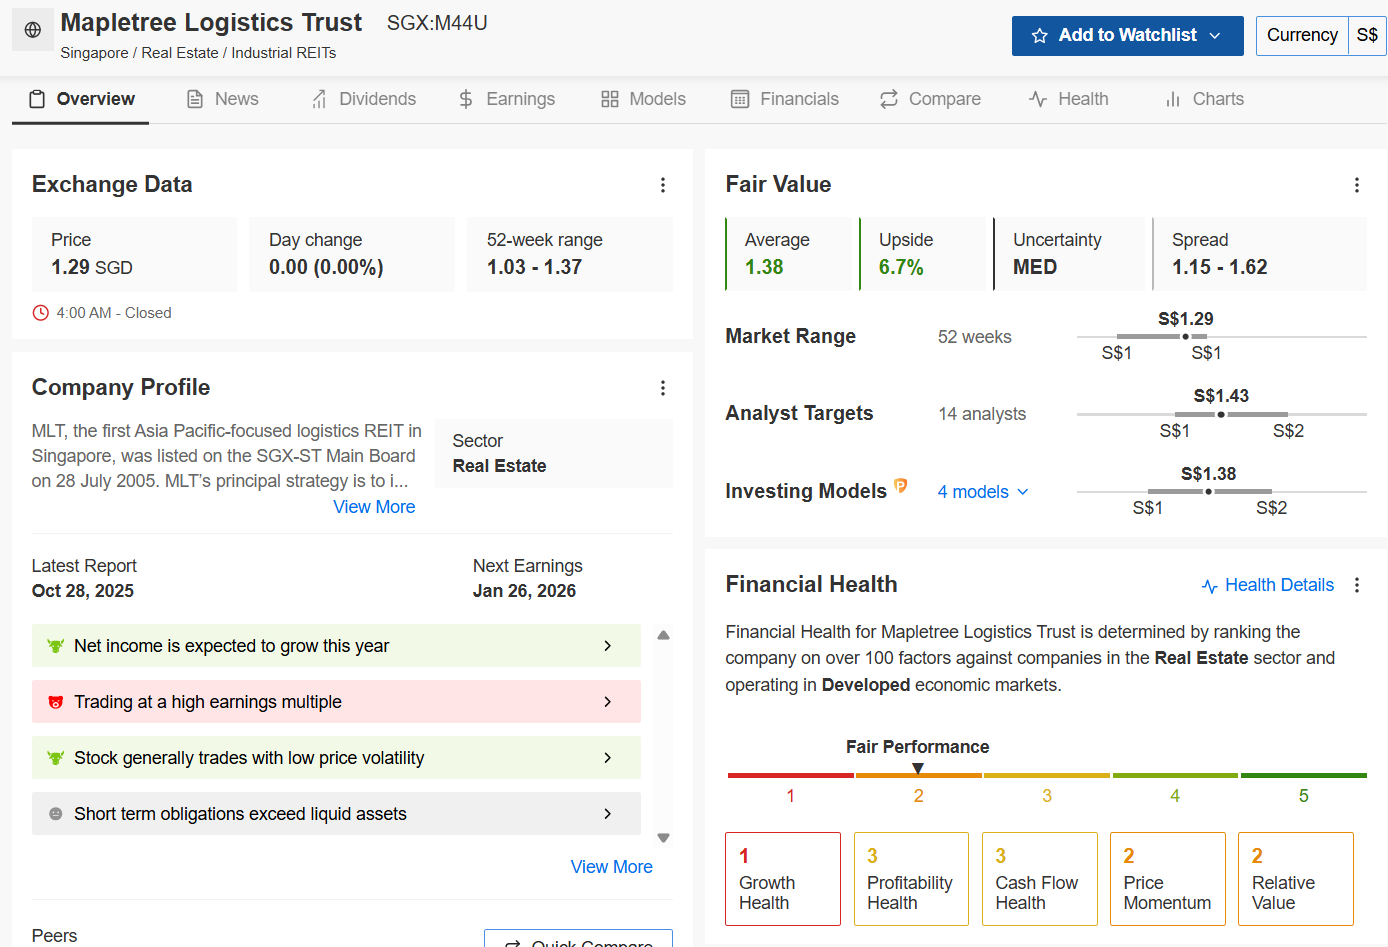
Source: InvestingPro (Data as of Dec 2025). Premium members can use code INVESTINGIGUANA for up to 50% off.
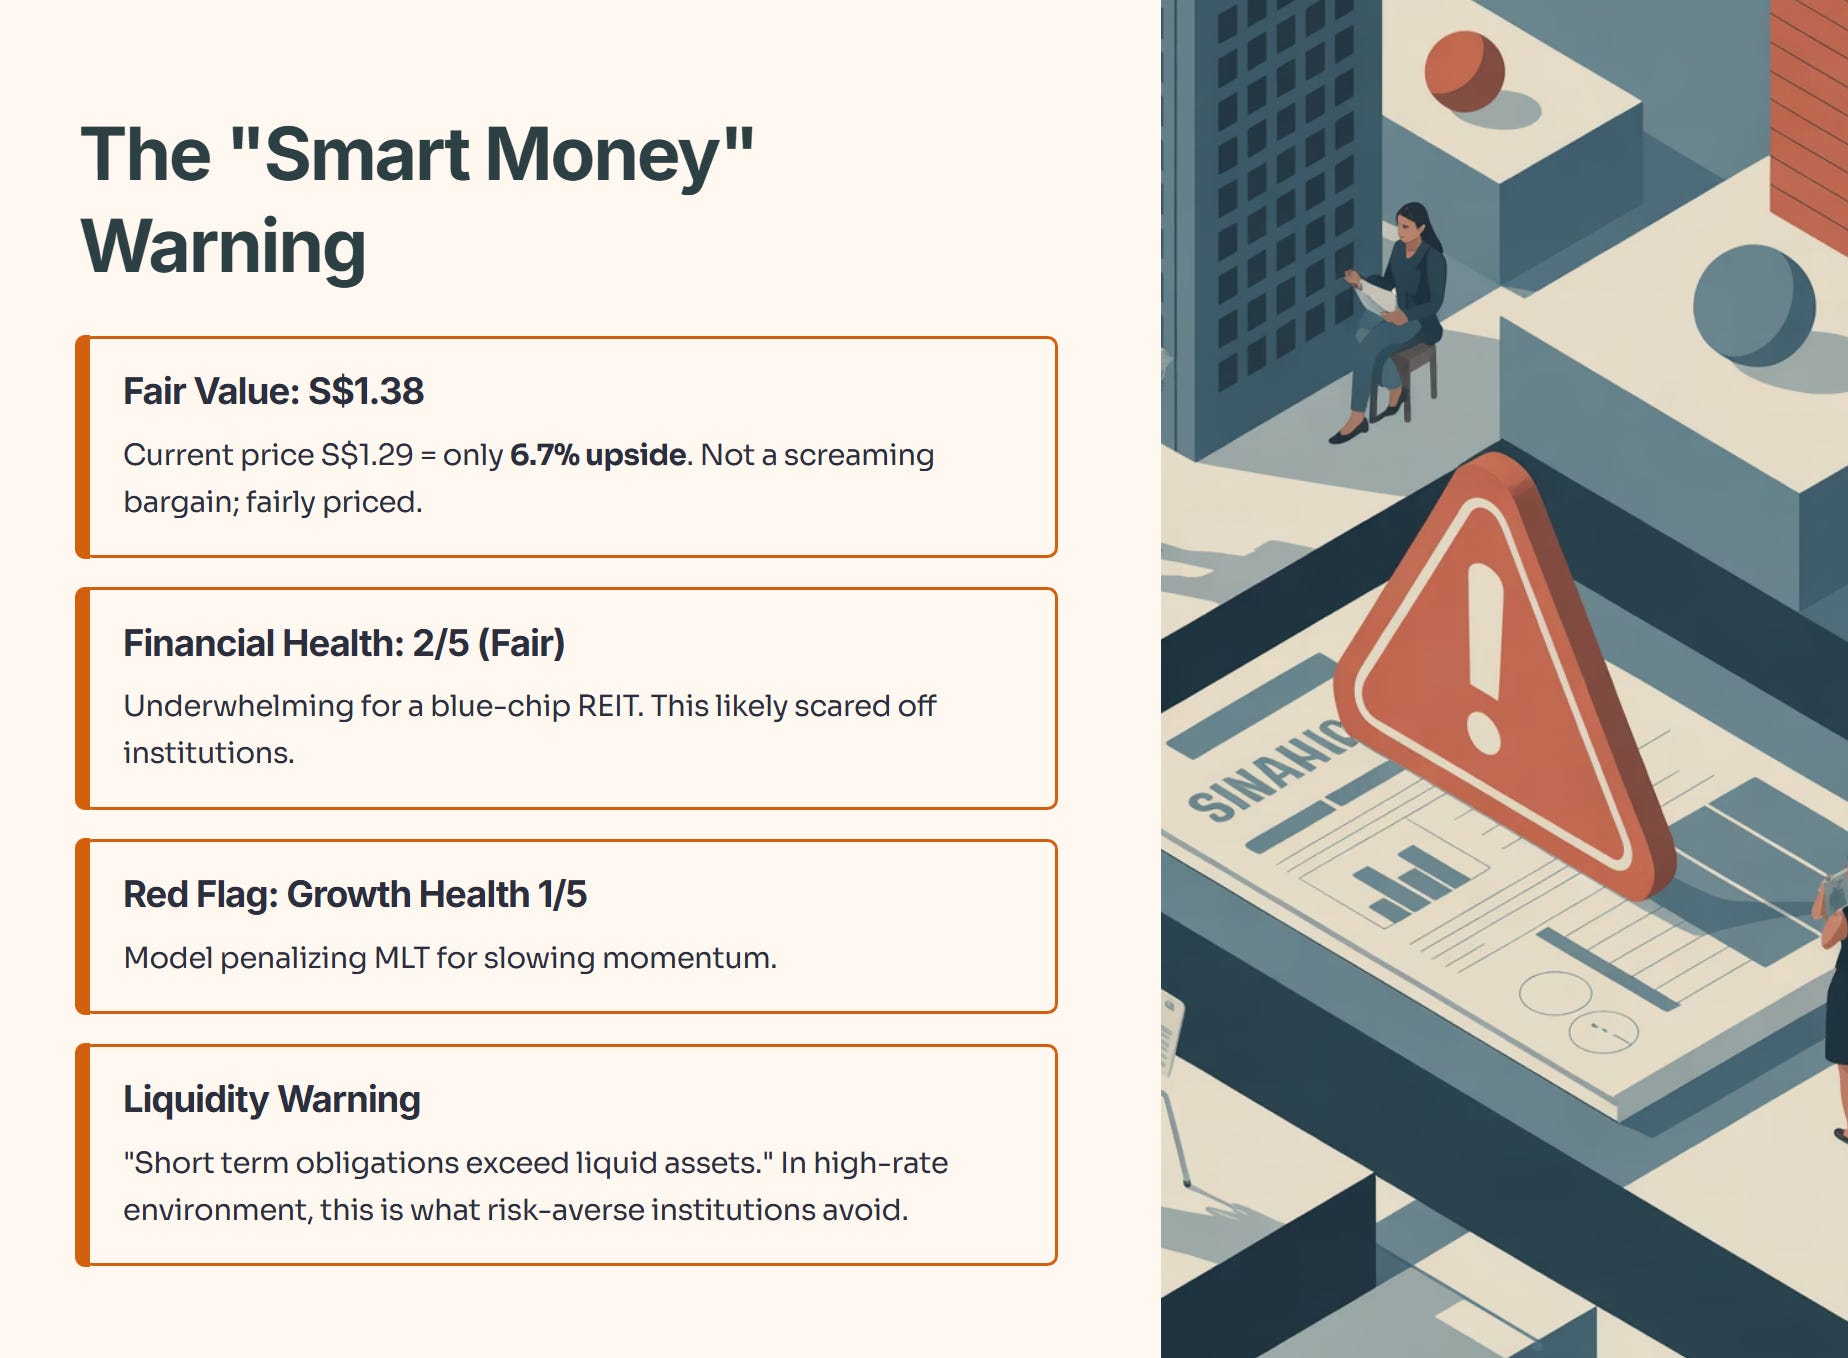
Data Check: The “Smart Money” Warning The InvestingPro model paints a much more cautious picture than the retail hype suggests:
Fair Value: S$1.38. At a current price of S$1.29, that’s only 6.7% upside. It’s not a screaming bargain; it’s fairly priced.
Financial Health Score: 2/5 (Fair). This is the metric that likely scared off the institutions. A “Fair” score for a blue-chip REIT is underwhelming.
The Red Flag: Look closely at the sub-scores. Growth Health is a 1/5. The model is penalizing MLT for slowing momentum.
Liquidity Warning: The pro tips highlight that “Short term obligations exceed liquid assets.” In a high-rate environment (even if rates are falling), this liquidity crunch is exactly what risk-averse institutions avoid.
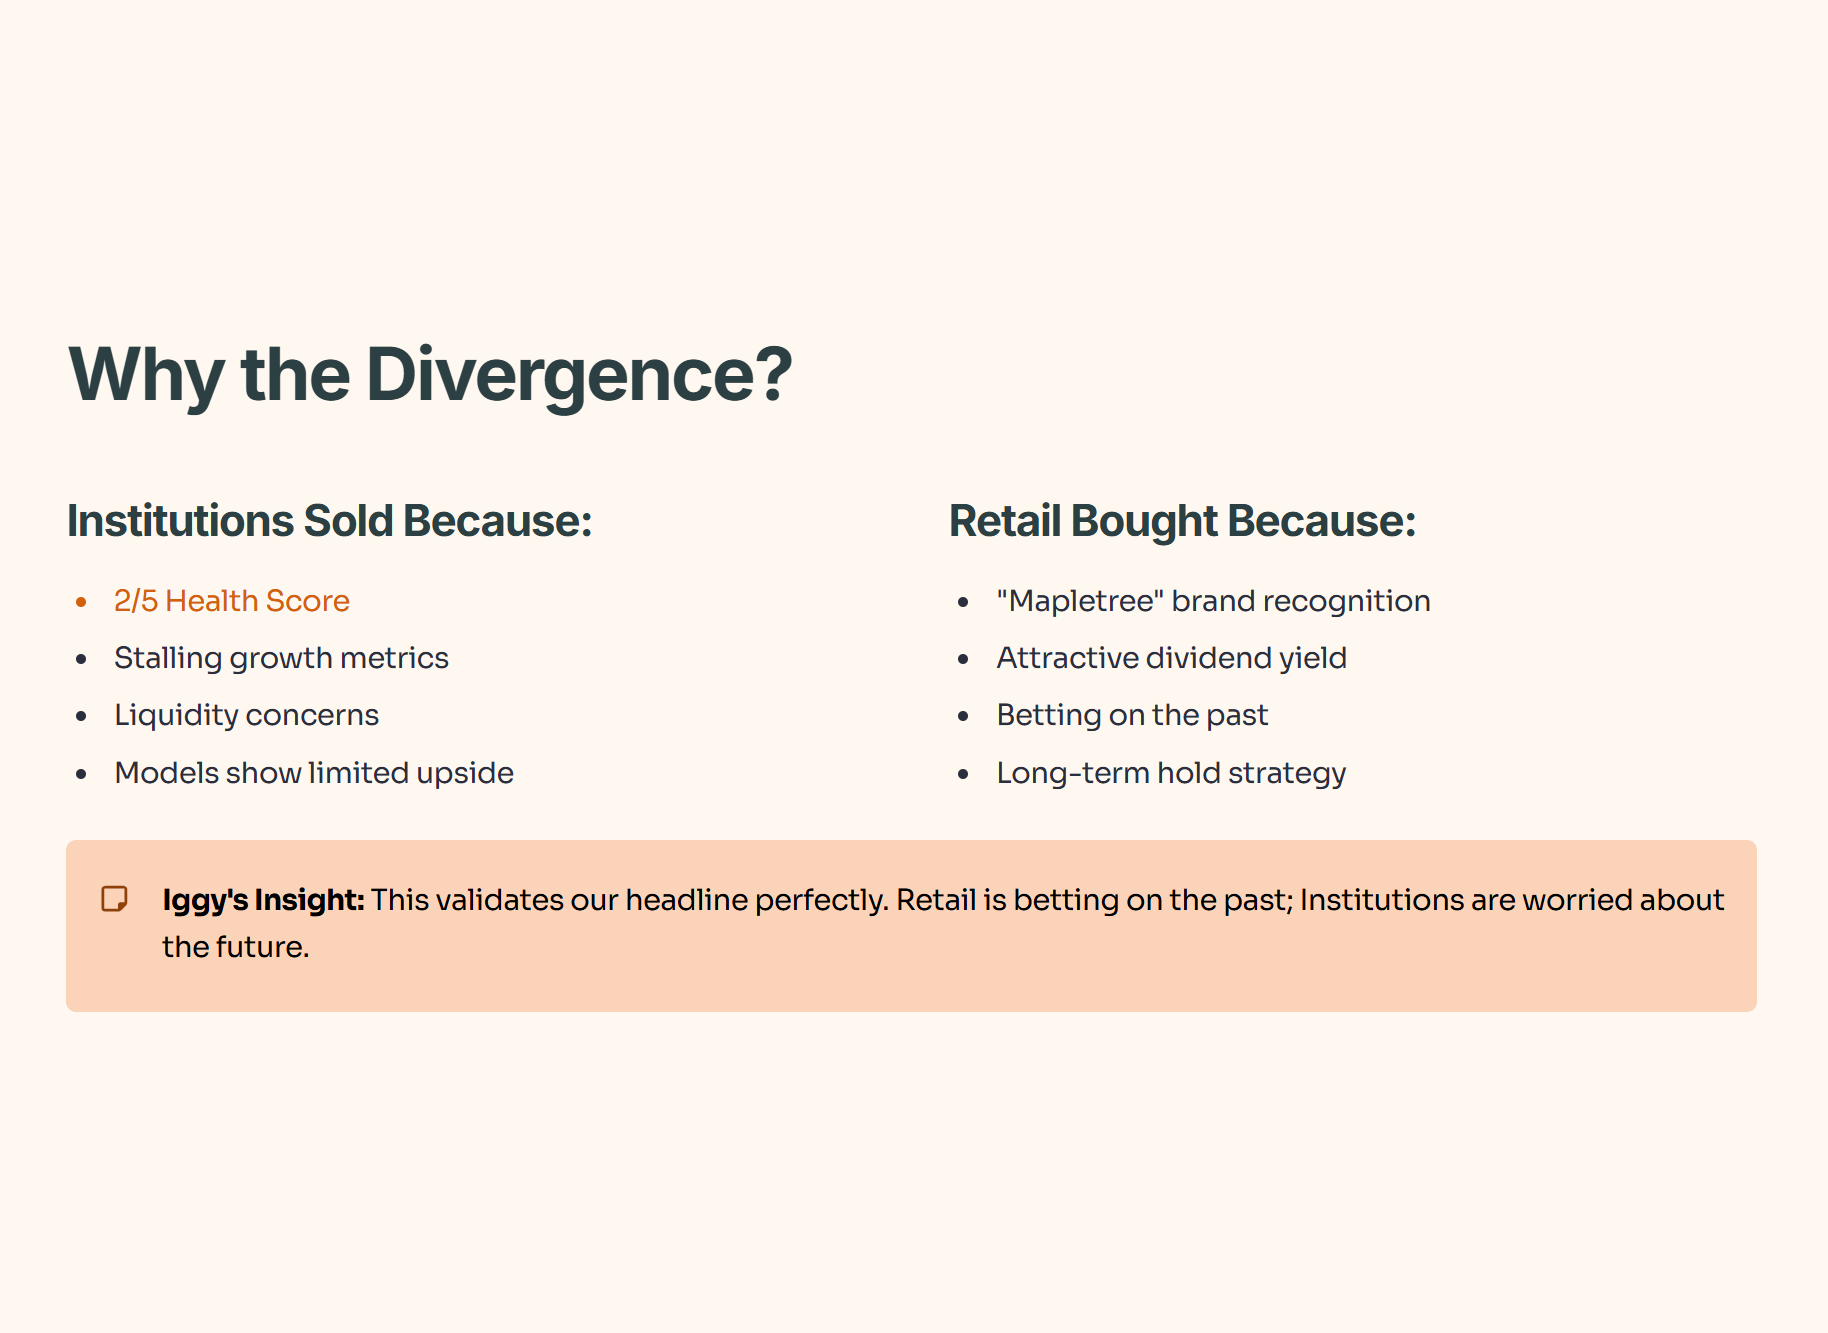
Iggy’s Insight: This validates our headline perfectly. Why did institutions sell MLT? Because their models show a 2/5 Health Score and stalling growth. Why did retail buy? Because they see the “Mapletree” brand and a dividend yield. Retail is betting on the past; Institutions are worried about the future.
The Mapletree Question: Are Dividends Sustainable?
The data check above leads us to the most critical question for your portfolio.
So, the model says Fair Value is S$1.38. That limits your upside. But the real danger isn’t the price—it’s the payout. When I looked at where the dividend money is actually coming from, I found a red flag that every retiree needs to see before they buy more.
In the rest of this analysis, we dive into the Dividend Sustainability Check, the specific ‘Health Score’ warning that scared the institutions, and my 3-step Playbook for 2026.”
