

Can Wealth Fees Save DBS When S$400M Tax Hit Is Permanent | DBS Group Q1 2026 Results | 🦖EP1581
This is not a fortress. It is Watchlist Trigger with payout ratio at 74.6% and 2027 Debt Wall

Earnings Fact Sheet (V2.6) DBS Group Holdings (D05) | Q1 2026 Analysis
Record profits and a quietly shrinking lending engine are not contradictions. At DBS, right now, they are the same sentence.
The Q1 2026 numbers look bulletproof until you read page 15 of the CFO presentation. That is where the Fully Phased-In CET1 ratio tells a different story from the headline figure — and where a S$7.8 billion capital gap becomes visible to anyone willing to look. This audit exists for the investor who looks.

In This Article:
The Market Verdict
Market Response and Price Action
Institutional Flow and Technical Signals
The Slide-by-Slide Audit
Net Interest Margin Forensic Analysis
Iggy's Insight: The CET1 Gap
Common Equity Tier 1 Capital Audit
Global Minimum Tax Impact
Stage 3 Bad Loan Formation
The Reality Check
Analyst Consensus and Valuation
Yield Spread and Forensic Floor
The Scorecard and Yield Spread
Income Sustainability
Debt Health
The Forward Outlook
Scenario Analysis
Peer Comparison
Iggy's Insight: S$50,000 Impact
Forensic Stance and Disclaimer
SECTION 1: THE MARKET VERDICT
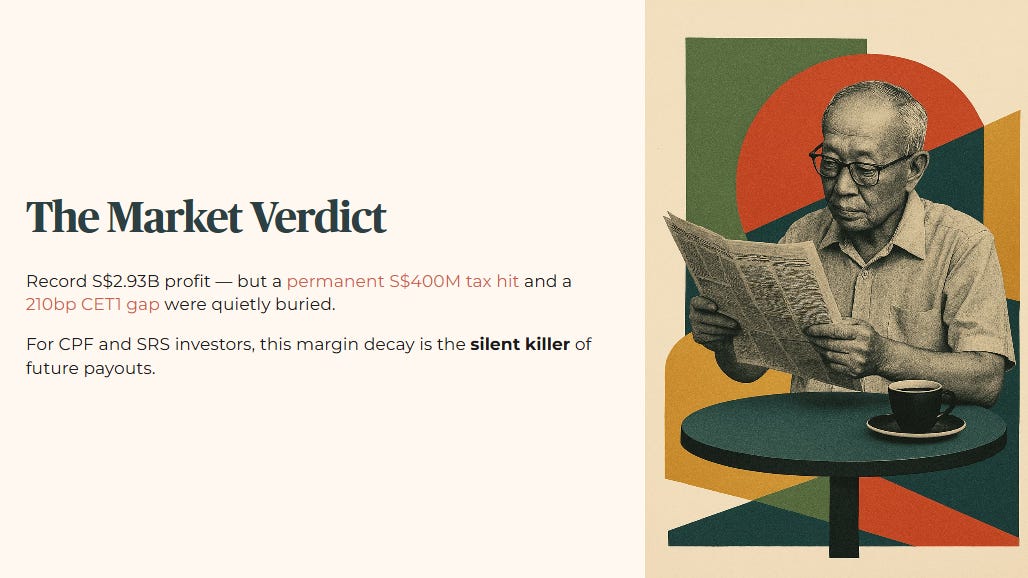
Management reported a record S$2.93 billion in quarterly net profit. But they quietly buried a permanent S$400 million structural tax hit and a 210-basis point gap in their regulatory capital reporting. For anyone relying on these banking dividends to fund retirement from CPF or SRS, this underlying margin decay is the silent killer of future payouts. This forensic audit strips away the headline fluff to reveal exactly why the core lending engine of Singapore’s largest bank is flashing a warning sign.
The immediate market response to the DBS Q1 2026 earnings release on April 30, 2026 showed a clear split. The headline profit figures were a record, but the technical weakness in the margin trajectory was hard to ignore. The headline net profit of S$2.93 billion looked strong. Yet the price action reflected institutional caution about whether the net interest margin can hold in a softening rate environment.
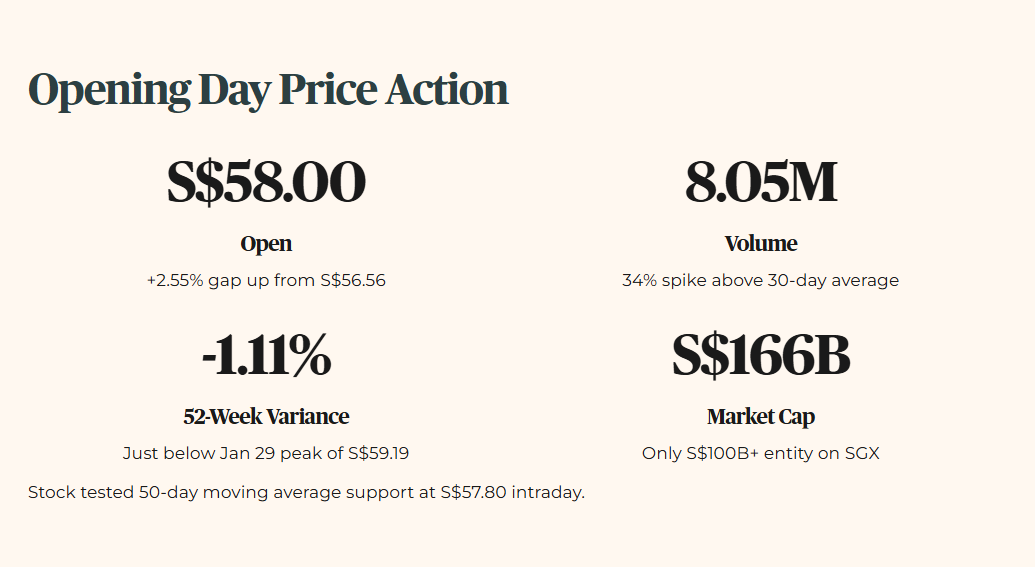
The market opened at S$58.00, slightly above the previous close of S$56.56, a +2.55% gap up. The stock quickly tested significant support levels, hitting an intraday low of S$57.80 at the 50-day moving average. Trading volume exploded to 8.05 million shares — a 34% spike above the 30-day average of 4.74 million. The stock is showing a 52-week high variance of -1.11%, trading just below the January 29, 2026 peak of S$59.19. Despite the volatility, DBS retains its status as the only S$100 billion entity on the SGX, with a current market capitalisation of S$166.28 billion.
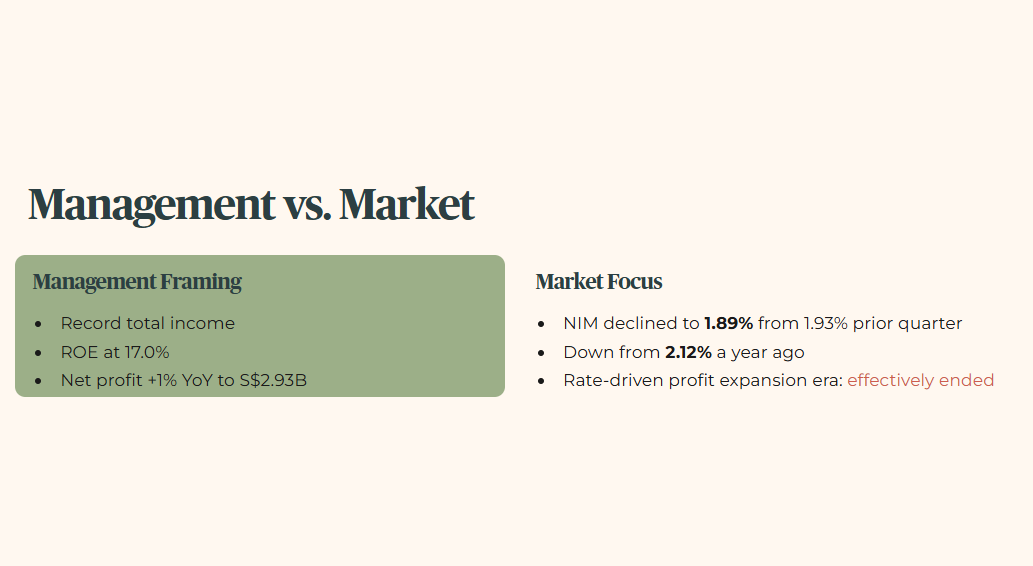
The gap between management’s optimistic framing and the market’s cold interpretation centres entirely on the erosion of the core lending engine’s profitability. Management chose to highlight record total income and a strong return on equity. The market focused on the 4-basis point sequential contraction in net interest margin. Management said Q1 net profit was up 1% year-on-year to S$2.93 billion, with ROE at 17.0%. The market’s attention was fixed on group NIM compression: the decline to 1.89% from 1.93% in the prior quarter, and from 2.12% a year ago, signals that the era of interest rate-driven profit expansion has effectively ended, regardless of any fee income growth.
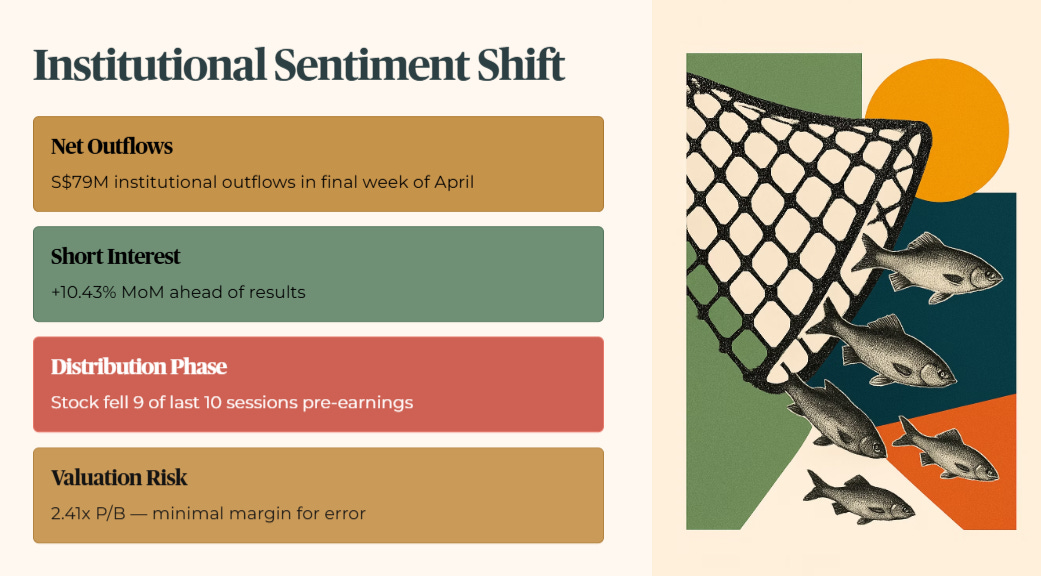
Institutional flow data indicates a significant sentiment shift. Retail participation remained at multi-year highs, but institutional capital showed net outflows of S$79 million in the final week of April before results. Short interest rose 10.43% month-on-month heading into the reporting date, suggesting a tactical build-up of bearish bets against the bank’s premium valuation. Block trade signals confirmed the outflow, with days to cover sitting at 0.3 — meaning the highly liquid market allows rapid exit and entry for short sellers.
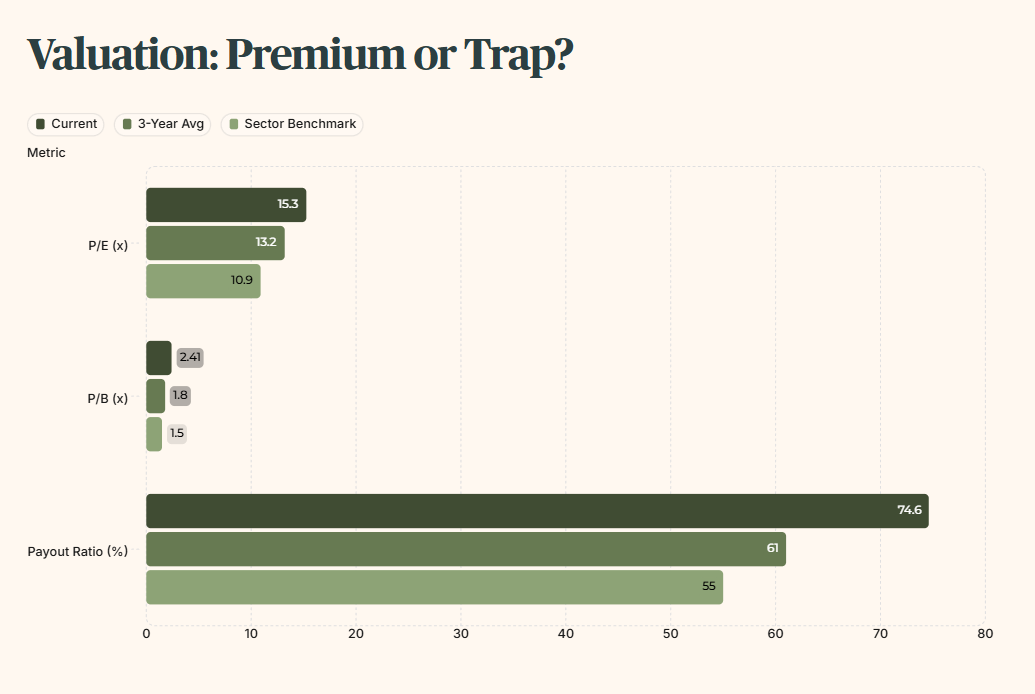
The institutional skepticism is validated by technical signals. The stock fell in nine of the last ten sessions leading into the April 30 open — a distinct distribution phase where large-scale holders appear to be trimming into the record profit news. This behaviour is intensified by the fact that DBS is now trading at a premium valuation of 2.41x Price-to-Book, leaving minimal margin for error if wealth management fails to compensate for the accelerating net interest income decay.
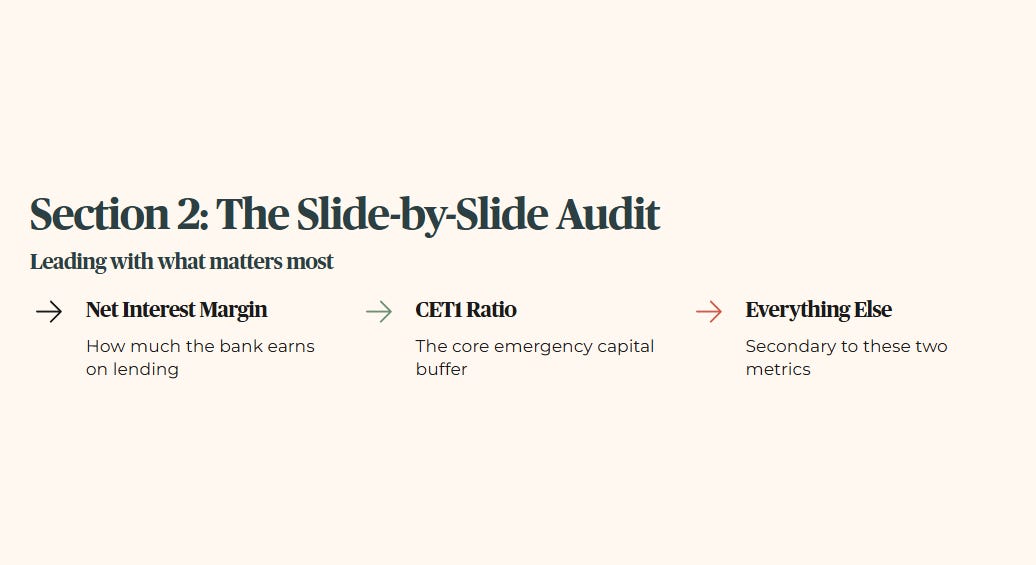
SECTION 2: THE SLIDE-BY-SLIDE AUDIT
We process the earnings report strictly by the numbers. For the banking sector, we lead with the Net Interest Margin and the Common Equity Tier 1 ratio. Every other metric is secondary to how much the bank pays for its capital and how much it charges to lend it out.
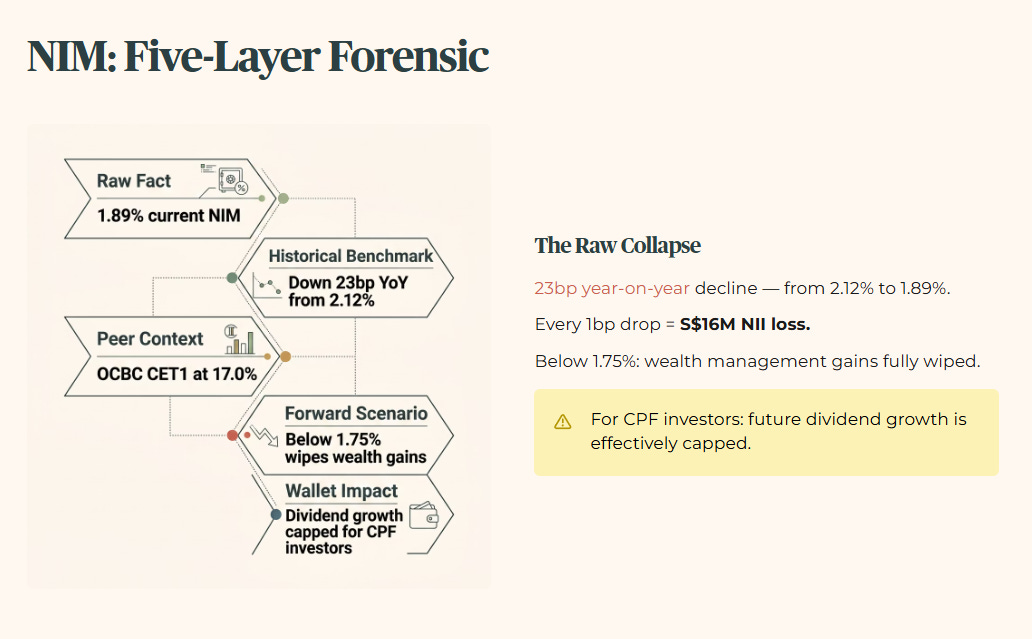
The Net Interest Margin has collapsed. This requires the full five-layer forensic treatment.
The raw fact: group NIM has declined to 1.89%.
The historical benchmark reveals severe deterioration — a 23-basis point collapse year-on-year from the 2.12% recorded in Q1 2025.
The peer context is damning: OCBC maintains a higher CET1 safety buffer at 17.0%. Better capital protection is achievable in this exact same macroeconomic environment.
The forward scenario is grim. If benchmark rates drop another 10%, compressing the margin below 1.75%, the S$16 million net interest income loss per basis point will completely wipe out recent wealth management gains.
The wallet impact is direct. For a 55-year-old holding DBS in a CPF Investment Scheme account, this margin squeeze means future dividend growth is effectively capped. The bank is running on a treadmill just to maintain current payouts.
IGGY’S INSIGHT
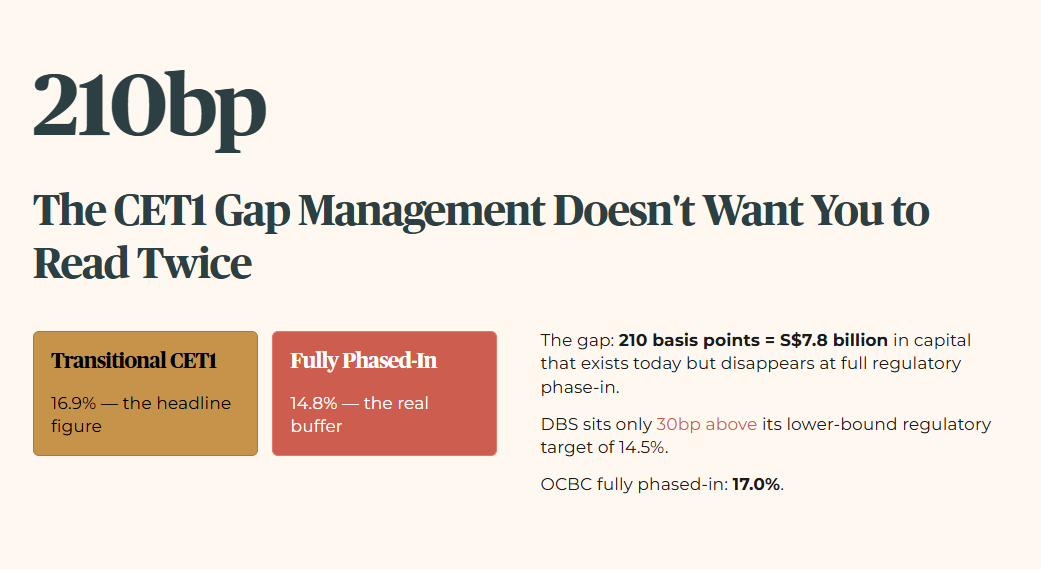
The CET1 gap is the number management does not want you to read twice. The presentation highlights a Transitional CET1 of 16.9%. Turn to page 15 and the Fully Phased-In ratio is 14.8% — a 210-basis point gap representing S$7.8 billion in capital that exists on paper today but disappears when full regulatory phase-in arrives.
That leaves DBS only 30 basis points above its lower-bound regulatory target. OCBC runs at 17.0% fully phased-in. The headline fortress language is accurate for the transitional figure. The permanent buffer is significantly thinner than management’s tone suggests. For a heartland investor counting on dividend continuity, this is the single number worth revisiting every quarter. The margin of safety is tighter than the press release implies.
We also need to examine the Common Equity Tier 1 ratio — the core emergency buffer in the banking biscuit tin. If things go wrong, this is the money that absorbs the shock before dividends get cut. The presentation on page 2 highlights a Transitional CET1 of 16.9%. The footnote on page 15 reveals the Fully Phased-In ratio is actually 14.8% — a gap of 210 basis points, equivalent to S$7.8 billion in capital. Management is using the 16.9% transitional figure to project strength, while the real regulatory buffer sits only 30 basis points above the lower-bound target of 14.5%.
Gearing sits at 5.9%. Retirement capital is not at risk of an immediate liquidity crunch from over-leverage today. The balance sheet is structurally sound on the borrowing front.
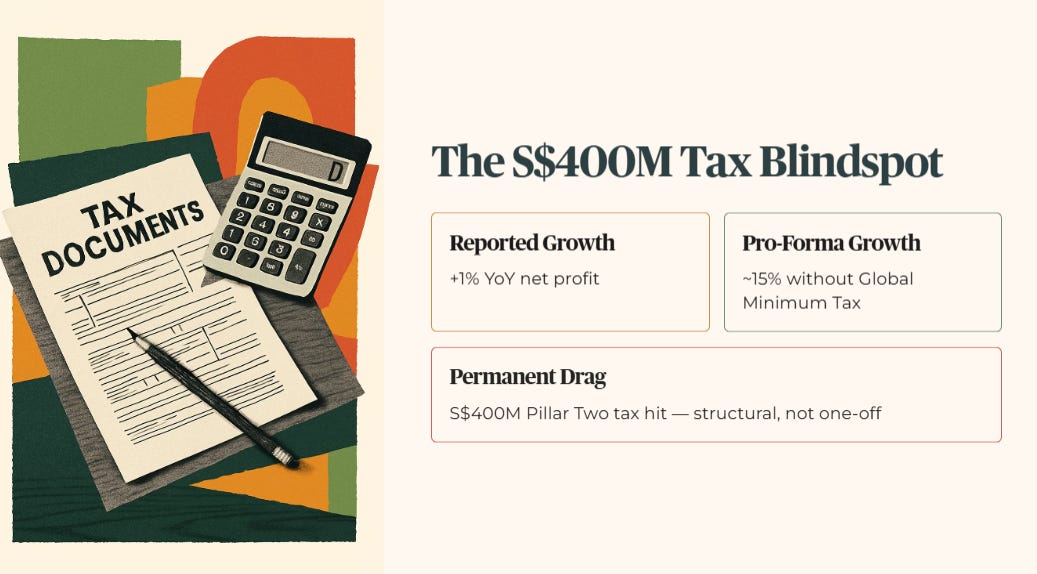
We must audit the Global Minimum Tax impact. Management reported 1% year-on-year net profit growth — completely excluding the S$400 million increase in tax expenses from the 15% Global Minimum Tax under Pillar Two. On a pro-forma basis, if tax rates had remained constant, net profit would have grown by nearly 15%. This S$400 million hit is a permanent structural drag on the bottom line. The bank is generating massive organic growth — including 14% commercial book income growth — just to maintain flat profit after tax.
Every floating rate commercial loan contract in their book resets lower as interest rates fall. The hedging cited by management preserved S$210 billion in fixed-rate assets, but has not been sufficient to stop the sequential bleed.
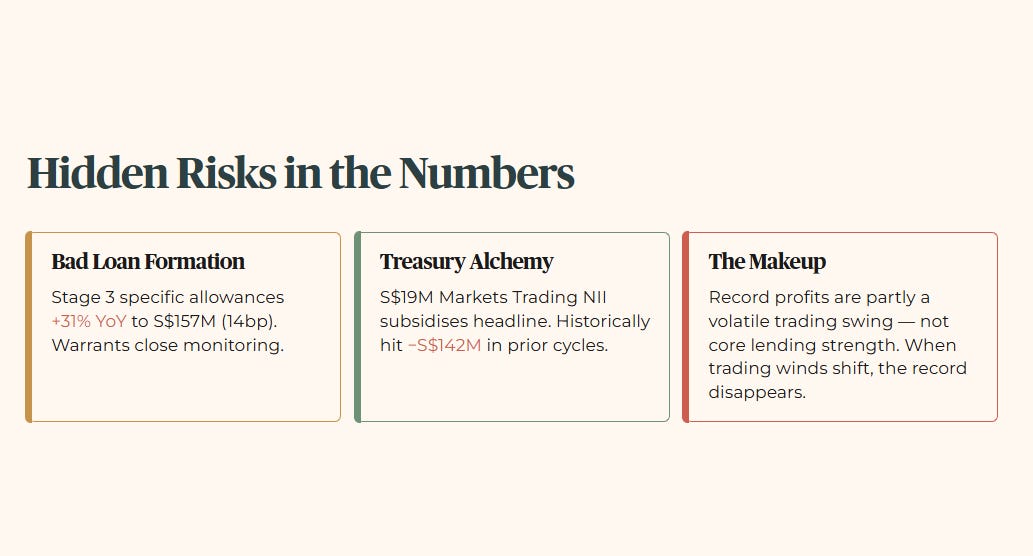
Specific allowances for Stage 3 bad loans rose 31% year-on-year to S$157 million, or 14 basis points. Management claims asset quality is resilient. The dollar value of bad loan formation is visibly increasing in the commercial book. This warrants close monitoring.
The S$19 million Markets Trading Net Interest Income figure on page 5 of the CFO presentation was the single metric management spent the least time discussing. Why the silence? Because historically, this line item has been a massive drag, hitting negative S$142 million in prior cycles. The record total income headline is heavily subsidised by a volatile trading swing, not just core lending strength. Management is masking the structural decay of the commercial book with treasury alchemy. When the trading winds shift, that S$19 million disappears — and the record profits go with it. The headline numbers are wearing makeup, and the rain is coming.
SECTION 3: THE REALITY CHECK
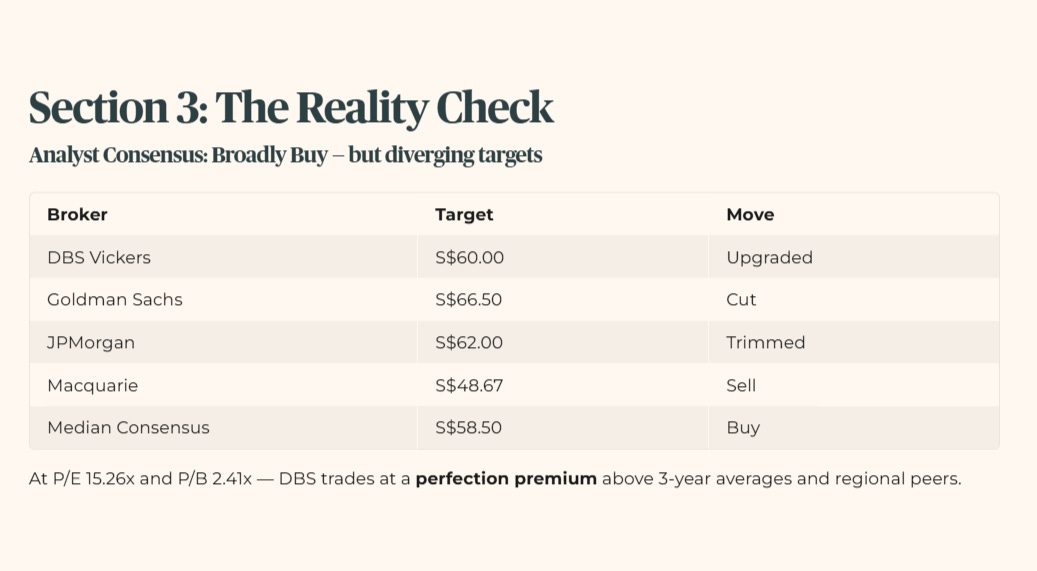
The sell-side analyst community remains broadly supportive with a consensus Buy rating and a median target of S$58.50. DBS Vickers upgraded their target to S$60.00. UOB Kay Hian cut to S$66.75. OCBC Research moved to S$59.43. Maybank increased to S$65.31. CGS International held at S$63.50. Goldman Sachs cut to S$66.50. JPMorgan trimmed to S$62.00. Macquarie maintained a Sell with a target of S$48.67.
The valuation currently reflects a perfection premium. At a P/E of 15.26x and a P/B of 2.41x, DBS is trading significantly above its 3-year historical average and regional peers.
We calculate the yield spread to determine if the risk justifies the entry. The current dividend yield is 6.25%. The latest 6-Month T-Bill rate, per the Iggy Macro Dashboard, is 1.47% (BS26107X, 9 April 2026 — next results pending). The resulting risk premium is 478 basis points.
That clears the 150-basis point hurdle by a wide margin — a pass on spread alone.
But here is where the forensic reading diverges from the headline. The 1.47% T-Bill is not a stress-test floor — it is a historically depressed rate in a rate-cut cycle. I do not lower my standards to match a temporary market dip. The Iggy Forensic Floor remains at 3.2%, which gives a minimum yield hurdle of 4.7%. At 6.25%, DBS clears that hurdle by 155 basis points — a pass, but a narrower one than the raw T-Bill spread implies.
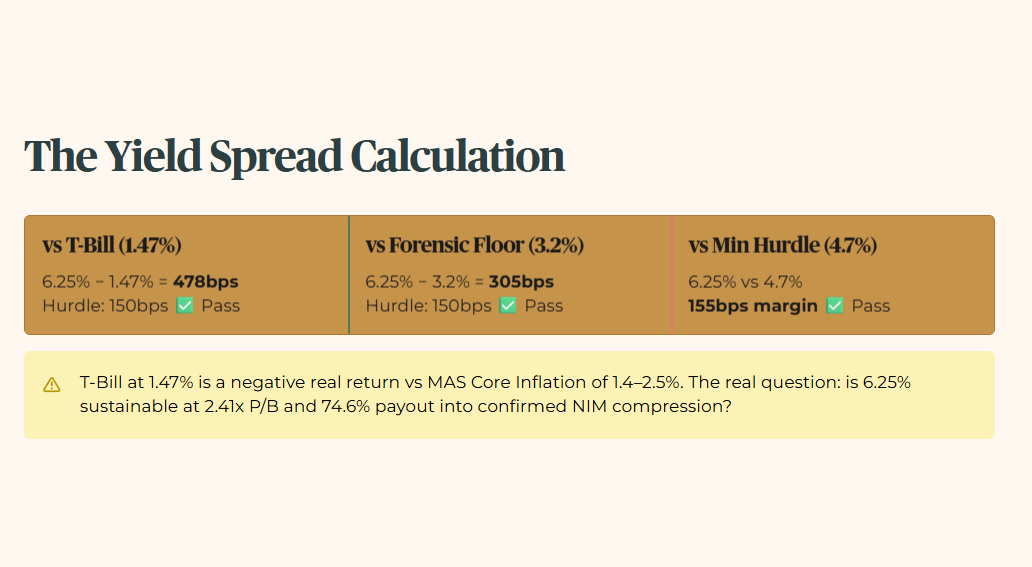
Yield Spread vs T-Bill: 6.25% − 1.47% = 478 bps | Hurdle: 150 bps | Pass Yield vs Forensic Floor: 6.25% − 3.2% = 305 bps | Hurdle: 150 bps | Pass Yield vs Minimum Hurdle: 6.25% vs 4.7% | Pass — 155 bps margin
The practical read for a heartland investor: the T-Bill is paying less than inflation right now. MAS Core Inflation is running at 1.4%, with the forecast band revised up to 1.5%–2.5% for 2026. A 1.47% T-Bill is a negative real return sanctuary. In that context, a 6.25% yield from DBS looks compelling on paper. The forensic question is not whether DBS beats the T-Bill — everything beats the T-Bill right now. The question is whether the 6.25% is structurally sustainable at a 2.41x Price-to-Book entry and a 74.6% payout ratio heading into a confirmed NIM compression cycle. That is where the real risk lives.
We’ve cleared the headline yield spread and stress-test floor — but the moment you stack that 74.6% payout ratio against the Scorecard and 2027 debt wall in the next section, the “safe” 6.25% starts to look very different on a CPF drawdown lens.
