

Is MIT’s 6.33% Yield Hiding a 37.5% Gearing Breach | Mapletree Industrial Trust FY25/26 Results | 🦖EP1580
This is not a hold call. It is Watchlist with zero room for execution errors on US divestments

Mapletree Industrial Trust FY25/26 Results Deep Dive by Iggy
Revenue fell by 5.5 percent and total distributions shrank by 6.1 percent, yet institutional desks barely blinked on earnings day. For a heartland retiree holding Mapletree Industrial Trust in their Supplementary Retirement Scheme, this is a structural reduction in monthly passive income. You cannot ignore it. Today, we strip away the management noise to audit the true organic floor of this data centre giant. We ask if that 6.33 percent yield is a digital sanctuary or a heartland yield trap.


In This Article:
The Slide-by-Slide Audit
🦎 Iggy’s Insight Block 1
The Reality Check
The Scorecard and Yield Spread
The Forward Outlook
🦎 Iggy’s Insight Block 2
Forensic Stance and Disclaimer
Iggy’s Forensic Disclaimer
The Slide-by-Slide Audit
Let us look at the reality of Mapletree Industrial Trust (MIT). We lead with the distribution per unit (DPU) and the balance sheet. That is mandatory for any REIT holding the retirement capital of Singaporeans.
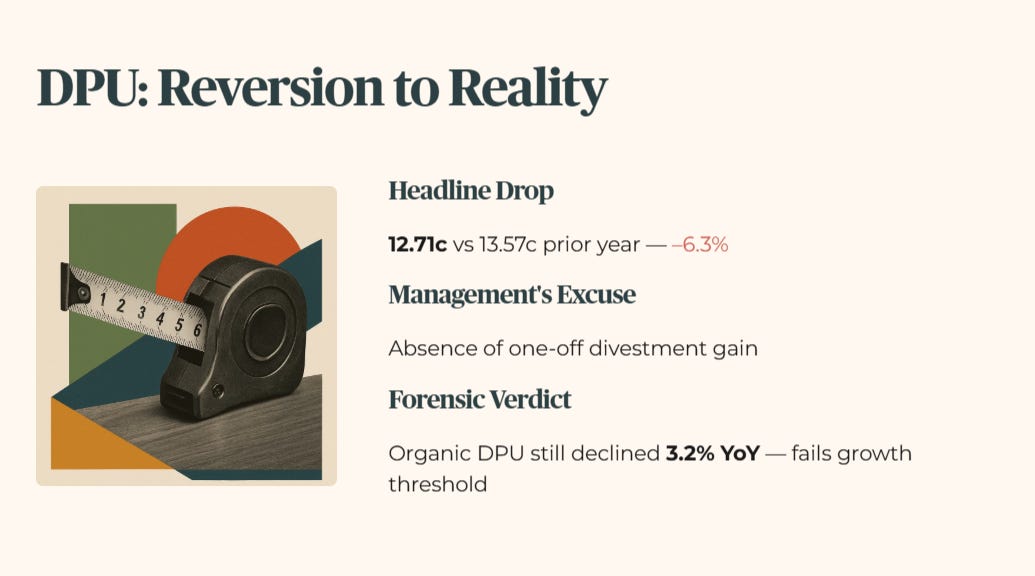
The headline DPU dropped to 12.71 cents from 13.57 cents the year prior. Management called this the absence of a one-off divestment gain. The forensic audit calls it a reversion to reality. Even stripping out the divestment gain, the organic DPU declined by 3.2 percent year-on-year. This 6.3 percent headline drop fails our growth threshold.
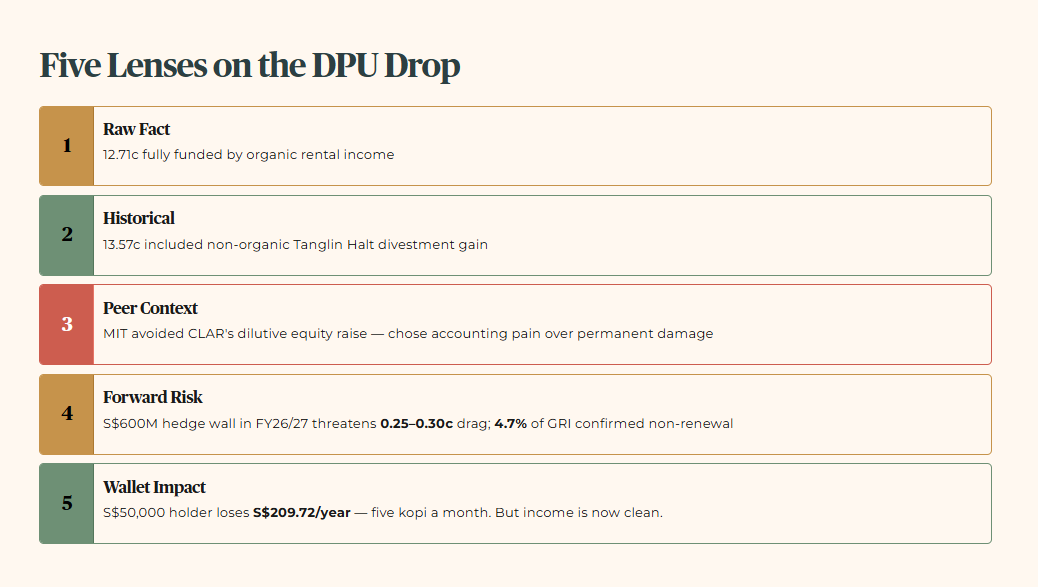
First, the raw fact. The FY25/26 DPU of 12.71 cents was fully funded by organic rental income. Second, the historical benchmark. Last year’s 13.57 cents included a non-organic divestment gain from the Tanglin Halt Cluster distributed across four quarters. Third, the peer context. CapitaLand Ascendas REIT (CLAR) managed a smaller DPU decline, but they diluted unitholders with a massive equity raise to fund acquisitions. MIT chose the pain of an accounting drop over the permanent damage of dilution. Fourth, the forward scenario. The S$600 million interest rate hedge wall in FY26/27 threatens an additional 0.25 cents to 0.30 cents drag on DPU if replaced at higher rates. Critically, confirmed non-renewals in the North American Portfolio already account for approximately 4.7 percent of total portfolio gross rental income expiring in FY26/27. This is not a bear case scenario. It is a locked-in headwind. Fifth, the wallet impact. A 55-year-old holding S$50,000 of MIT sees their annual income drop by S$209.72. That is the equivalent of sacrificing five cups of kopi a month. But the remaining income is finally clean and organic.
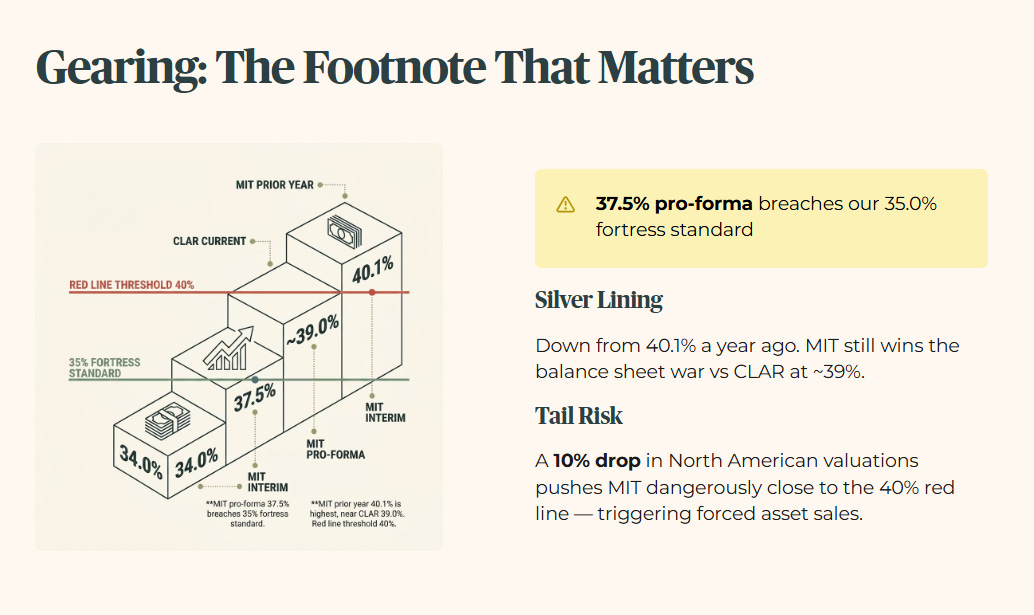
Next, we look at the gearing. Management highlighted an interim aggregate leverage of 34.0 percent. However, footnote surgery reveals that gearing is expected to increase to 37.5 percent following the drawdown of debt to redeem perpetual securities. This 37.5 percent figure breaches our 35.0 percent fortress standard.
First, the raw fact. Pro-forma gearing is climbing to 37.5 percent. Second, the historical benchmark. This is actually an improvement from the 40.1 percent recorded a year ago. Third, the peer context. CLAR is sitting higher at approximately 39.0 percent. MIT still wins the balance sheet war. Fourth, the forward scenario. A 10 percent drop in the North American portfolio valuation would push MIT dangerously close to the 40 percent red line. That triggers forced asset sales. Fifth, the wallet impact. For CPF Ordinary Account investors seeking absolute capital preservation, this elevated gearing increases the risk profile of the trust significantly.
🦎 Iggy’s Insight Block 1
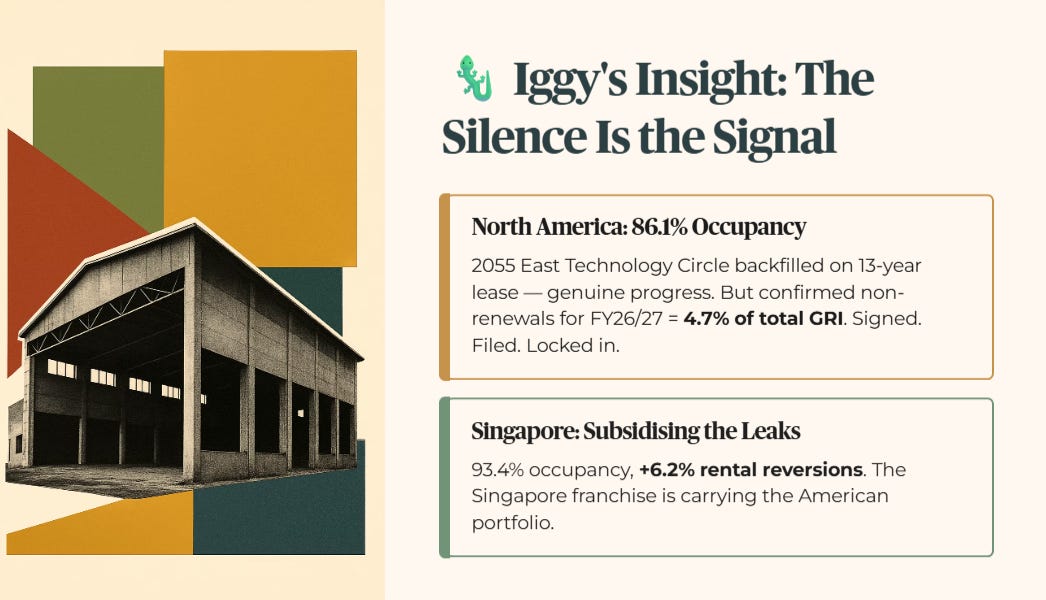
Management spent minimal time discussing the 86.1 percent occupancy rate in their North American data centre portfolio. The backfilling of 2055 East Technology Circle in Tempe with a 13-year lease is genuine operational progress. But the silence on confirmed non-renewals is the louder signal. Of the leases expiring in FY26/27, approximately 4.7 percent of total portfolio gross rental income has already confirmed it will not renew. That is not a theoretical risk in a stress-test table. It is a signed decision sitting in a filing. The Singapore assets are operating at a solid 93.4 percent occupancy and generating 6.2 percent rental reversions. They are subsidising the American leaks. Until management fills those overseas powered shells with hyperscale tenants, the distribution is walking with a limp.
The Reality Check
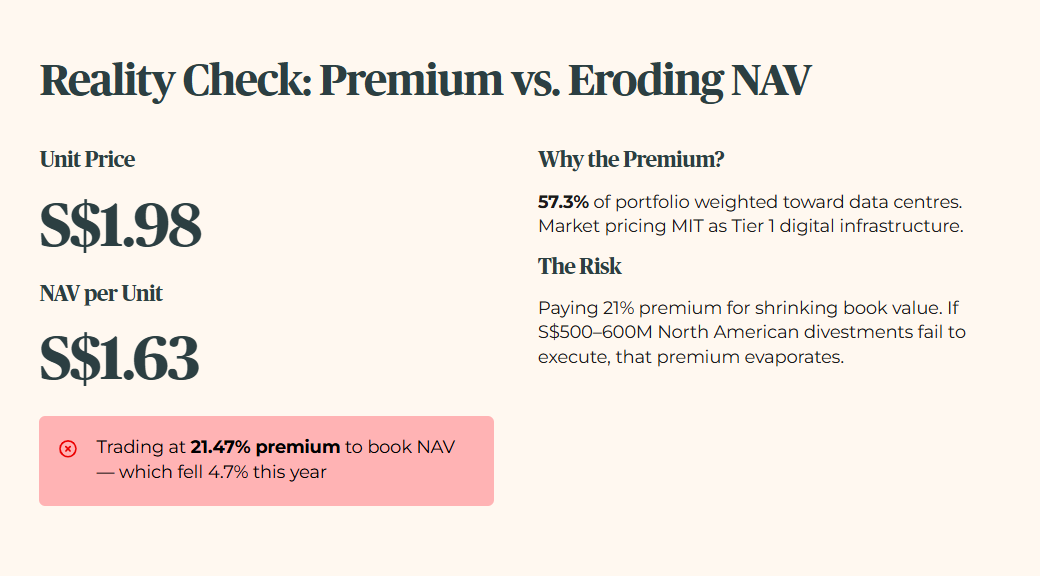
We must contrast management’s optimistic guidance with the cold truth of the balance sheet. The unit price currently sits at S$1.98, reflecting a post-results market reassessment. The Net Asset Value (NAV) per unit is S$1.63. MIT is trading at a 21.47 percent premium to its book NAV.
The market is pricing MIT as a Tier 1 digital infrastructure asset. That is largely because 57.3 percent of its portfolio is now weighted toward data centres. The Singapore portfolio acts as a heavy anchor, delivering 6.2 percent rental reversions. However, the NAV has eroded by 4.7 percent over the past year. You do not buy a yield in isolation. You buy the sustainability of the cash that fuels it. Paying a 21 percent premium for an asset whose book value is shrinking is a calculated risk. Management’s guidance targets selective divestments of S$500 million to S$600 million in North America to rebalance the portfolio toward cloud and hyperscale tenants. If they fail to execute, that premium will evaporate quickly.
The Scorecard and Yield Spread
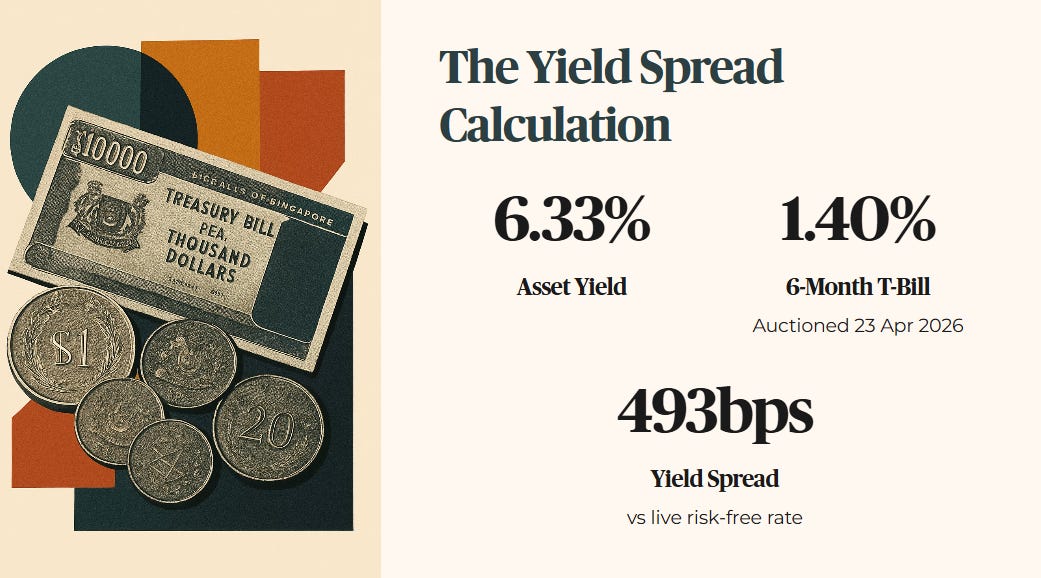
We calculate the true risk premium. The current asset yield is 6.33 percent. The 6-month T-Bill, last auctioned on 23 April 2026, cleared at 1.40 percent per annum. Against the live risk-free rate, MIT’s yield spread is approximately 493 basis points — which sounds generous until you apply the forensic stress test.
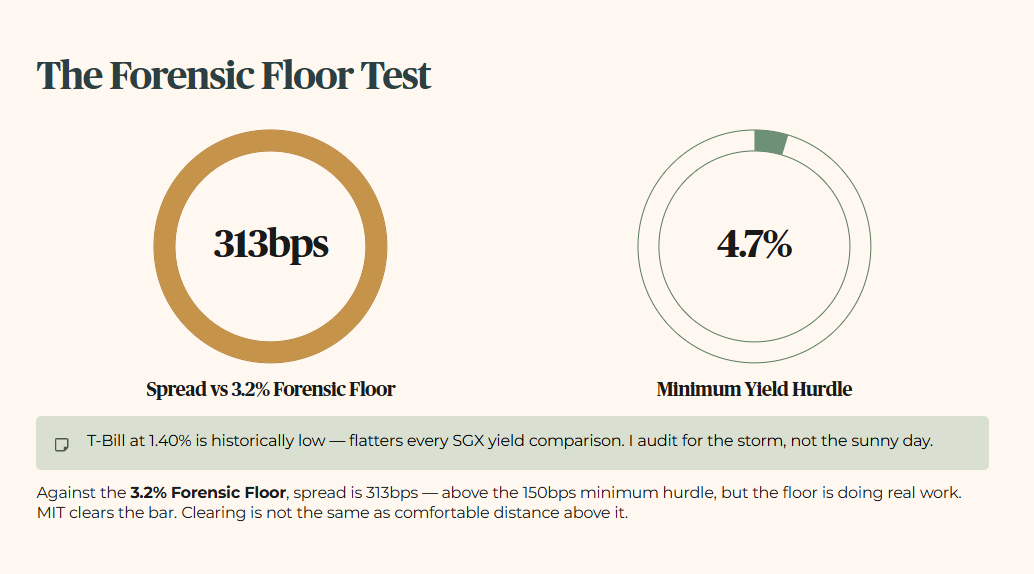
Note on the Stress-Test Buffer: For this audit, I apply a conservative floor of 3.2 percent. We audit for the storm, not just the sunny day. The T-Bill is currently sitting at a historically low 1.40 percent, which flatters every yield comparison on the SGX. I do not lower my standards to match a temporary market dip. Against my 3.2 percent Forensic Floor, MIT’s yield spread is 313 basis points — still above the 150 basis point minimum hurdle, but the floor is doing real work here. The minimum yield hurdle is 4.7 percent. MIT clears it. That is the pass. But clearing the bar is not the same as comfortable distance above it.
Table 1: Income Sustainability
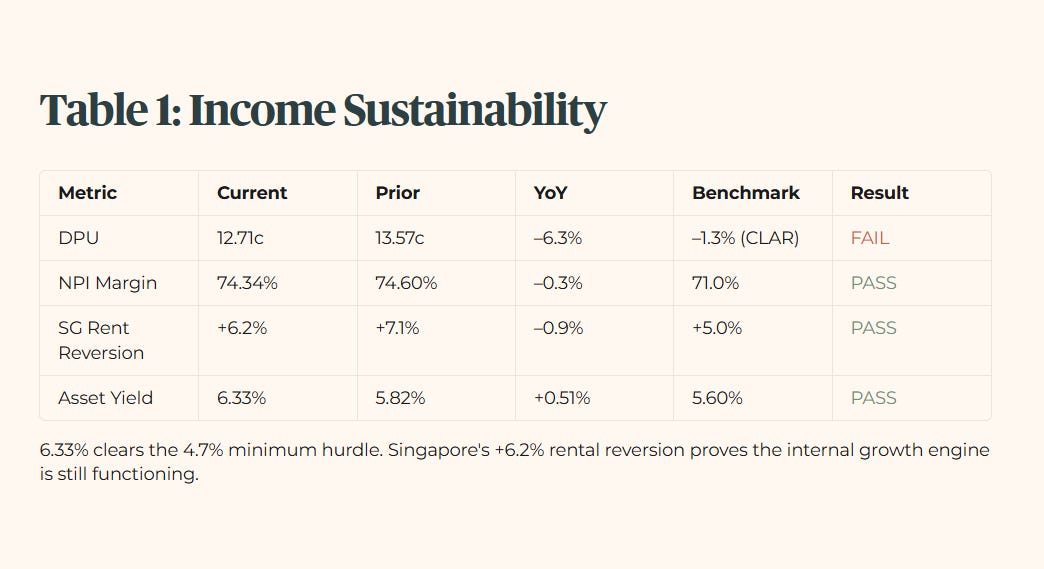
The 6.33 percent yield clears the 4.7 percent minimum hurdle. The 6.2 percent rental reversion in Singapore proves the internal growth engine is still functioning.
Table 2: Debt Health
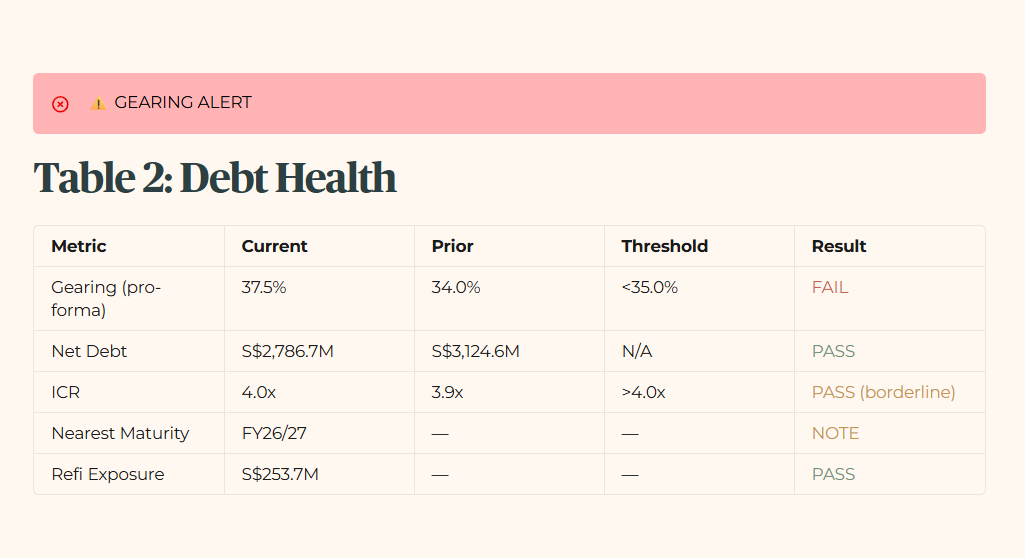
The balance sheet is showing cracks. The pro-forma gearing of 37.5 percent fails the 35.0 percent fortress standard. The Interest Coverage Ratio of 4.0 times sits exactly at the threshold — not a failure, but there is zero margin for error. The S$253.7 million refinancing exposure for FY26/27 is manageable, but the S$600 million interest rate swap wall is a looming structural threat.
The gearing breach clears the first forensic filter — but the scenario analysis in the next section calculates the exact DPU range if management fails to plug the American leaks before the swap wall hits.
