Johor Votes Saturday. Your Portfolio Should Be Watching the Ringgit Instead.
The state election is dominating headlines, but the real portfolio risk is a currency and energy story most coverage is missing.


This Saturday, voters in Johor head to the polls in a state election that the mainstream financial media frames as a critical fork in the road for cross-border investments. If you are holding Malaysia-linked infrastructure counters, regional real estate assets, or retail portfolios exposed to the southern corridor, this vote looks like a major volatility trigger.

But the balance sheets and macro data tell a completely different story. You are about to see exactly why the underlying economic reality of the Johor-Singapore growth pact is largely insulated from the political noise of the ballot box.

The Dual Realities of the Southern Corridor
Johor’s Growth Is Bilateral, Not Electoral
Iggy’s Insight
The Currency Backdrop Investors Should Actually Watch
The New Macro Variable: The Brent Crude Shock
Macro Metrics and Structural Scenarios
Regional Macroeconomic Indicator Matrix
Iggy’s Insight
One Last Thing Before You Go
What This Actually Means at the Wallet Level
The Forensic Bottom Line
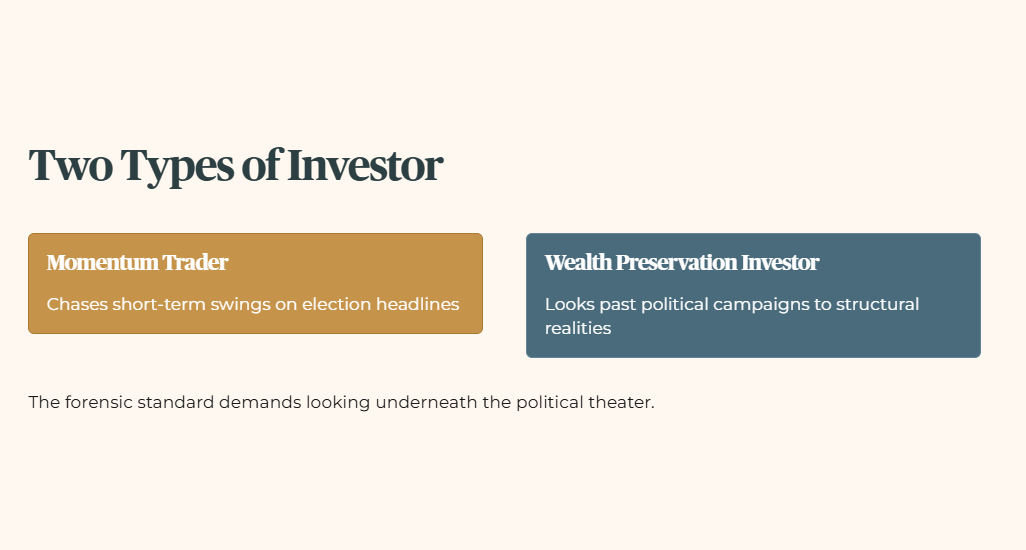
The Dual Realities of the Southern Corridor
If you are a momentum trader chasing short-term swings, an election cycle offers plenty of noise to trade on headlines. But for a wealth preservation investor focused on long-term cash generation and protecting retirement capital, the forensic standard demands looking past political campaigns to the structural realities underneath them.
We need to separate the political theater in Malaysia from the actual capital commitments binding Johor and Singapore together. The mainstream narrative treats this election as a make-or-break moment for the JS-SEZ (Johor-Singapore Special Economic Zone, a designated economic zone targeting cross-border trade, tax incentives, and streamlined movement of goods and labor). The uncomfortable truth is that the capital funding this economic integration has already bypassed the ballot box entirely.
The economic trajectory of Johor is largely decoupled from whoever wins the majority of seats this weekend. The reason is simple: infrastructure pipelines and sovereign frameworks are governed by international treaties and institutional capital expenditure cycles, not local campaign promises. Let us look directly at the economic performance data to understand the structural divergence between Johor as an isolated economic engine and the broader Malaysian macroeconomic environment.
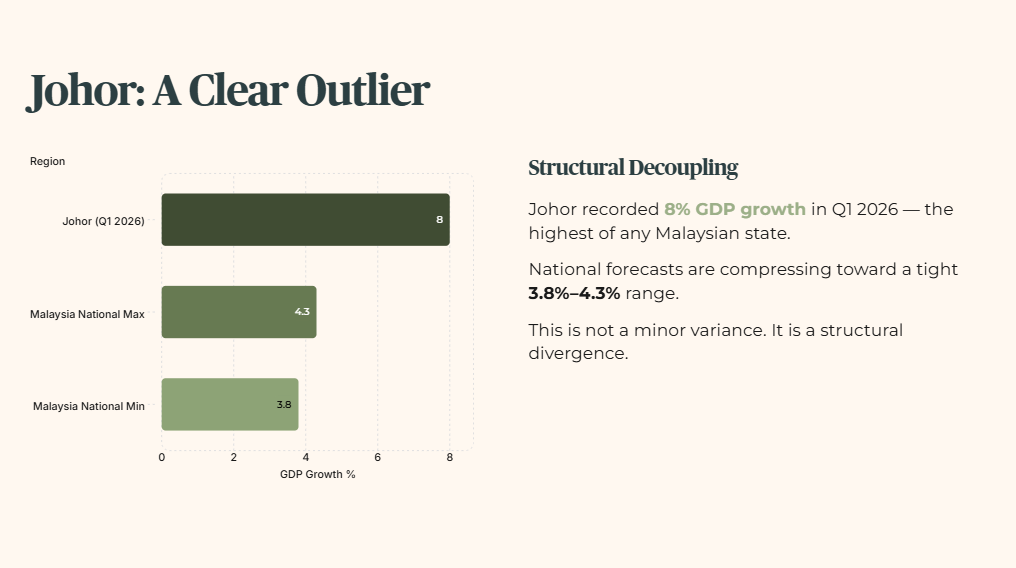
Johor’s Growth Is Bilateral, Not Electoral
The first key pillar of this framework is recognizing that Johor is behaving as an outlier state within a slowing national economy. The state recorded an exceptional 8% economic growth rate in the first quarter of 2026. To put that number in perspective, it is the highest growth rate among all Malaysian states. At the exact same time, Malaysia’s national gross domestic product growth forecasts are facing downgrades from international agencies, compressing toward a tight 3.8% to 4.3% range.
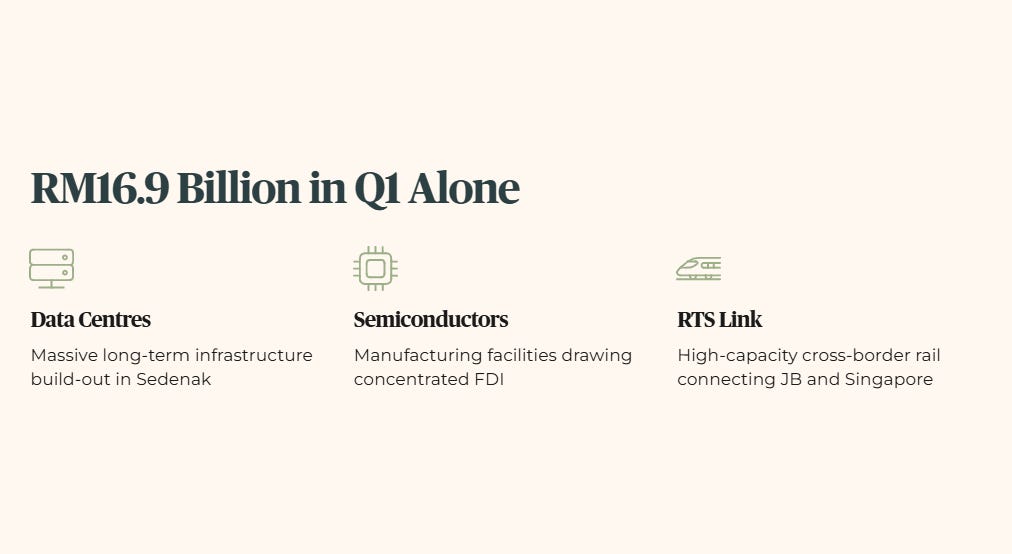
This is not a minor statistical variance. It is a structural decoupling. Johor is drawing immense foreign direct investment, clocking RM16.9 billion in the first quarter of 2026 alone. The capital entering the state is heavily concentrated in massive, long-term infrastructure assets: data centers, semiconductor manufacturing facilities, and the RTS Link (Rapid Transit System Link, a high-capacity cross-border rail line designed to connect Johor Bahru and Singapore).
These investments are not contingent on state-level political announcements. A data center operator dedicating hundreds of millions of dollars to build out infrastructure in Sedenak does not halt construction because a local constituency changes its representative. The framework agreements governing the special economic zone are signed between sovereign federal governments. The state administration’s role is narrowed down to local execution, land approvals, and utility coordination.
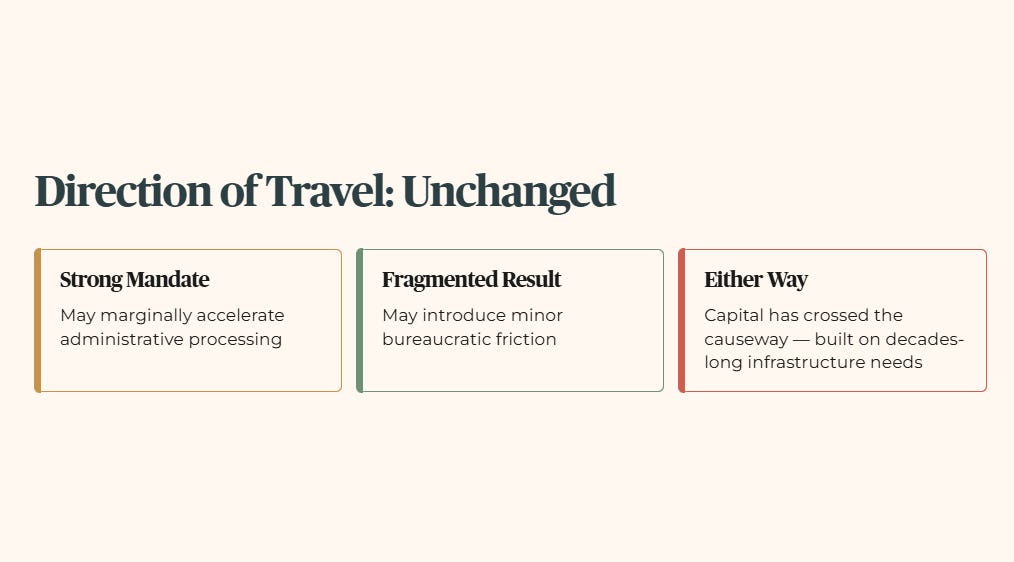
Therefore, a strong mandate for the incumbent coalition may marginally accelerate administrative processing times, while a more fragmented result might introduce minor bureaucratic friction. But the direction of travel remains largely unaltered. The capital has already crossed the causeway, and it is built on long-term infrastructure needs that stretch over decades, far beyond the horizon of any political term.
🦎 Iggy’s Insight
The financial press loves to tie economic fortunes to election nights because it creates immediate clicks. But institutional capital does not build data centers or lay cross-border rail lines based on campaign speeches. The RM16.9 billion of foreign direct investment that poured into Johor in the first quarter of 2026 represents hard capital committed to sovereign agreements that outlast any local ballot. Look at the binding treaties, not the polling stations. The southern economic corridor is already a structural reality, not a political promise.
The Currency Backdrop Investors Should Actually Watch
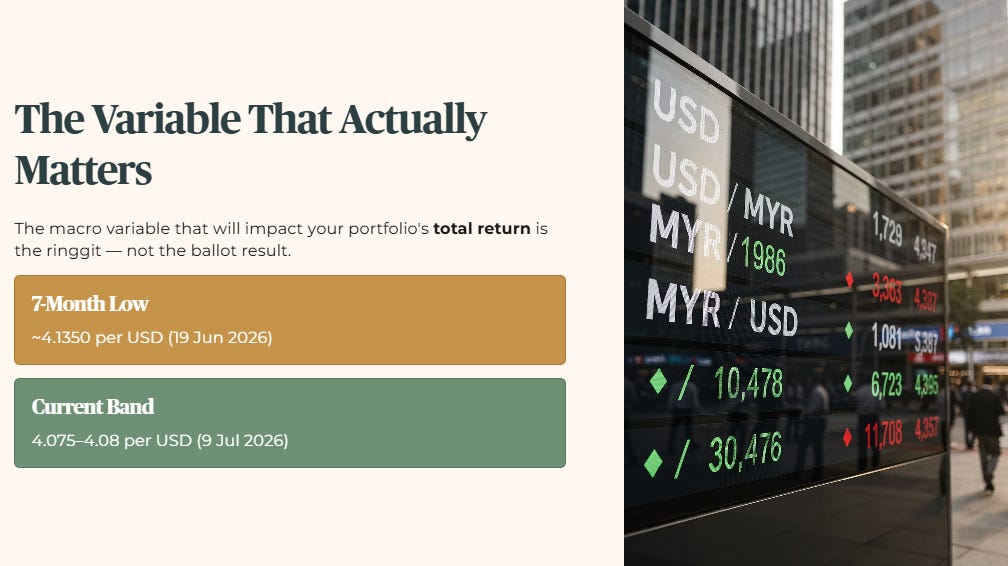
While the headlines remain focused on political speeches, the macro variable that will actually impact your portfolio’s total return is the behavior of the Malaysian ringgit against the United States dollar and the Singapore dollar. Here, we must look at the data with precision.
The ringgit hit a significant seven-month low around June 19, 2026, trading at approximately 4.1350 against the United States dollar. Since that low, we have observed a modest consolidation, with the currency trading in a tight band of 4.075 to 4.08 per United States dollar as of July 9, 2026. The mainstream view is that currency weakness reflects domestic political uncertainty surrounding the upcoming state polls. The forensic read on the data suggests otherwise.
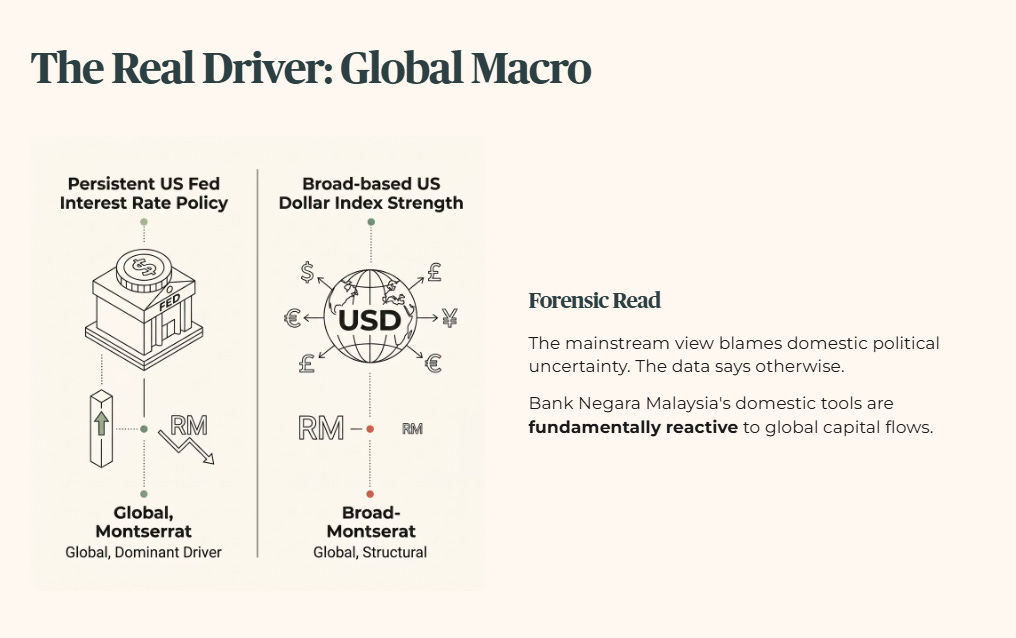
The primary driver of the ringgit’s recent weakness is not domestic politics, but global macro mechanics, specifically persistent Federal Reserve interest rate policy and broad-based strength in the United States dollar index. Bank Negara Malaysia has publicly pledged stronger measures to manage foreign exchange inflows, but its domestic tools are fundamentally reactive to global capital flows.
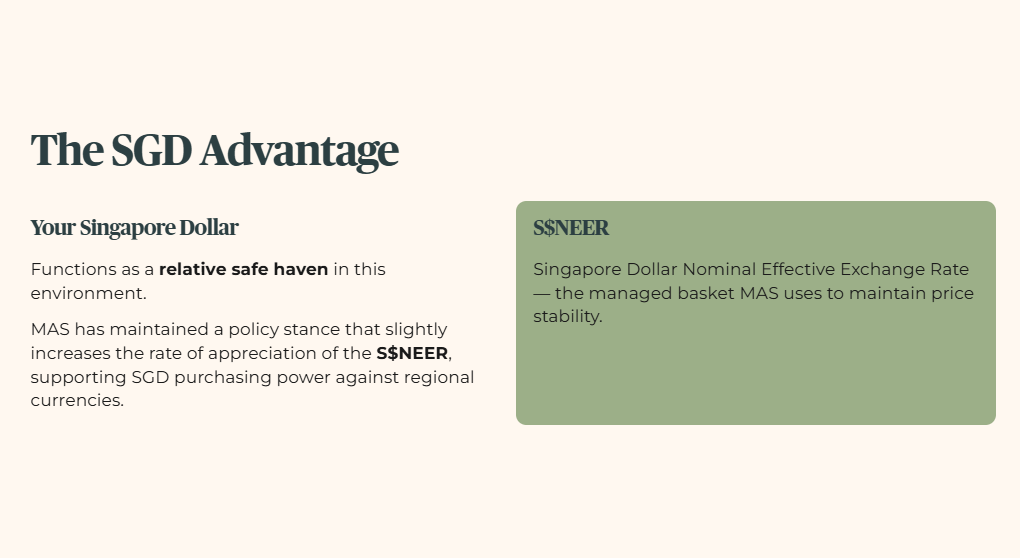
For a Singaporean retail investor holding assets across the causeway, this currency dynamic creates a real valuation gap. Your Singapore dollar functions as a relative safe haven in this environment. The MAS (Monetary Authority of Singapore) has maintained a policy stance that slightly increases the rate of appreciation of the S$NEER (Singapore Dollar Nominal Effective Exchange Rate, the managed exchange rate basket Singapore uses to maintain price stability), which naturally supports the purchasing power of the Singapore dollar against regional currencies.
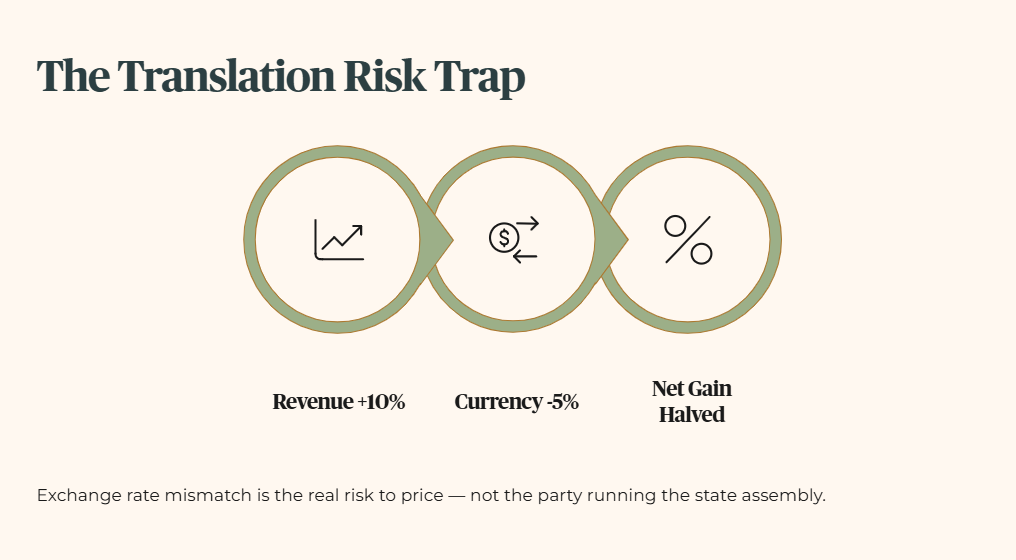
When you purchase regional real estate or invest in companies with heavy ringgit-denominated revenue streams, you are exposed to structural translation risk. If a company grows its regional revenue by 10% in local currency terms, but the underlying currency depreciates by 5% against the Singapore dollar, roughly half of that fundamental growth is wiped out before it hits your Central Provident Fund or Supplementary Retirement Scheme account. This exchange rate mismatch is the real risk factor to price, not the political party running the state assembly.
The New Macro Variable: The Brent Crude Shock
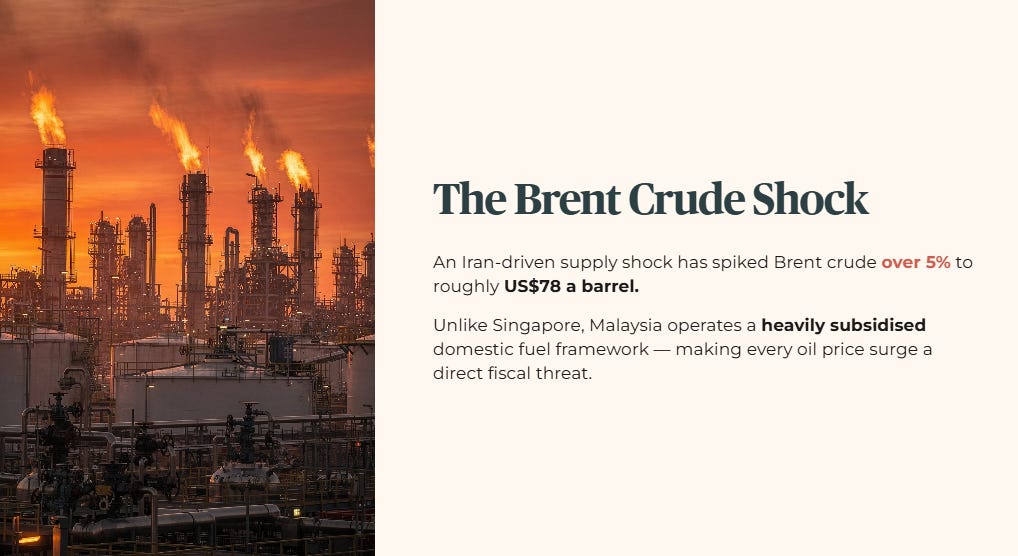
The most significant and immediate risk to regional cost structures has nothing to do with Johor’s voting patterns. It comes from global energy markets. Brent crude, the international benchmark for oil prices, has experienced an Iran-driven supply shock, spiking over 5% to trade at roughly US$78 a barrel.
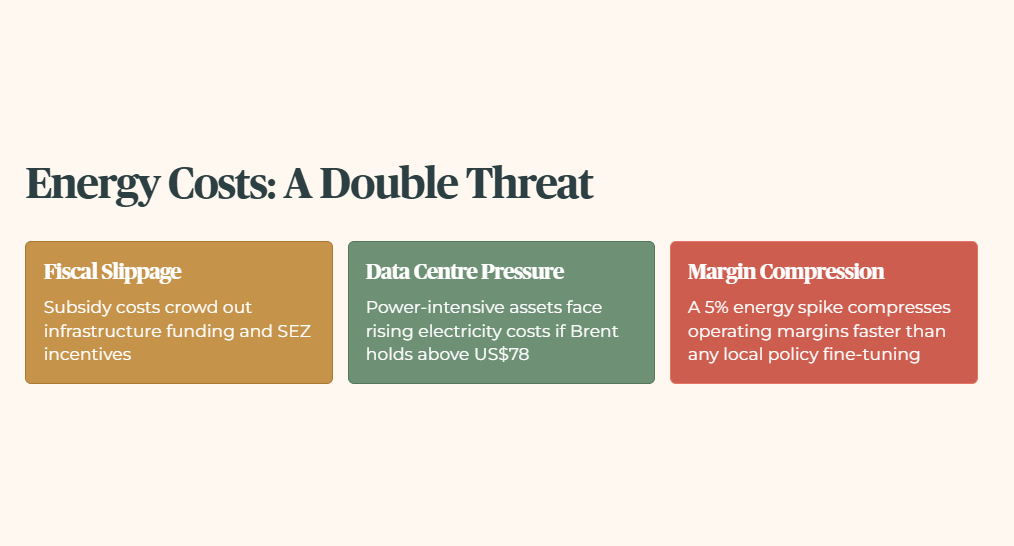
This sudden energy price escalation introduces immediate fiscal slippage risk for Malaysia. Unlike Singapore, which passes market energy prices through to consumers via regular utility tariff adjustments, Malaysia operates a heavily subsidized domestic fuel framework. When global oil prices surge, the cost of maintaining these domestic subsidies rises sharply.
This creates a direct threat to Malaysia’s national fiscal consolidation targets. Every ringgit spent covering fuel subsidies is a ringgit taken away from infrastructure funding or economic incentives for the special economic zone. Higher energy costs also create immediate regional cost pressures. While Johor boasts an impressive 8% growth rate, its expanding data center industry is incredibly power-intensive, requiring vast amounts of electricity to run servers and cooling systems around the clock.
If global energy prices remain elevated above US$78 a barrel, the structural cost of electricity in the region will likely rise. Singaporean investors holding positions in regional logistics hubs, manufacturing firms, or utility-dependent counters should factor this in. A sudden 5% spike in input energy costs compresses operating margins far faster than any local policy fine-tuning by a newly elected state administration.
Macro Metrics and Structural Scenarios
To help you visualize how these competing forces interact, here are the core macroeconomic indicators shaping the regional investment environment right now.
Regional Macroeconomic Indicator Matrix
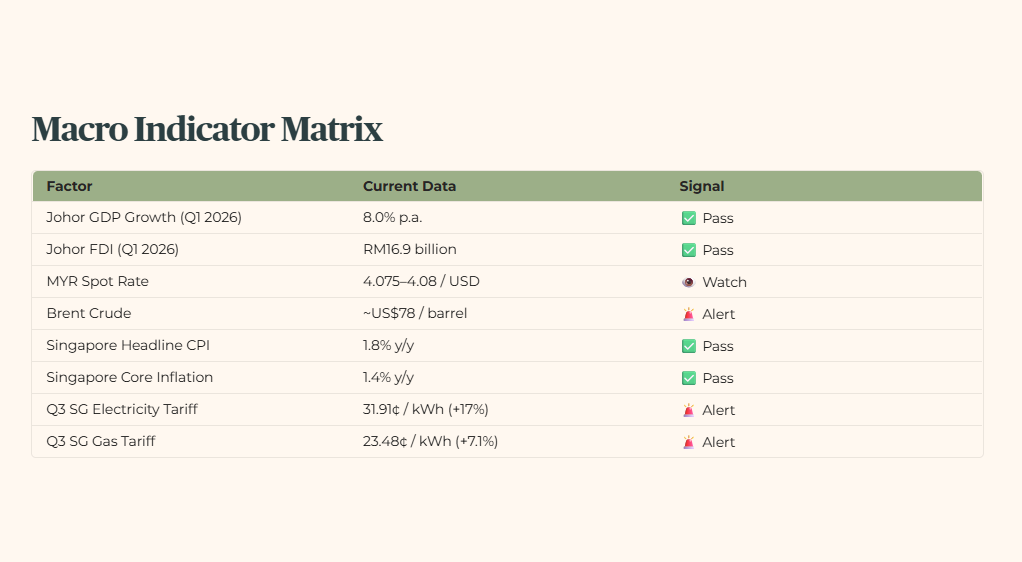
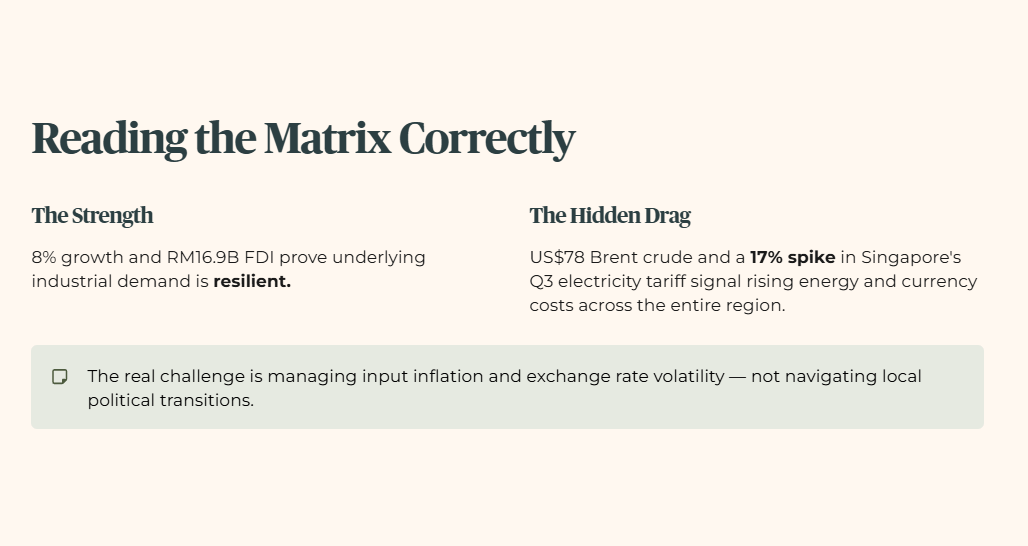
As the matrix demonstrates, you cannot analyze Johor through a purely local lens. The exceptionally strong 8% growth rate and RM16.9 billion in foreign direct investment prove the underlying industrial demand is resilient. However, the simultaneous pressure from US$78 Brent crude and the 17% spike in Singapore’s own Q3 electricity tariffs points to a broader reality: energy costs and currency translation effects are rising across the entire region. The real challenge for investments in the southern corridor is managing input inflation and exchange rate volatility, not navigating local political transitions.
🦎 Iggy’s Insight
Look closely at the divergence between the domestic growth metrics and the external cost inputs in the macro matrix. Johor is firing on all cylinders with 8% growth, but it is doing so while heading straight into a global energy spike and a strong US dollar regime. For a retirement income portfolio, the lesson is clear: do not read regional infrastructure growth as automatically translating into regional investment returns. Currency and energy costs sit between the headline and your actual return, and neither shows up in the press release.
One Last Thing Before You Go
A Quick Note Before the Verdict. You aren’t here for the kopi tips or the hype. You’re here because you want the forensic truth before you commit a single dollar of your capital. That tells me something about the kind of investor you are.

But here’s the uncomfortable truth about how independent publishing works. The algorithm doesn’t know you read every word. It doesn’t know you checked the gearing ratio twice. It only sees one signal — whether you’ve hit that subscribe button. Every forensic investor who reads without subscribing is invisible to the machine.
If this analysis has ever helped you identify a risk or calculate a margin of safety — subscribe for free now and share this with one person who needs to hear it. Not for me. To tell the algorithm that data-driven SGX analysis deserves a seat at the table alongside the noise.

What This Actually Means at the Wallet Level
Strip away the headline growth story, and two mechanical drags remain that quietly affect any regional asset’s real return: currency translation and energy cost pass-through.
Consider a Singaporean investor in Ang Mo Kio evaluating a Malaysia-exposed logistics or regional property asset, one marketed heavily on the strength of Johor’s growth story. The advertised return often looks attractive precisely because it’s benchmarked against the SEZ narrative rather than against what actually lands in the investor’s account after two things the glossy materials rarely mention.
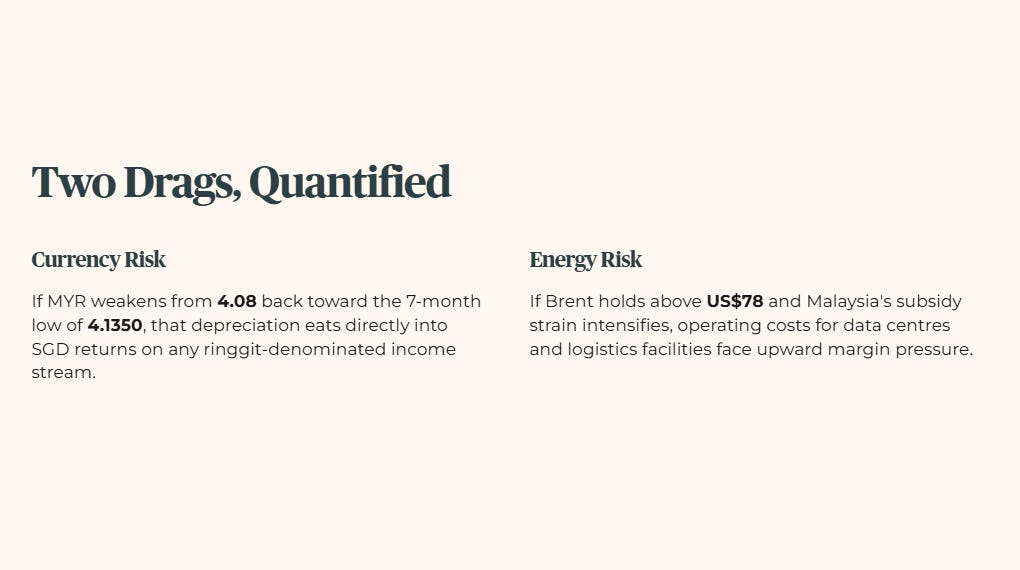
First, currency. If the ringgit weakens further, from the current 4.08 level back toward the seven-month low of 4.1350, that depreciation eats directly into Singapore-dollar returns on any ringgit-denominated income stream, regardless of how well the underlying business performs.
Second, energy. If Brent holds above US$78 and Malaysia’s fuel subsidy strain intensifies, regional operating costs, particularly for power-intensive assets like data centers and logistics facilities, face upward pressure that compresses the margin between gross revenue and net distributable income.
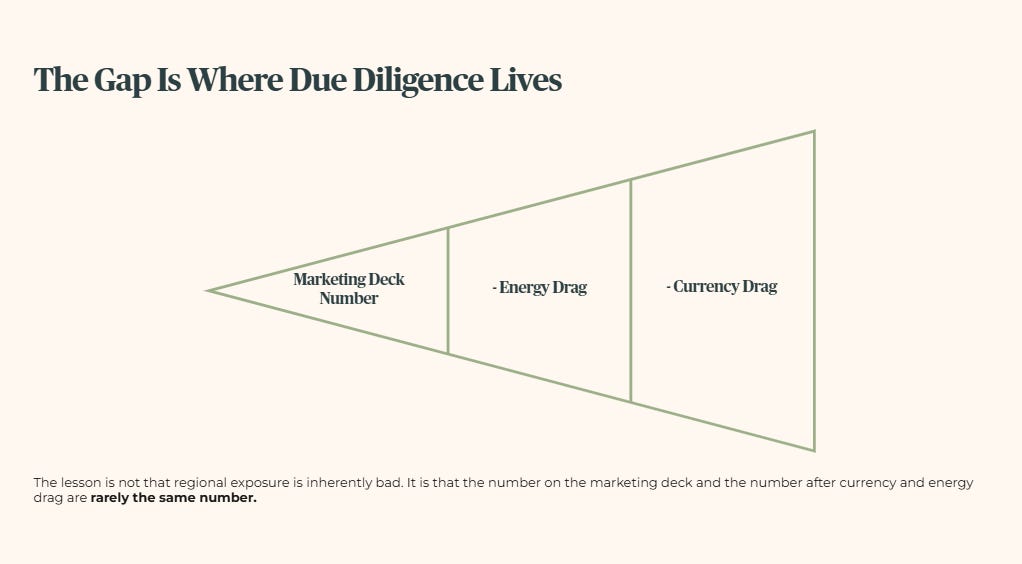
Neither of these shows up in an infrastructure headline. Both show up in the cash that actually reaches your account. The lesson isn’t that regional exposure is inherently bad, it’s that the number on the marketing deck and the number after currency and energy drag are rarely the same number, and the gap between them is exactly where forensic scrutiny earns its keep.
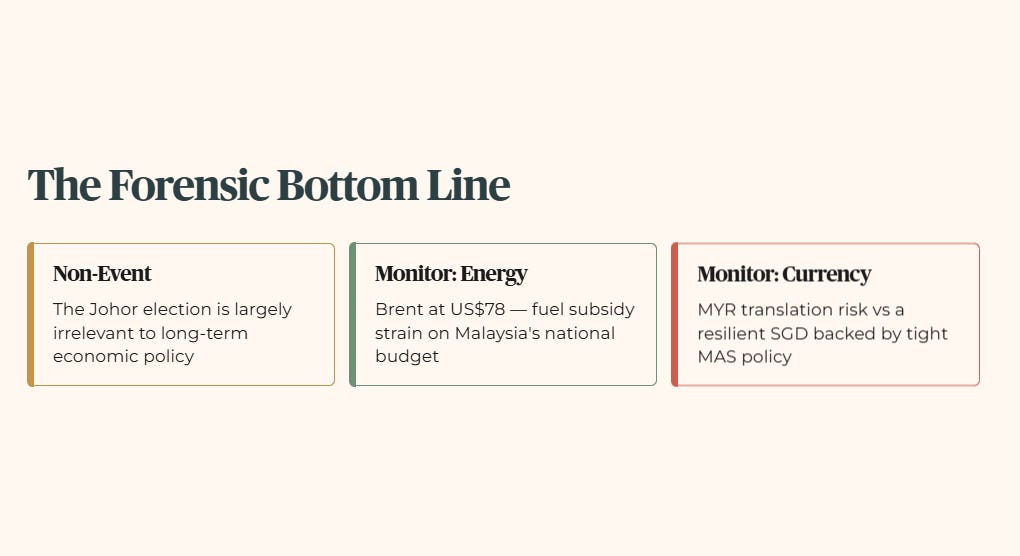
The Forensic Bottom Line
The upcoming Johor election is largely a non-event for long-term economic policy, but it is also a distraction from the risks that actually matter for regional exposure. The sovereign framework binding the Johor-Singapore Special Economic Zone and major infrastructure projects like the RTS Link is locked in by institutional capital and bilateral treaties. Execution will continue regardless of the political math on Saturday night.
The risks worth actively monitoring are the Brent crude energy shock holding at US$78 a barrel, the structural friction of fuel subsidies on Malaysia’s national budget, and the translation risk of the ringgit against a relatively resilient Singapore dollar backed by a tight MAS monetary policy stance.

For a Singaporean investor considering regional exposure through the Johor growth story, the practical takeaway is straightforward: treat headline growth and FDI numbers as evidence of genuine economic momentum, not as a substitute for pricing in currency and energy cost risk separately. The gap between infrastructure headlines and the fiscal and currency reality funding them is where the real due diligence work happens.
In a market operating at all-time highs, where the Straits Times Index consolidates above the 5,000 level, cross-border execution risk deserves the same scrutiny you’d apply to any other layer of your portfolio. Protect your core retirement capital, price the currency and energy variables honestly, and leave the political headline chasing to the momentum speculators.
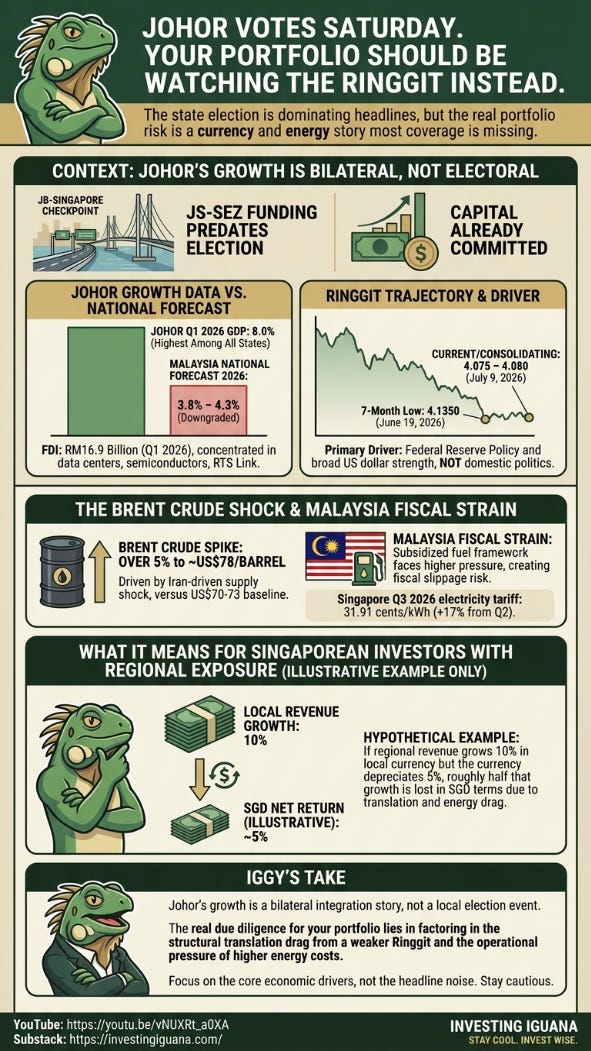
YOUR FORENSIC VERDICT, ONE PAGE.
The full audit is above. This is the Iggy Forensic Audit distilled to one A4 page — every number that matters, every flag that triggered, one clear verdict. Save it, print it, pull it out when this stock crosses your radar again, or when you need to refer to these data points for your retirement planning.

Iggy’s Forensic Disclaimer
This content is produced for educational and informational purposes only. I am not a financial advisor — I am a retail investor who applies forensic analysis to my own portfolio and shares that process publicly. Nothing here constitutes a recommendation to buy, sell, or hold any security, and no specific target prices or personalised financial advice are offered. Stocks assessed under Iggy’s Forensic Yield Standard are benchmarked against a 4.7% minimum yield hurdle; stocks flagged as Growth Watch fall below this threshold but demonstrate clean balance sheet metrics and an identifiable growth catalyst — these carry a materially different risk profile and are not suitable as yield replacements for income-dependent investors. All data is sourced from public filings and verified sources; where data is unverified it is explicitly flagged. All investments carry risk, including the potential loss of principal, and past performance is not indicative of future results. If you are making investment decisions involving CPF, SRS, or personal capital, please conduct your own due diligence or consult a MAS-licensed financial adviser before committing funds.