



Revenue is up 25% while net profit dropped 59% into a sea of legacy red ink. Management wants you to focus on the “New Keppel” operating engine, but your cash returns still carry the burden of yesterday’s offshore rigs. If you rely on this distribution for your CPF or SRS income, here is what the slide deck did not highlight in the cold light of day.
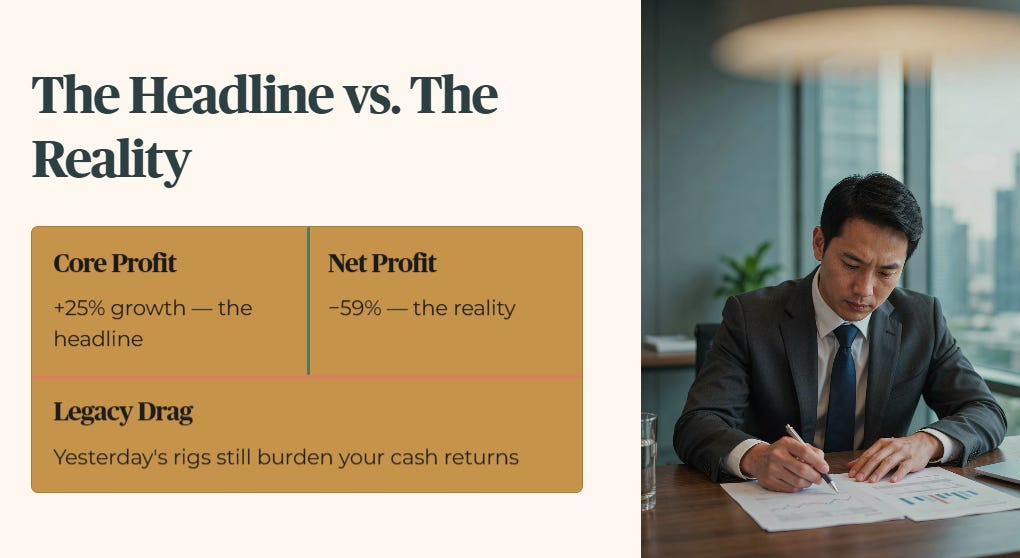
If you’re counting on Keppel to fund CPF or SRS drawdown next quarter, the Zone 5 verdict below should stop you before you average down on today’s dip. I’ve been tracking Keppel’s transition since the asset-management pivot began, and this is the first quarter where the yield math itself, not just the transformation story, forces a hard stop.

Two very different investors are reading this stock right now, one leaning on the distribution, one watching the growth story, and the numbers below matter differently to each of them. Let’s get into what actually happened.


The Slide-by-Slide Audit (The Deep Dive)
Iggy’s Insight Block 1
The Non-Core Portfolio for Divestment
The Reality Check (InvestingPro Integration)
The Yield Test (Where This Verdict Actually Gets Decided)
Financial Health Checklist, Part 1: Income & Distribution
Financial Health Checklist, Part 2: Debt Health and Balance Sheet
The Forward Outlook
Scenario Stress-Test Analysis
Iggy’s Insight Block 2
The Slide-by-Slide Audit (The Deep Dive)
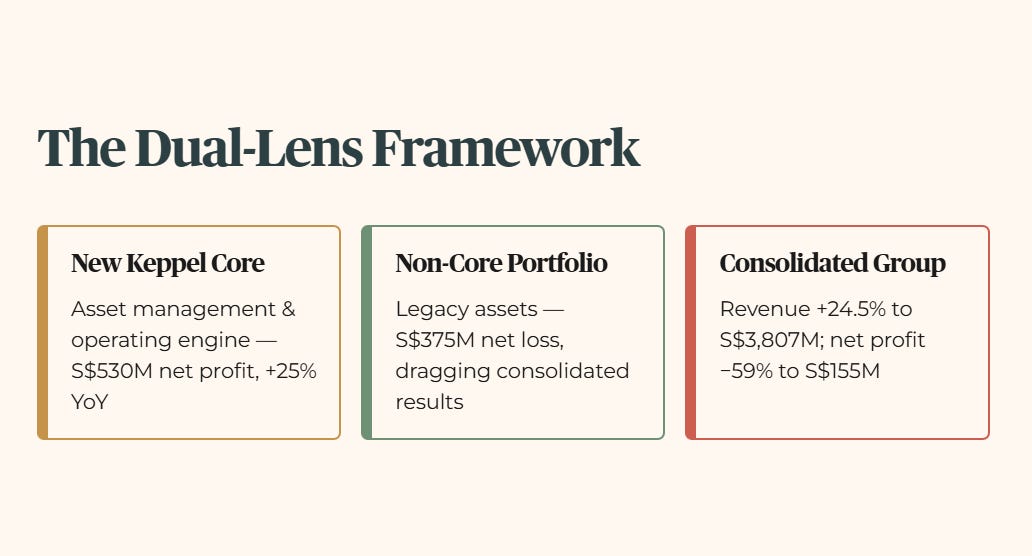
Keppel presented its 1H 2026 results under a dual-lens framework: isolating “The New Keppel” core operations from its legacy Non-Core Portfolio for Divestment. Consolidated Group revenue expanded 24.5% year-on-year to S$3,807 million, yet consolidated net profit plummeted 59.0% to S$155 million. The core asset management and operating engine generated S$530 million in net profit, up 25.0% year-on-year. However, non-core legacy assets dragged the total group down with a severe S$375 million net loss.
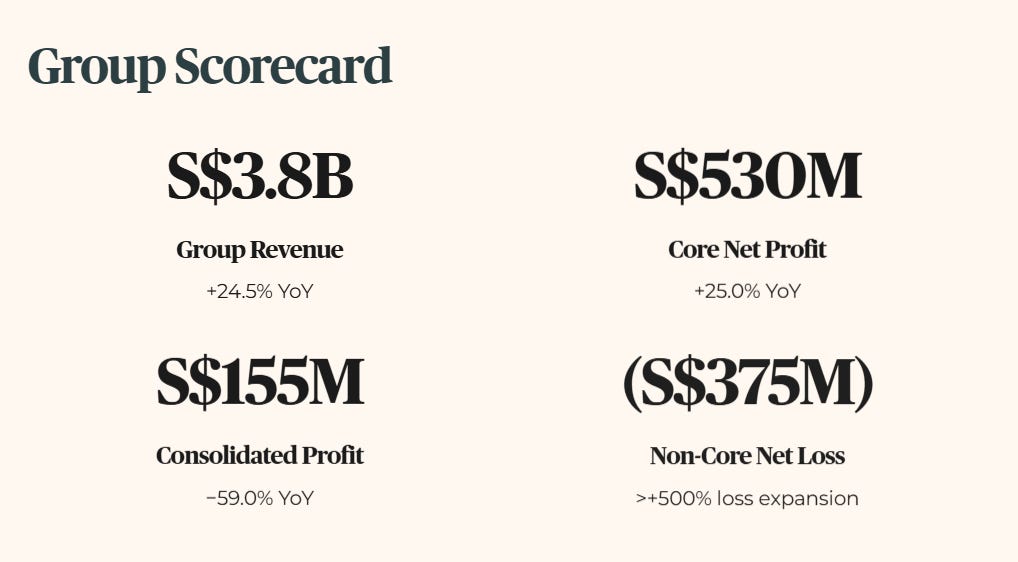
Every numerical comparison in this audit appears verbatim in the accompanying structured balance sheet and performance scorecards below.
Infrastructure Division Performance
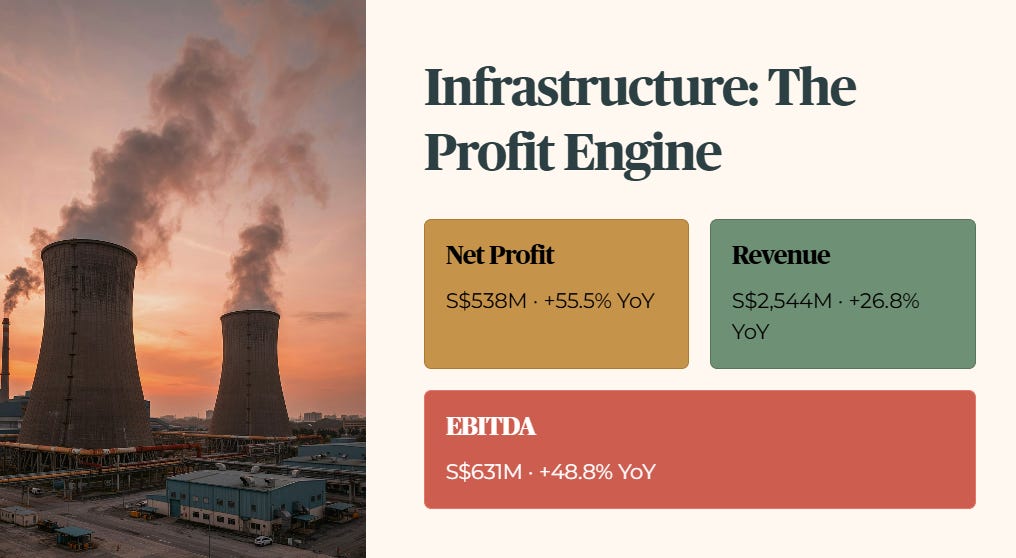
The Infrastructure Division remained Keppel’s central profit driver, delivering S$538 million in net profit, representing a 55.5% expansion year-on-year from S$346 million. Consolidated division revenue hit S$2,544 million, up 26.8% from S$2,007 million. Segment operating profit grew 42.7% to S$551 million, while EBITDA surged 48.8% to S$631 million.
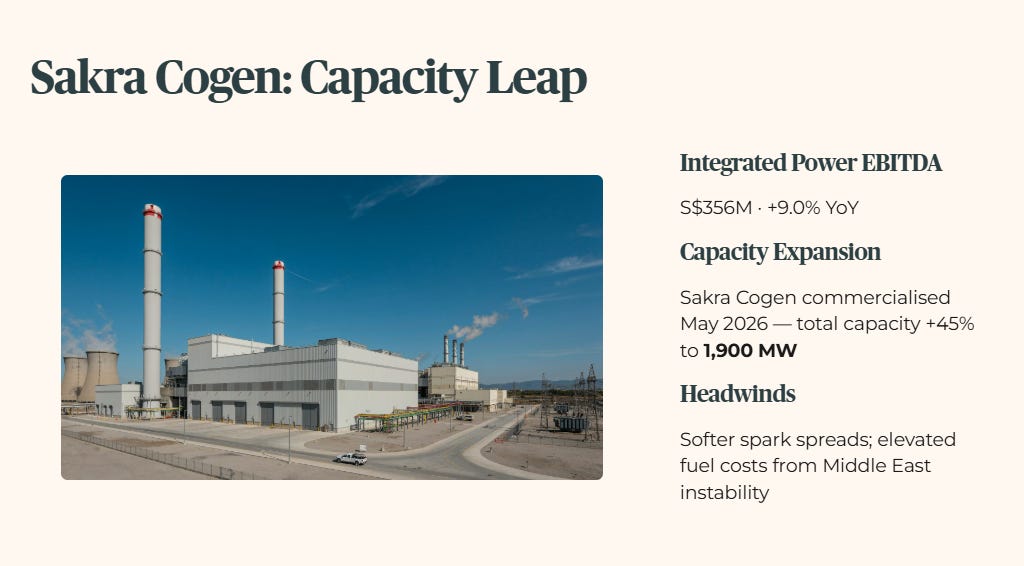
The core operating engine, Integrated Power, generated S$356 million in EBITDA, up 9.0% year-on-year. Growth was bolstered by the commercialisation of the Keppel Sakra Cogen Plant in late May 2026. This hydrogen-compatible Combined Cycle Gas Turbine plant expanded Keppel’s total operational power generation capacity by 45% to 1,900 MW. The single month of operational contribution from Sakra Cogen helped offset softer regional spark spreads and elevated fuel logistics costs caused by Middle Eastern geopolitical instability.
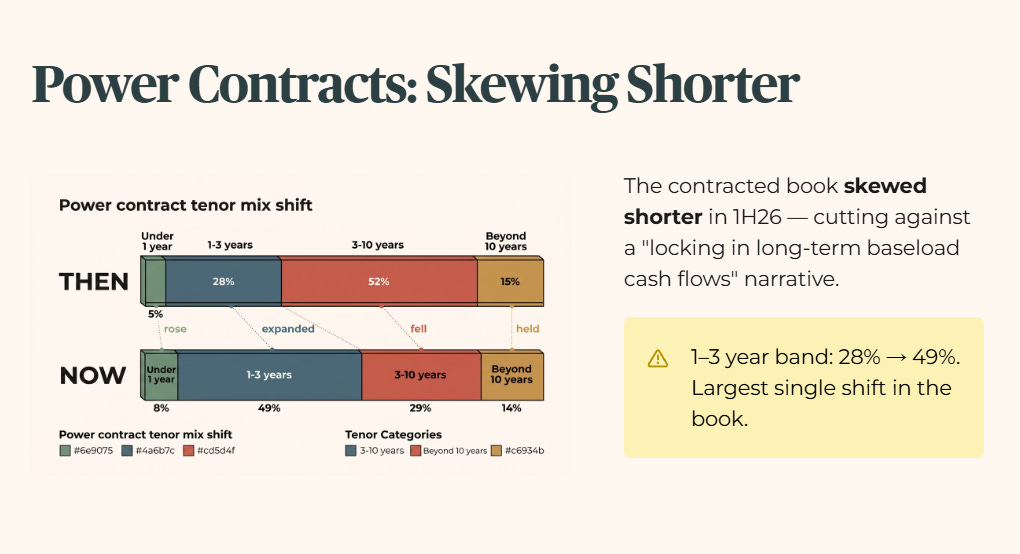
Management’s power contracting mix actually shifted toward shorter tenors over the past six months, not longer ones as the slide framing might suggest. Contracts under 1 year rose to 8% of the power portfolio from 5% at end-2025. The 1 to 3 year band saw the largest swing, expanding to 49% from 28%, the single biggest move in the book. Contracts spanning 3 to 10 years fell to 29% from 52%, and contracts beyond 10 years held roughly steady at 14%, down slightly from 15%.
Read plainly: the contracted book skewed shorter in 1H26, which cuts against a “locking in long-term baseload cash flows” narrative.
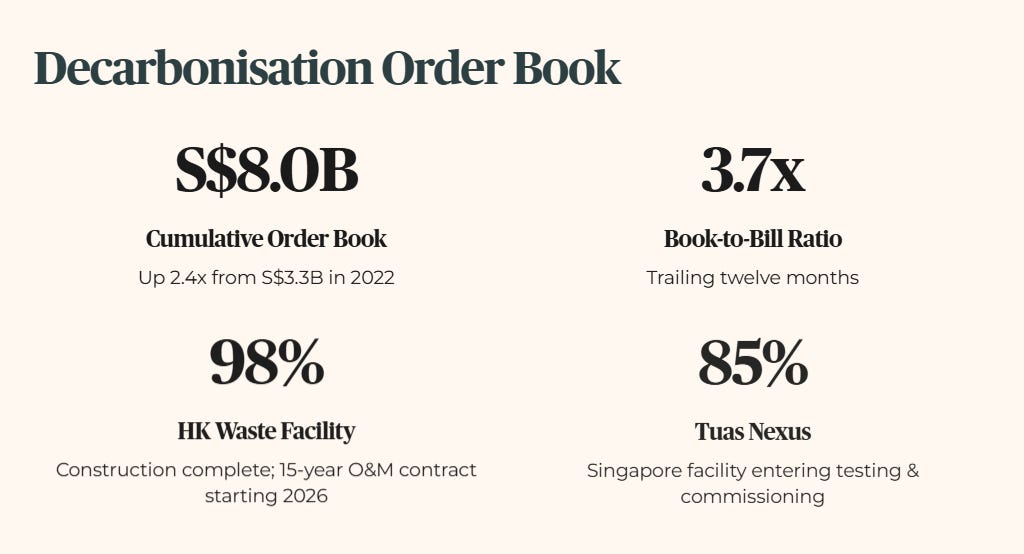
In Decarbonisation & Sustainable Solutions, long-term contracts expanded to a cumulative order book of S$8.0 billion as of June 2026, up 2.4x from S$3.3 billion in 2022. This provides an active trailing twelve-month book-to-bill ratio of 3.7x. The Hong Kong Integrated Waste Management Facility reached 98% construction completion, with its 15-year operations and maintenance contract scheduled to begin contributing recurring earnings in 2026. The Tuas Nexus Integrated Waste Management Facility in Singapore reached 85% completion and is entering testing and commissioning.
Connectivity Division Performance
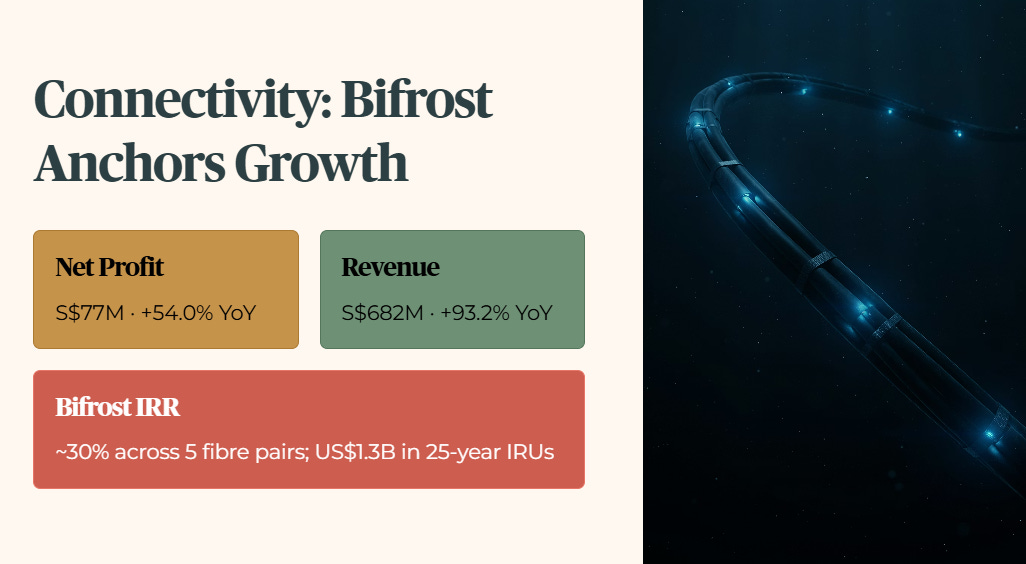
The Connectivity Division expanded net profit by 54.0% year-on-year to S$77 million, up from S$50 million. Division revenue surged 93.2% to S$682 million from S$353 million, driven by subsea cable deliveries and technology solutions contracts. EBITDA rose 37.0% to S$111 million from S$81 million, while profit before tax grew 44.4% to S$91 million from S$63 million.
Growth was anchored by the full commercialisation of all five fibre pairs on the Bifrost Cable System, securing US$1.3 billion in Indefeasible Rights of Use and 25-year operations and maintenance contracts. The project generated an internal rate of return of approximately 30% for Keppel and its private fund co-investors. Keppel is evaluating two additional subsea route developments linking Singapore to the Middle East and Japan, with final investment decisions targeted for end-2026.
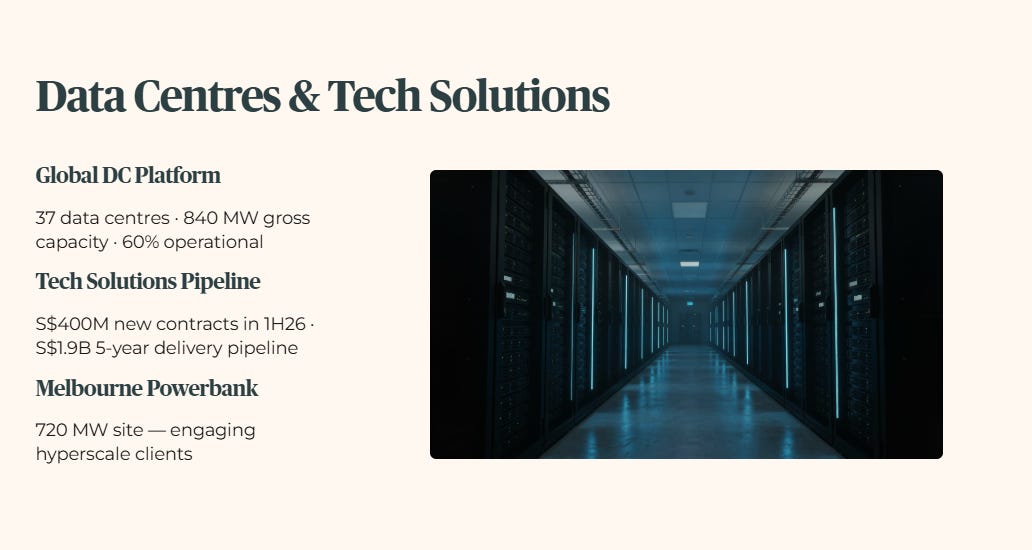
Keppel’s global data center platform encompasses 37 data centers across Asia-Pacific and Europe with a total gross power capacity of 840 MW, of which 60% is operational. Construction continues on the Floating Data Center and Keppel DC SGP 9. Keppel Technology Solutions secured S$400 million in new contracts during 1H 2026, building a 5-year delivery order pipeline of S$1.9 billion. Keppel is also engaging prospective hyperscale clients for its 720 MW powerbank site near Melbourne.
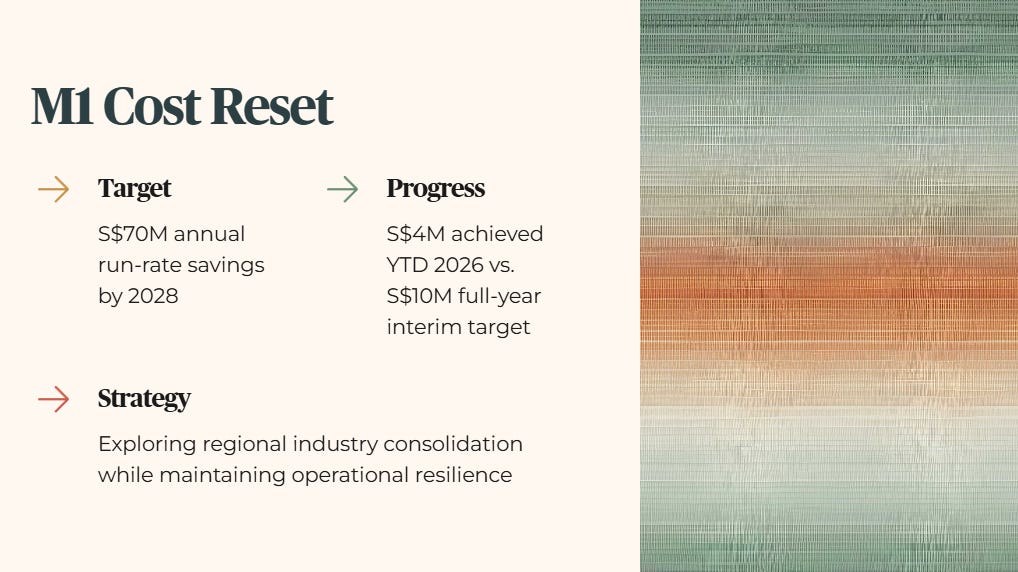
M1 Telco is executing a three-year cost reset targeting S$70 million in annual run-rate savings by 2028. The company achieved S$4 million in run-rate savings year-to-date in 2026 against its S$10 million full-year interim target. Management continues to explore regional industry consolidation opportunities while maintaining M1’s core operational resilience.
Real Estate Division Performance
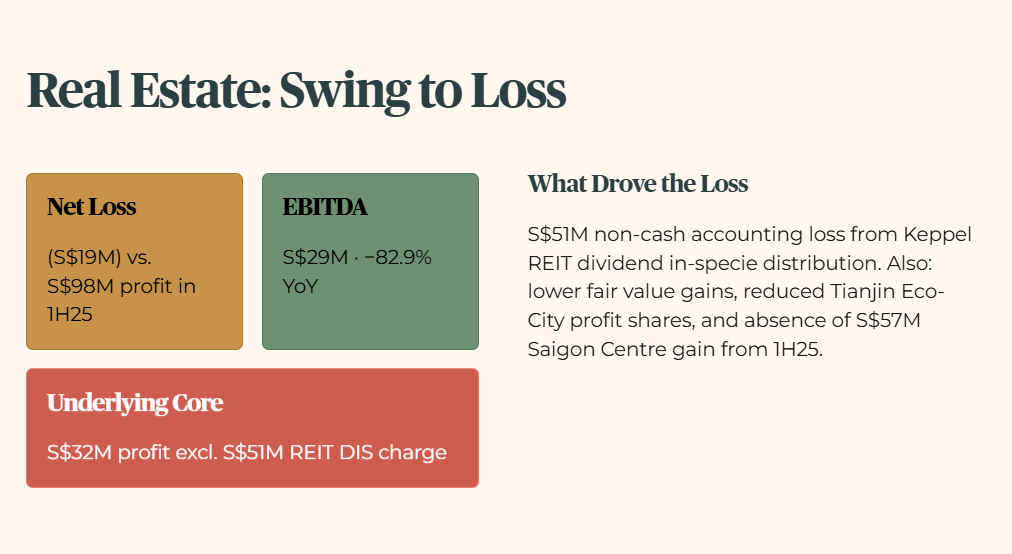
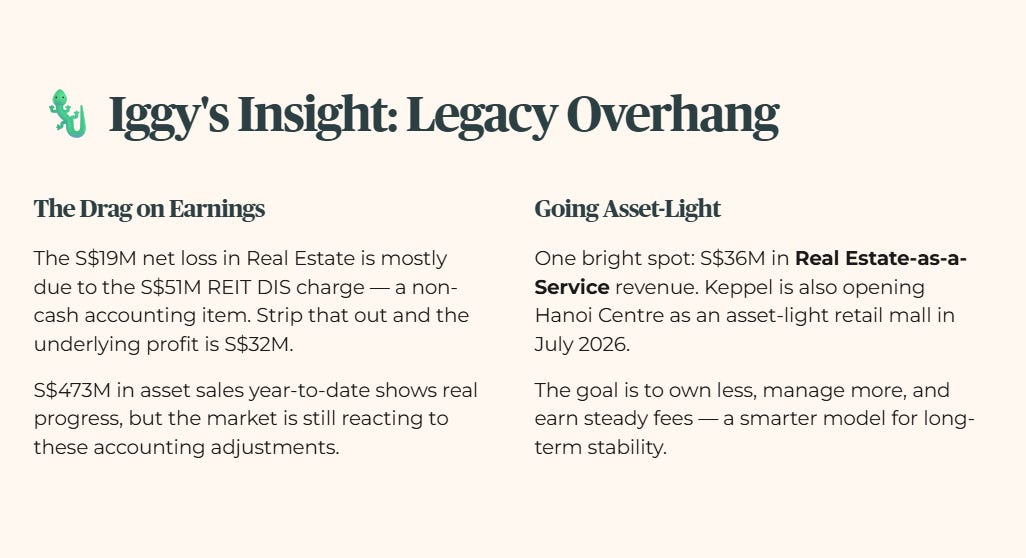
The Real Estate Division swung to a net loss of S$19 million in 1H 2026, compared to a net profit of S$98 million in 1H 2025. Operating profit dropped into negative territory at negative S$31 million from positive S$101 million. EBITDA contracted 82.9% to S$29 million from S$170 million.
This loss was driven by a non-cash accounting loss of S$51 million associated with the dividend in-specie distribution (a payout made in units of another listed entity instead of cash) of Keppel REIT units to shareholders. Excluding the dividend in-specie charge, the core real estate segment generated S$32 million in net profit. Underlying operating performance was constrained by lower fair value gains on investment properties, reduced profit shares from the Sino-Singapore Tianjin Eco-City, and the absence of the S$57 million partial divestment gain from Saigon Centre Phase 3 recorded in 1H 2025.
Keppel announced S$473 million in real estate asset monetisations year-to-date in 2026. The group generated S$36 million in Real Estate-as-a-Service revenue. In July 2026, Keppel opened Hanoi Centre, its first retail mall in Hanoi, under an asset-light master lease structure that avoids capital-intensive property ownership. The active residential landbank totals 31,811 units, with 43% located in China (13,736 units), 32% in Vietnam (10,109 units), 14% in Indonesia (4,430 units), 10% in India (3,444 units), and 1% in Singapore (92 units).
🦎 Iggy’s Insight Block 1
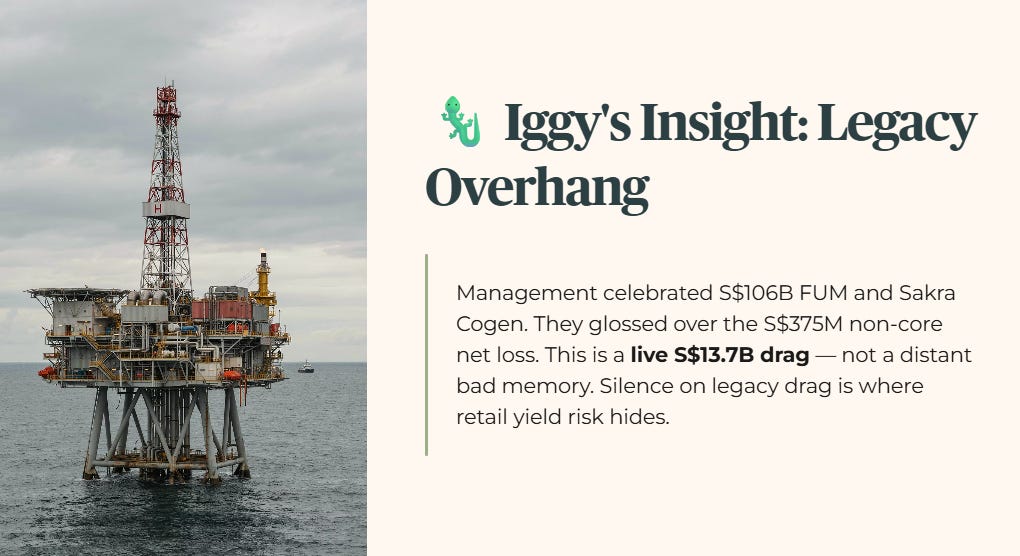
Management spent substantial presentation time celebrating S$106 billion in Funds Under Management and Sakra Cogen’s operational launch. However, they glossed over the Non-Core Portfolio’s massive S$375 million net loss. This legacy overhang is not a distant bad memory. It is a live S$13.7 billion drag that consumed group earnings through S$165 million in rig write-downs, foreign exchange translation losses, and KrisEnergy credit provisions. Management wants retail investors to price them as a nimble, asset-light manager. Yet, balance sheet risk remains heavily tied to legacy capital. Silence on legacy drag is where retail yield risk hides.
The Non-Core Portfolio for Divestment
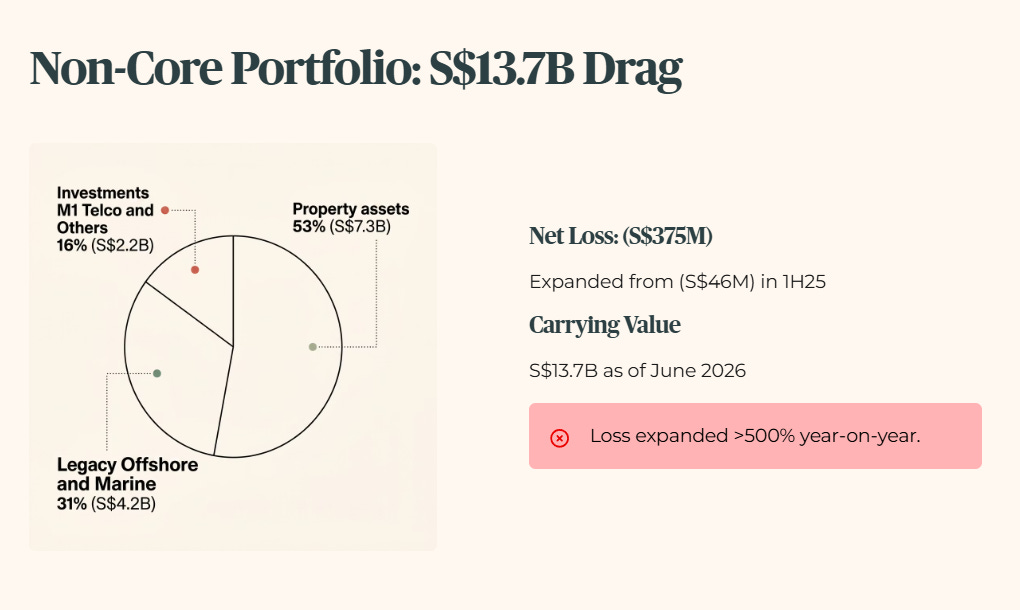
The Non-Core Portfolio recorded a net loss of S$375 million in 1H 2026, expanding significantly from a S$46 million net loss in 1H 2025. Carrying value stands at S$13.7 billion as of June 2026. Property assets comprise 53% (S$7.3 billion), Legacy Offshore & Marine assets account for 31% (S$4.2 billion), and Investments, M1 Telco & Others represent 16% (S$2.2 billion).
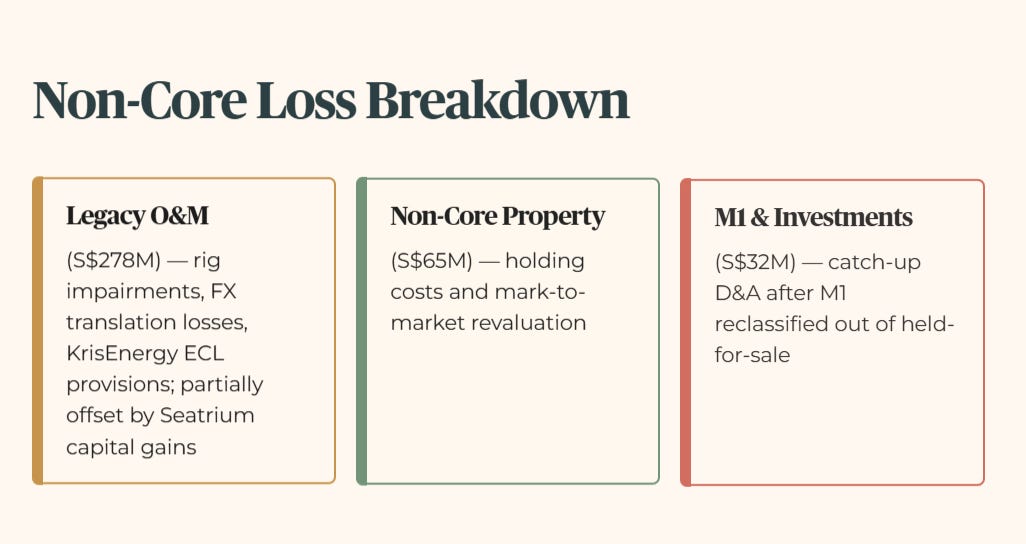
Legacy Offshore & Marine generated a net loss of S$278 million. This was driven by non-cash rig impairments, foreign currency translation loss recycling net of cost provision write-backs totaling S$165 million, legacy rig financing interest expenses, and expected credit loss provisions on KrisEnergy receivables. These were partially offset by capital gains on Seatrium shares. Non-core property assets generated a net loss of S$65 million due to holding costs and mark-to-market revaluation adjustments. Investments and M1 generated a net loss of S$32 million, driven by catch-up depreciation and amortisation charges following M1’s reclassification out of held-for-sale assets.
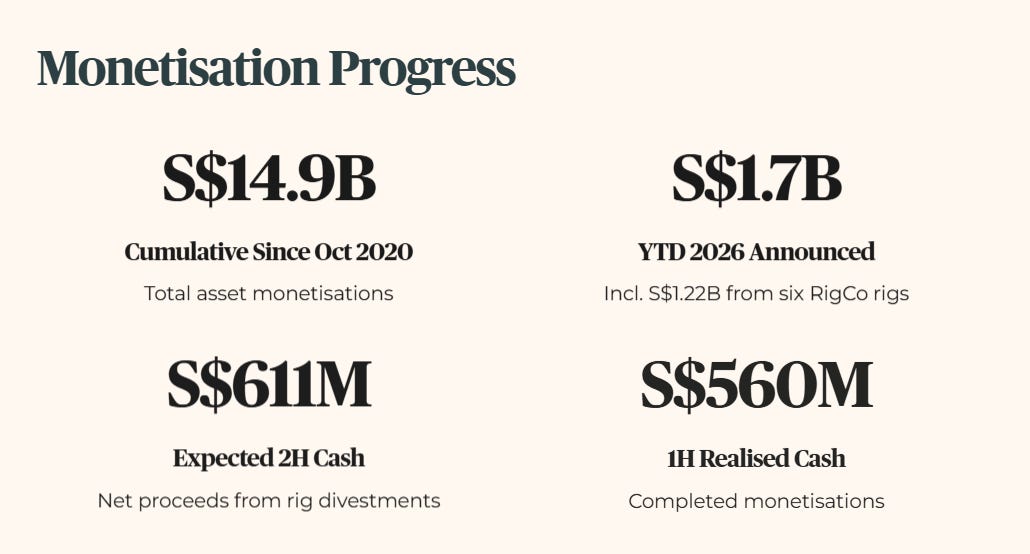
Cumulative asset monetisations reached S$14.9 billion since October 2020. Year-to-date 2026 announcements reached S$1.7 billion, including S$1.22 billion from monetising six operational RigCo rigs, S$372 million from i12 Katong, S$91 million from trading properties, and S$10 million from Keppel Philippines Properties. Keppel expects to collect S$611 million in net cash proceeds from the rig divestments in 2H 2026. Completed monetisations delivered S$560 million in realized cash proceeds during 1H 2026.
The Reality Check (InvestingPro Integration)
Management frames Keppel as a high-margin, pure-play asset manager targeting S$200 billion in Funds Under Management by 2030. However, valuation models show a clear divergence between core operational growth and consolidated balance sheet leverage.
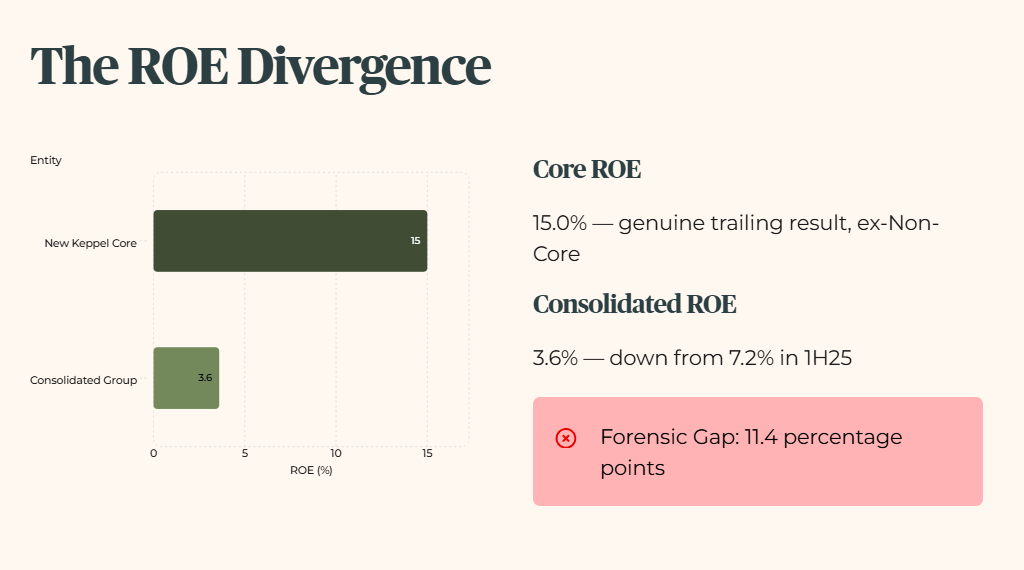
Keppel’s own reported New Keppel core ROE came in at 15.0% in 1H26, up from 14.7% a year earlier. That is a genuine, already-realised trailing result, not a forward target, and it only reflects the ex-Non-Core entity. Look at the number that governs the whole company shareholders actually own, and consolidated Group ROE fell to 3.6% in 1H26 from 7.2% in 1H25, dragged down by the Non-Core Portfolio’s write-downs.
This 11.4 percentage point divergence between core ROE (15.0%) and consolidated ROE (3.6%) is flagged as a FORENSIC GAP ALERT. Management focuses on core operating metrics while the consolidated reporting entity bears the weight of non-cash write-downs and legacy debt structures.
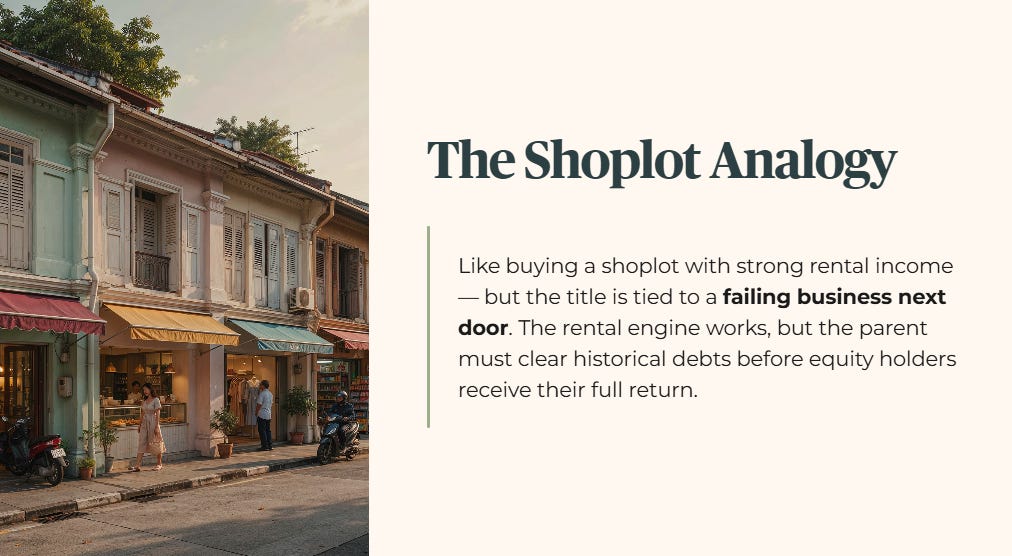
Think of this like buying a commercial shoplot that generates strong monthly rent, but finding out the owner tied the property title to a failing logistics business next door. The rental engine works well, but the parent company’s cash flow must continually clear historical debts before equity holders receive their full return.
The Yield Test (Where This Verdict Actually Gets Decided)
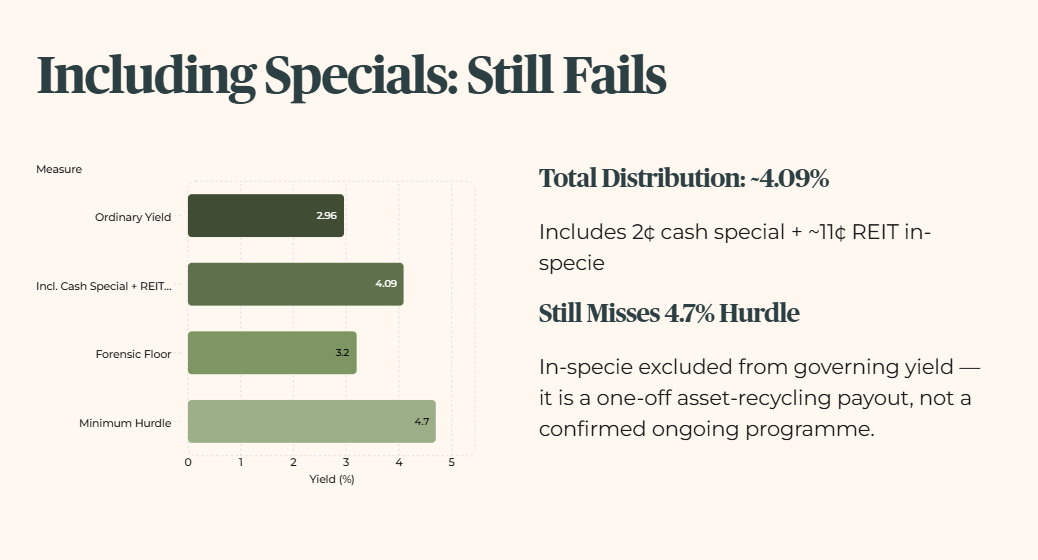
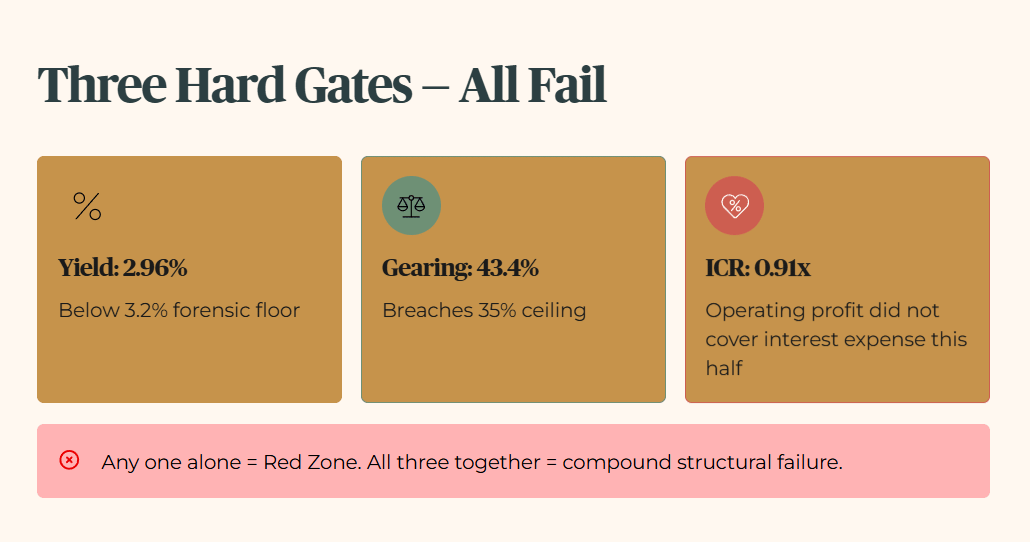
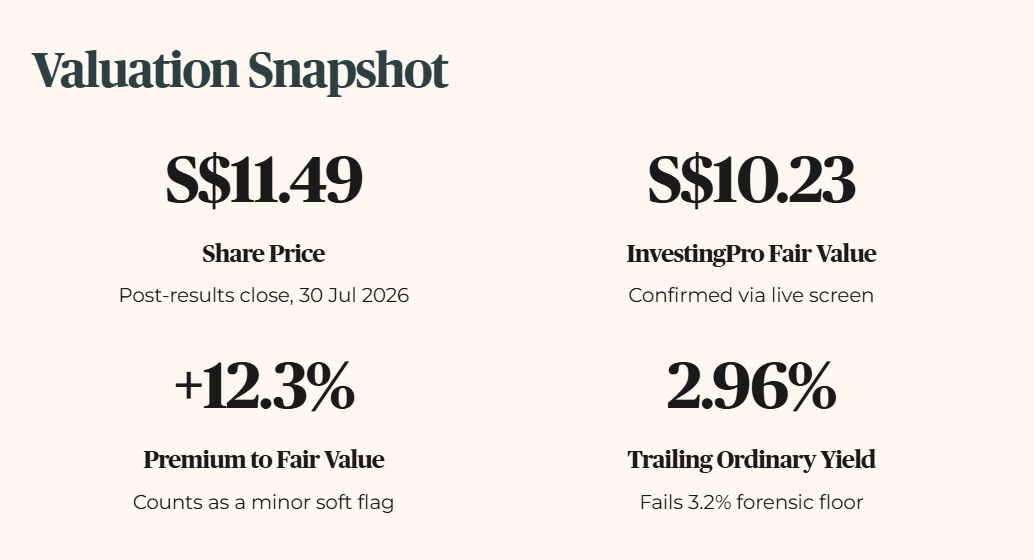
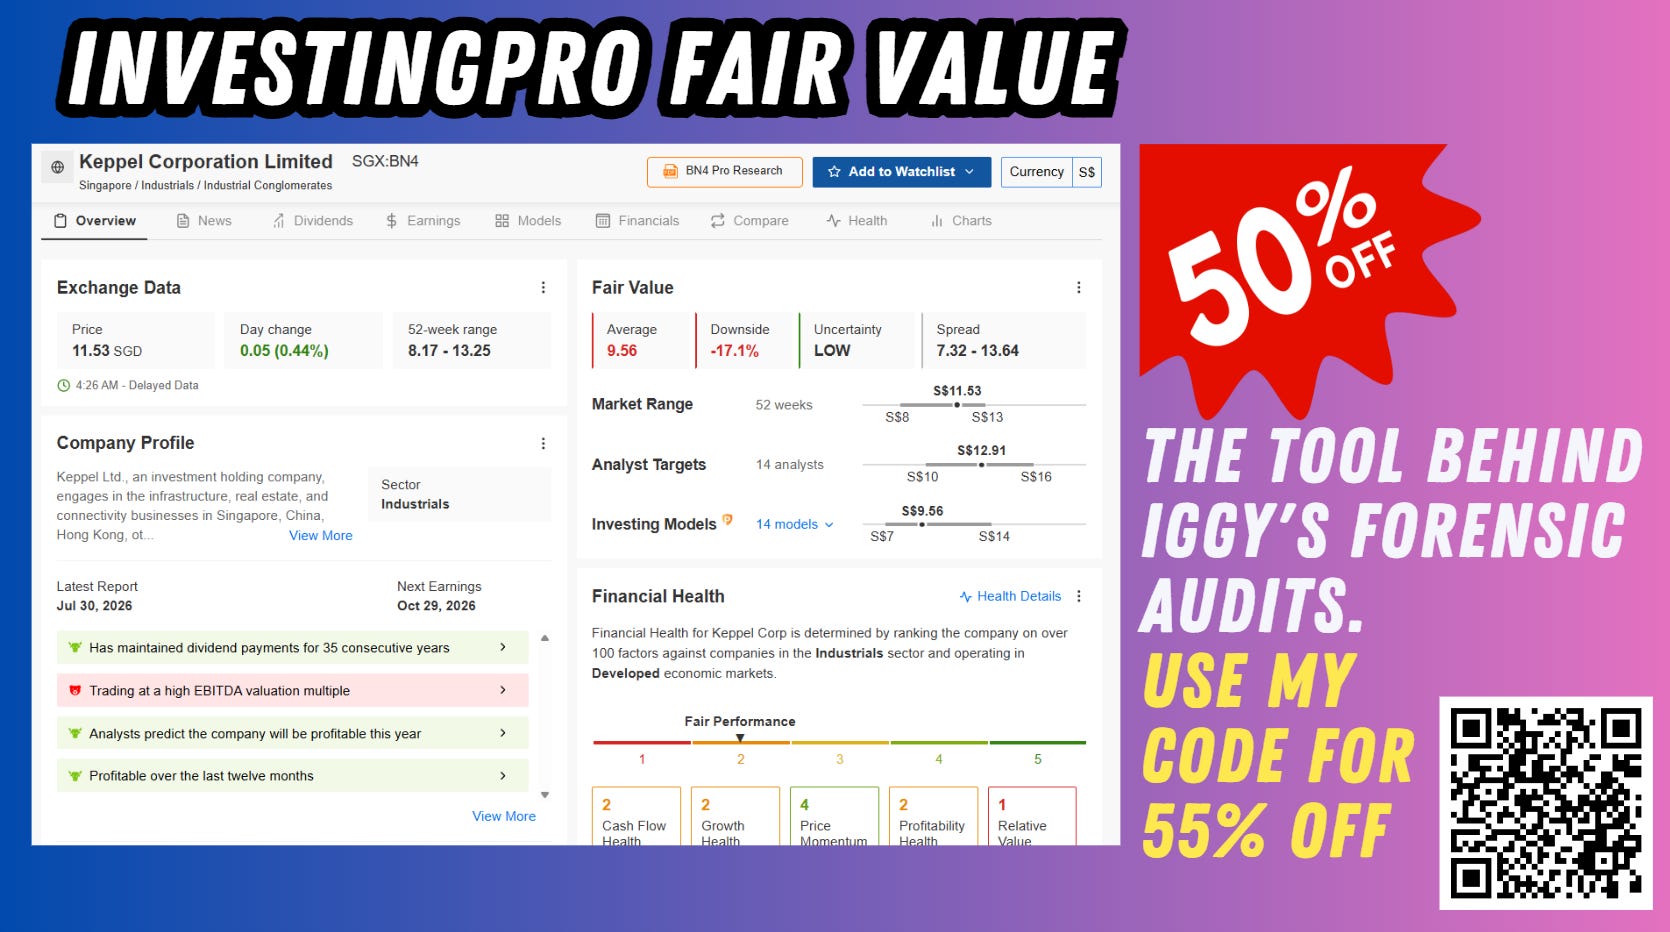
Here is the number that matters most if you’re holding Keppel for income: at Wednesday’s post-results close of S$11.49, Keppel’s trailing ordinary dividend of 34 cents a share, 15 cents interim (paid August 2025) plus 19 cents final (paid May 2026), works out to a 2.96% yield. That fails not just my 4.7% minimum yield hurdle (the income threshold I require before any stock qualifies for a retirement portfolio), it fails my 3.2% forensic floor outright, the conservative baseline I hold every SGX income name to regardless of where interest rates sit today.
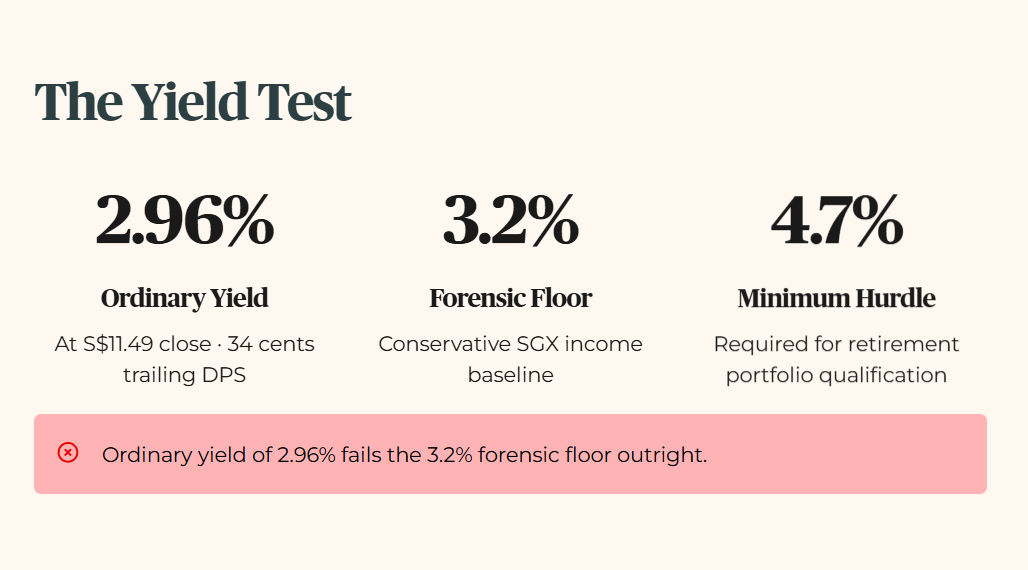
Even counting everything Keppel paid out this year, including the 2 cent cash special and the Keppel REIT units distributed in-specie (worth roughly 11 cents a share at the time of distribution), total yield only reaches 4.09%. That still misses the 4.7% hurdle. And per standing policy, the in-specie distribution is excluded from the number that actually governs this zone call anyway: it is a one-off asset-recycling payout tied to a specific transaction, not a confirmed ongoing programme the way DBS’s capital return schedule is, so it never belonged in a sustainable income calculation to begin with.
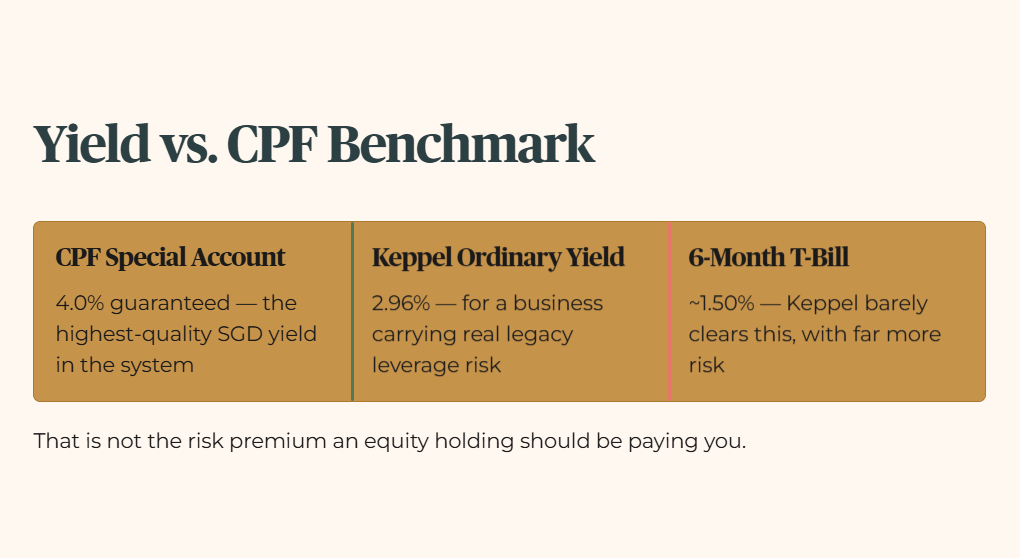
For context, the 3.2% floor and 4.7% hurdle are anchored against CPF Special Account’s guaranteed 4.0%, the highest-quality guaranteed SGD yield that exists in the system. Even measured against a far softer benchmark, the 6-month T-bill sitting near 1.50%, Keppel’s ordinary yield alone still clears that bar by less than double, for a business carrying real legacy leverage risk on its consolidated books. That is not the risk premium an equity holding should be paying you.
Financial Health Checklist, Part 1: Income & Distribution
Keppel Ltd. Core Operating Performance confirms solid recurring revenue expansion, offset by consolidated Non-Core portfolio write-downs.
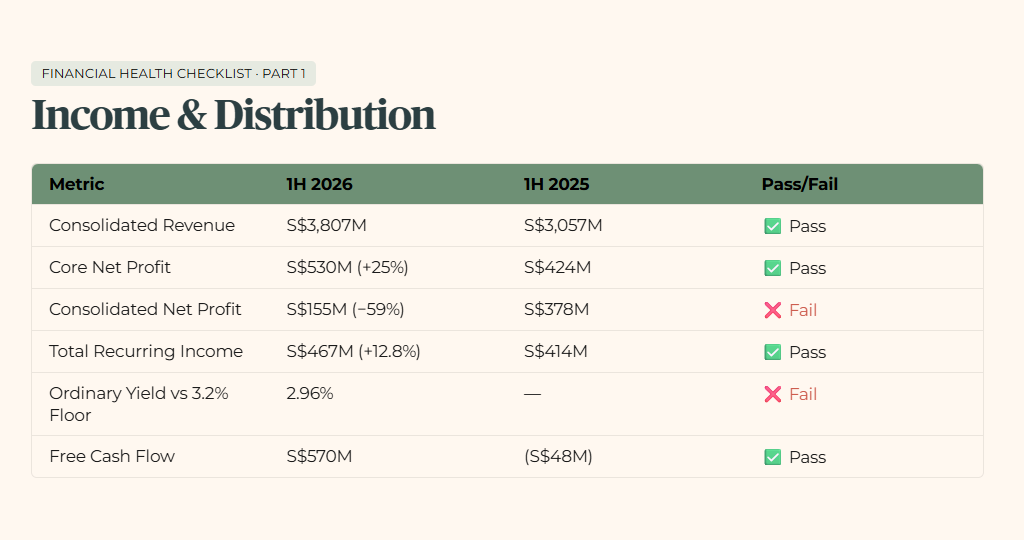
Note: the “Interim Dividend Per Share” row measures payment consistency (flat quarter-on-quarter), a separate question from whether the resulting yield clears the forensic floor. The two rows above answer different questions; only the yield-vs-floor row governs the zone call.
Every figure in the table above is reflected verbatim in the editorial prose. Consolidated revenue hit S$3,807 million (+24.5%), Core Net Profit reached S$530 million (+25.0%), Consolidated Net Profit fell to S$155 million (-59.0%), Total Recurring Income reached S$467 million (+12.8%), Asset Management Fees totaled S$200 million (+2.6%), the Interim Dividend remained flat at S$0.15 per share, and Free Cash Flow swung to positive S$570 million from negative S$48 million.
GEARING ALERT
Financial Health Checklist, Part 2: Debt Health and Balance Sheet
Consolidated balance sheet leverage breaches primary risk thresholds due to legacy debt consolidation, while New Keppel core leverage remains inside conservative limits.
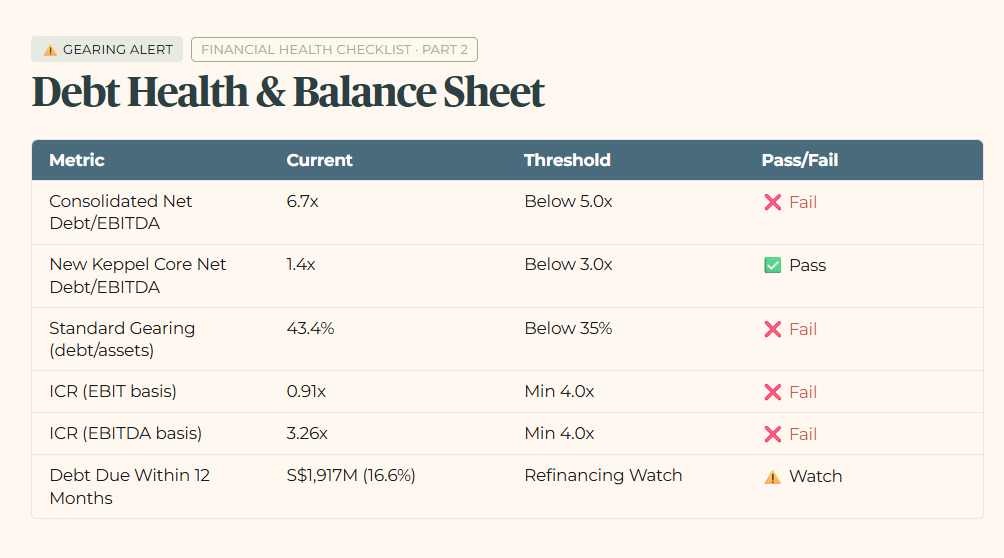
Every figure in the table above is now confirmed directly against Keppel’s own 1H 2026 condensed consolidated interim financial statements, filed 30 July 2026, not the presentation deck. Consolidated Net Debt to EBITDA expanded to 6.7x as at June 2026 from 5.8x as at December 2025. New Keppel Core Net Debt to EBITDA held stable at 1.4x on Keppel’s own internal segment split, a figure Keppel discloses but does not support with a separately published core-only balance sheet.
Standard gearing (total borrowings and lease liabilities of S$11,517M over total assets of S$26,523M) comes to 43.4%, breaching the 35% ceiling. Even on the more generous net-debt basis, netting off cash, it’s 35.2%, still over. Interest coverage fails on both bases tested: operating profit alone (S$173.6M) did not cover gross interest expense (S$189.9M) this half, a 0.91x reading; using Keppel’s own disclosed EBITDA of S$619M as a softer basis still gives 3.26x, still under the 4x floor.
No single bond maturity cliff stands out beyond the ordinary refinancing calendar, but S$1.92 billion, 16.6% of total borrowings, comes due within the next 12 months.
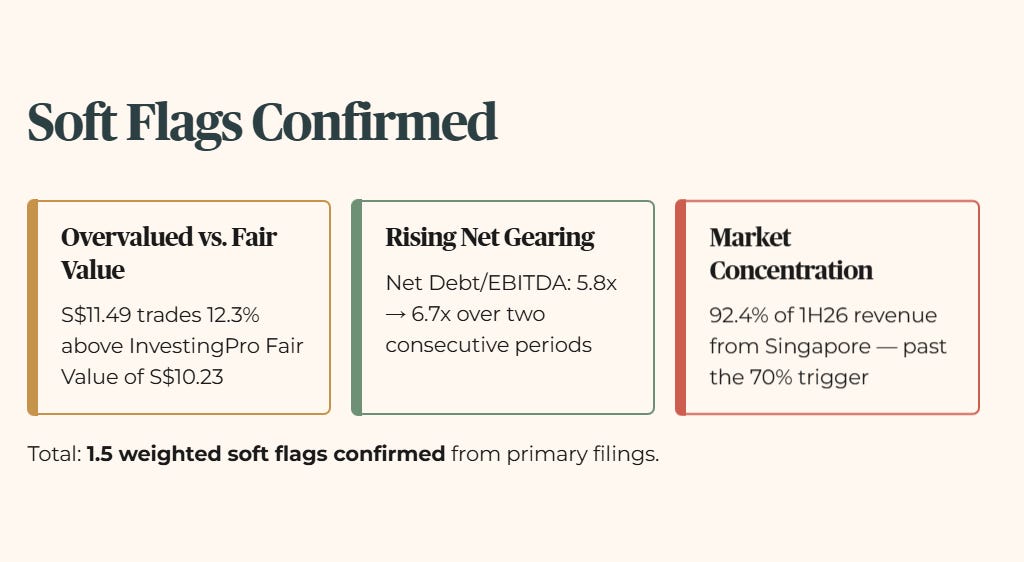
Three soft flags are now confirmed from this same primary filing and the InvestingPro pull, each minor (0.5 weighted): the stock trades 12.3% above InvestingPro Fair Value; net gearing has trended upward for two consecutive periods (82% to 84% on Keppel’s own equity-basis metric, 5.8x to 6.7x on Net Debt to EBITDA); and 92.4% of 1H26 revenue came from Singapore alone, well past the 70% single-market concentration trigger. That’s 1.5 weighted soft flags confirmed. A fourth candidate flag, consolidated net profit declining across two consecutive periods, remains unconfirmed pending a prior-period comparison this session didn’t pull, and isn’t counted here.
Dividend Trajectory
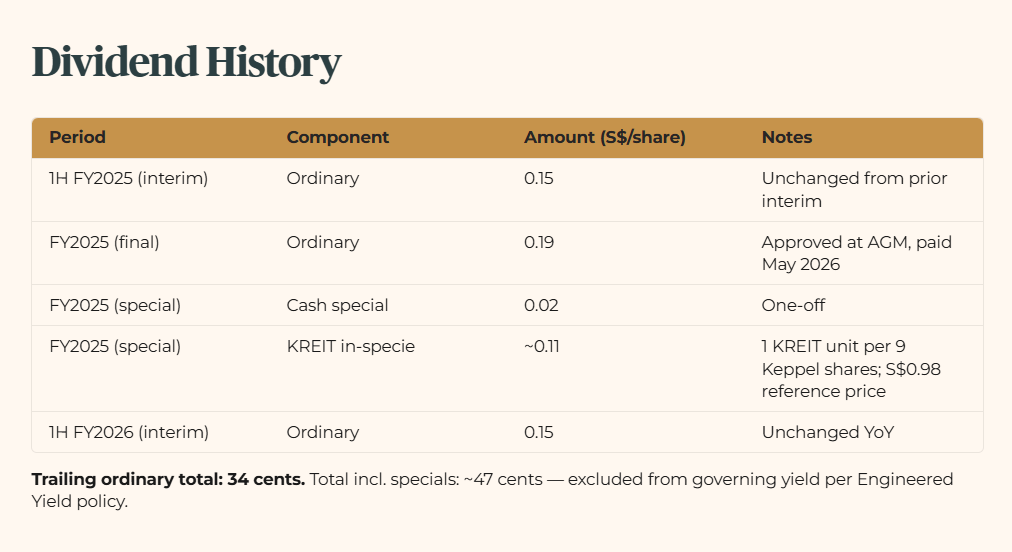
Trailing ordinary total governing this zone call: 34 cents. Total distribution including specials: approximately 47 cents, excluded from the governing yield per standing Engineered Yield policy. Multi-year comparatives (FY2023, FY2024) were not part of this session’s data pull and are flagged for a future refresh rather than approximated here.
Valuation Snapshot (Peer Comparison Not Available This Session)
The Window Is Already Open
The Window Closes Fast. In this market, the difference between a “Sanctuary” and a “Yield Trap” is decided in a single trading session. By the time this analysis reaches you as a free subscriber, the entry window Iggy identified has already opened, and often closed.
Iggy’s Elite Investors don’t just get the report earlier. They get it when the numbers still matter, zero-day forensic breakdowns, the full “Red Zone” watchlist, and institutional-grade cheatsheets at the moment the setup is live, not after the market has already priced it in.
For S$12/month, less than two kopi and kaya toast sets at Raffles Place, you stop being the Exit Liquidity and start being the Analyst.
The forward outlook section that follows takes the confirmed yield, gearing, and interest coverage failures and runs them through Keppel’s fund-management targets and non-core divestment timelines, translating today’s structural Zone 5 verdict into a scenario stress-test investors can plug directly into their CPF and SRS retirement plans.
