


I have audited fourteen SGX stocks in the past three weeks. Eleven failed my forensic floor before I got past the first table. Two landed in Zone 4 Caution. One made it to Zone 3 Conditional — and that is the stock we are talking about today.
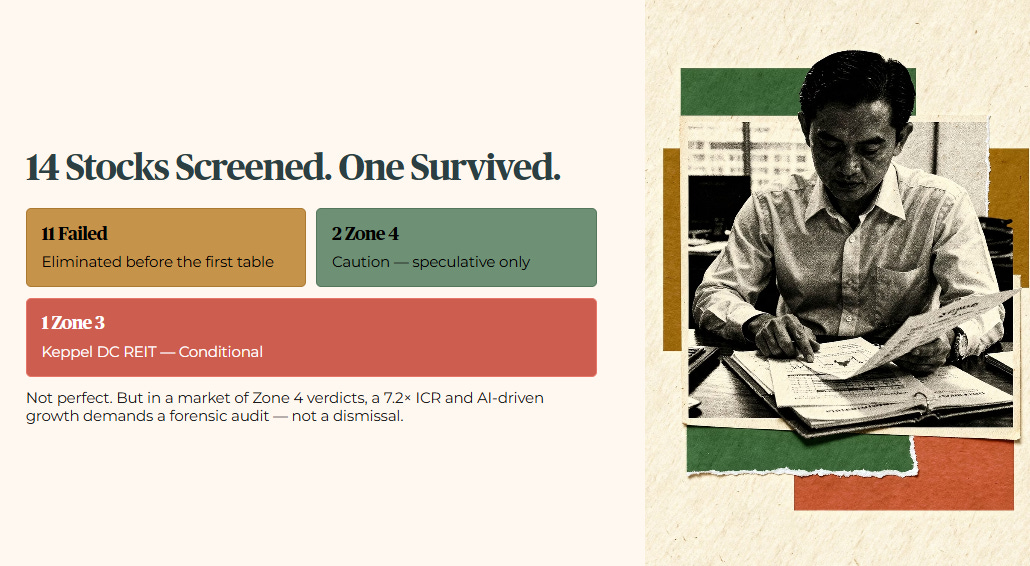
Keppel DC REIT is not a perfect retirement asset. I will be upfront about that. The yield misses my 4.7% hurdle by 15 basis points and the gearing is sitting right at my ceiling. But in a market where Zone 4 and Zone 5 verdicts are the norm, a stock with a fortress-grade interest coverage ratio of 7.2 times and genuine AI-driven revenue growth deserves a forensic audit — not a dismissal.
If you are a Singaporean building or protecting a dividend portfolio, the question is not whether this is perfect. The question is whether it is good enough, and for whom.
Before we get into the numbers, let me be clear about what I am doing here and who I am doing it for.
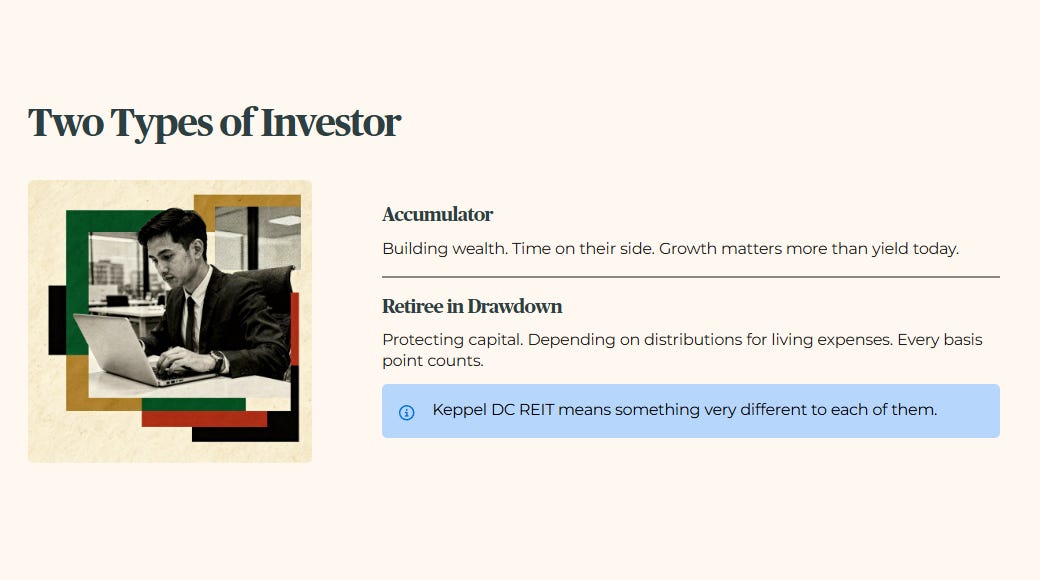
There are two types of investors reading this. The first is still in the accumulation phase — building wealth, with time on their side. The second is approaching retirement or already in it — drawing down, protecting capital, and depending on distributions to cover living expenses. Keppel DC REIT means something very different to each of them. I will show you exactly where the line falls.
My job is simple, even if the balance sheet is not. I read the numbers that the headline skips — the interest coverage, the gearing, the free cash flow sustainability — so that the Singaporean building or living off a dividend portfolio gets the same forensic clarity that institutional money takes for granted.

In This Article:
The Financial Snapshot
How Iggy Rates Every Stock
The 3 Good — The Bull Case
Good 1: Fortress-Grade Interest Coverage Ratio Provides Distribution Shield
Good 2: Verified AI Demand Driving Strong Revenue Growth
Good 3: Buying Below Fair Value
The 3 Red Flags — The Bear Case
Red Flag 1: Your Retirement Income Is At Risk Before the Yield Even Clears the Hurdle
Red Flag 2: Debt Level Sitting at the Ceiling — One Acquisition Away From Zone 4
Red Flag 3: Unitholder Dilution Running at an Aggressive Rate
Iggy’s Insight Block 1
The Singaporean Context — The Stress-Test
Dividend Trajectory
Peer Comparison
You Shouldn’t Be Reading This Alone
The Weighing Scale — Forensic Synthesis
Iggy’s Insight Block 2
Outro
Iggy’s Forensic Disclaimer
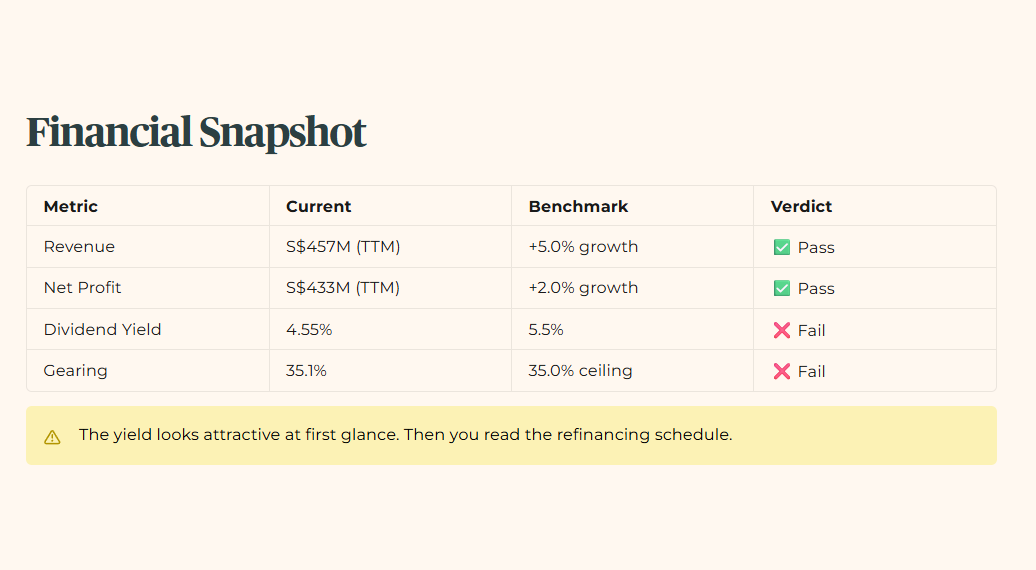
The Financial Snapshot
The yield looks attractive at first glance. Then you read the refinancing schedule.
How Iggy Rates Every Stock
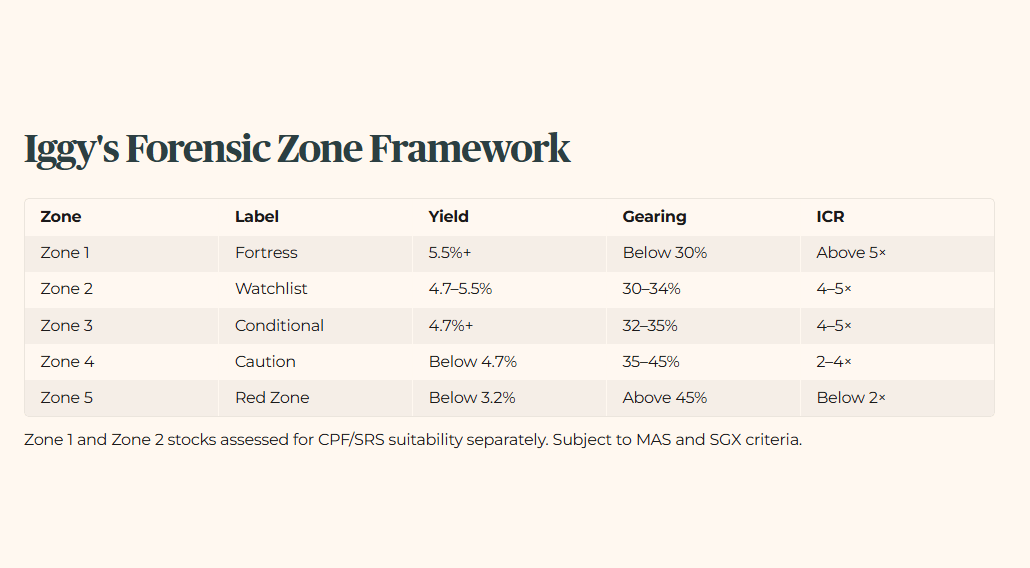
Zone 1 and Zone 2 stocks assessed for CPF/SRS suitability separately. Eligibility subject to MAS and SGX criteria.
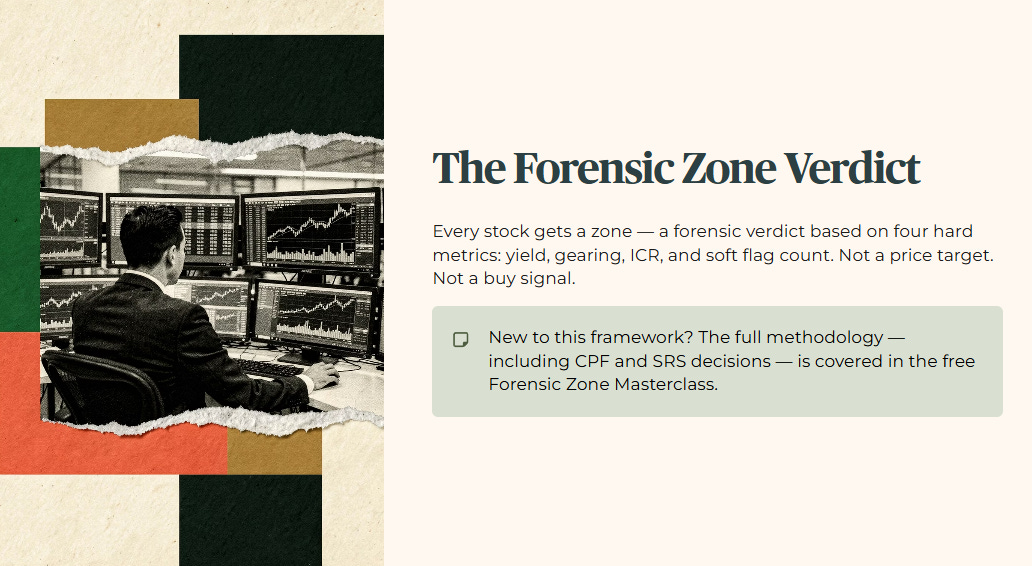
Every stock I cover gets assigned a Iggy Forensic Zone — a classification that tells you instantly whether an asset is retirement-ready, worth watching, or one to avoid entirely. The zone is not a price target or a buy signal. It is a forensic verdict based on four hard metrics: yield, gearing, interest coverage ratio, and soft flag count. If you are new to this framework and want to understand how each zone is constructed and what it means for your CPF and SRS decisions, I have covered the full methodology in detail in the free Forensic Zone Masterclass. For now, here is where every stock on my radar sits.
The 3 Good — The Bull Case
Good 1: Fortress-Grade Interest Coverage Ratio Provides Distribution Shield
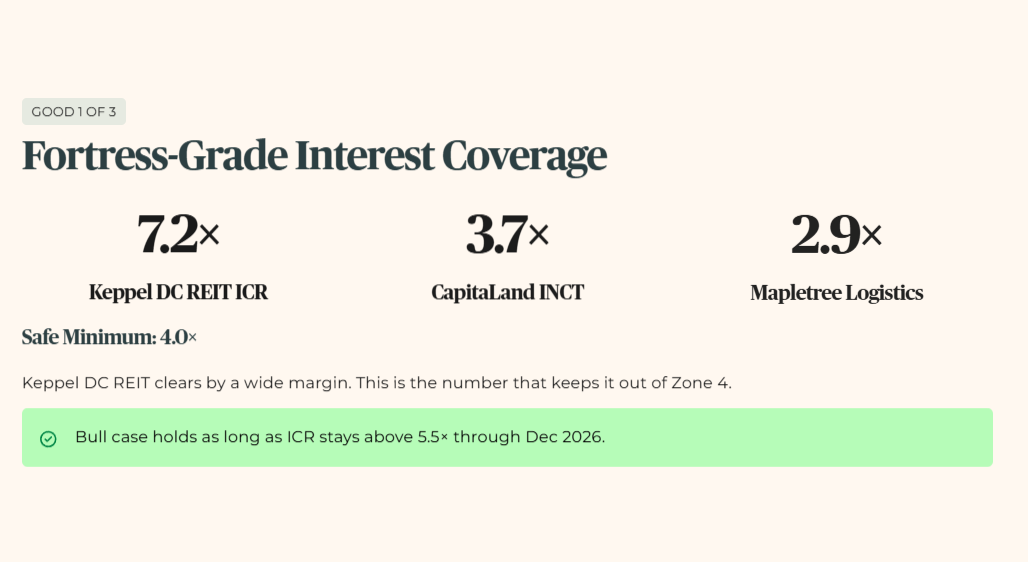
Here is the number that keeps Keppel DC REIT out of Zone 4. The interest coverage ratio — ICR, which measures how many times a company can pay its debt interest from operating income — sits at 7.2 times for the twelve months ending Q1 2026. My safe minimum is 4.0 times. Keppel DC REIT clears that by a wide margin.
To put this in context: CapitaLand Integrated Commercial Trust is at 3.7 times, improving from 3.5 times previously but still below my floor. Mapletree Logistics Trust is under pressure at 2.9 times. Keppel DC REIT outclasses both by a significant distance.
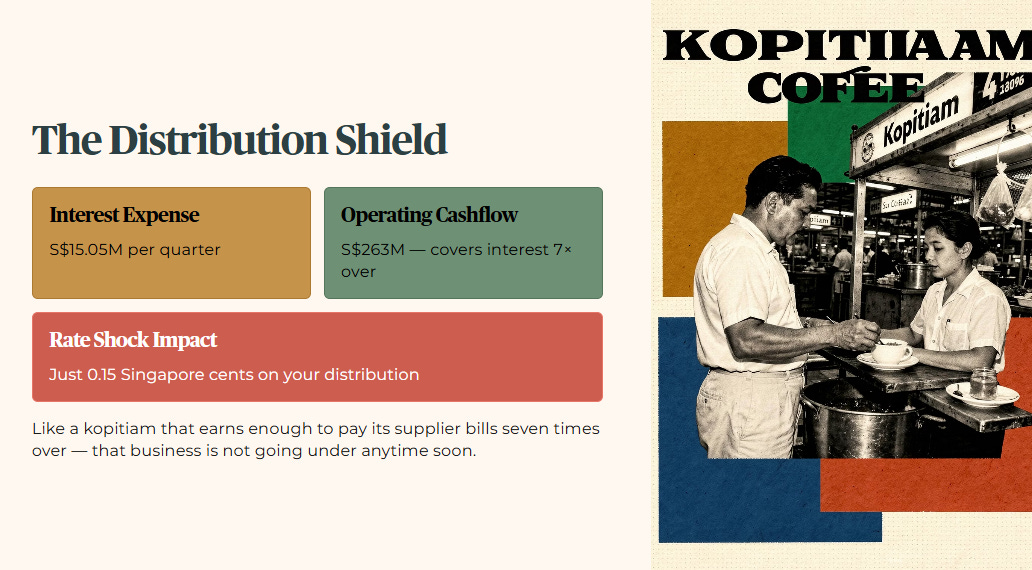
Even if global interest rates spike, the actual interest expense is S$15.05M per quarter, backed by operating cashflow of S$263M. The impact on your distribution would be a negligible 0.15 Singapore cents. For a 58-year-old heartland investor managing his SRS account, this operational resilience matters. Think of it like a kopitiam stall that earns enough to pay its supplier bills seven times over — that business is not going under anytime soon. This cushion protects your monthly cash flow even through a rate shock.
This bull case holds as long as the ICR remains above 5.5 times through the December 31 2026 reporting cycle
Good 2: Verified AI Demand Driving Strong Revenue Growth
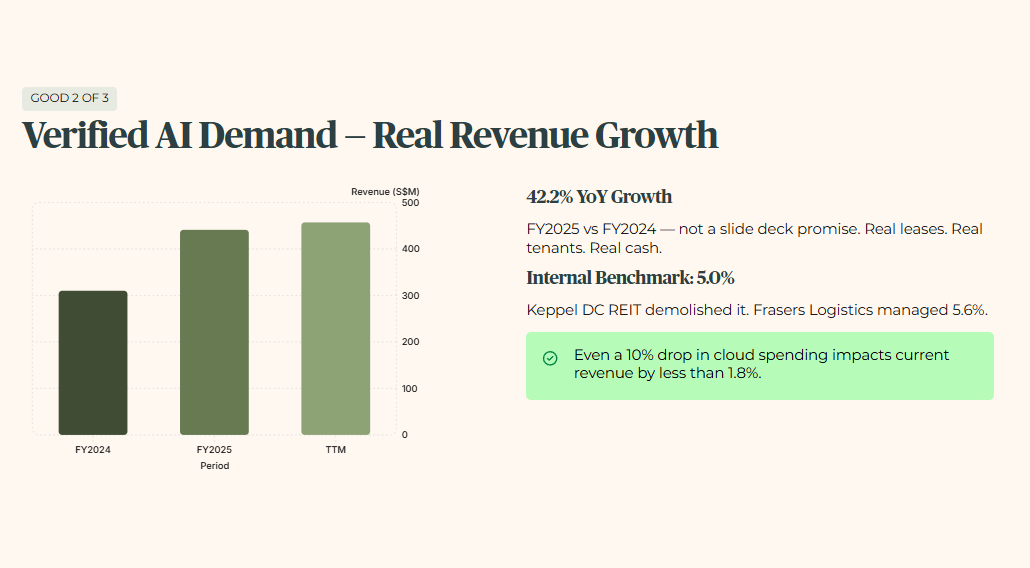
The REIT delivered revenue of S$441M for FY2025 — 42.2% year-on-year growth. That number has continued climbing to S$457M for the last twelve months. This is not a vague slide deck about AI potential. This is real rental income from real tenants paying real leases.
My internal benchmark for industrial sector growth is 5.0%. Keppel DC REIT has demolished that. Compare this to Frasers Logistics and Commercial Trust, which recorded 5.6% growth for FY2025 — respectable, but in a different league entirely. Even in a downturn scenario where enterprise cloud spending drops 10%, the REIT’s long leases mean the impact on current revenue would be less than 1.8%.
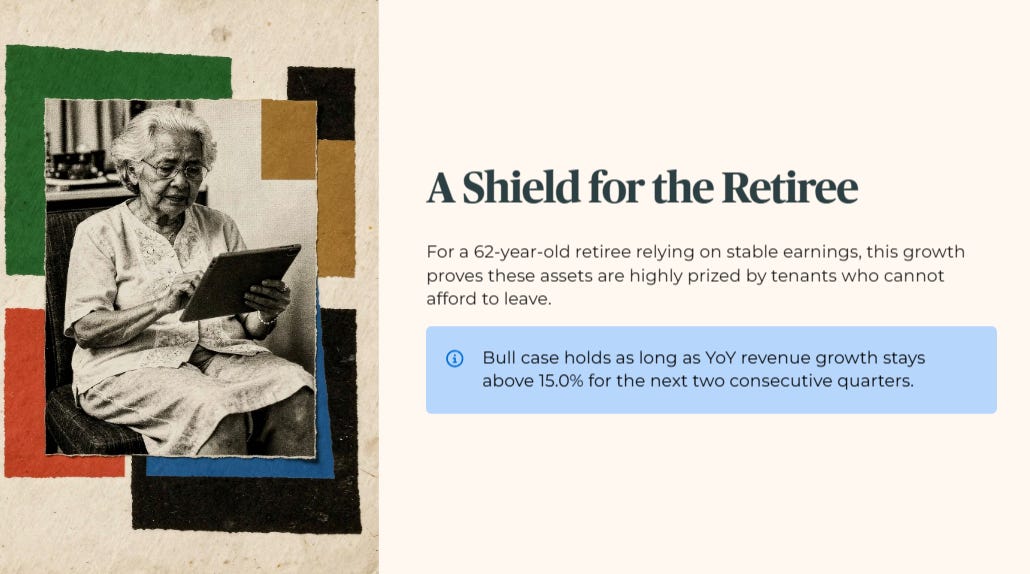
For a 62-year-old retiree relying on stable earnings for her dividend portfolio, this growth acts as a shield. It proves these assets are highly prized by tenants who cannot afford to leave. She gets to own a piece of global technology real estate with verifiable cash flows behind the distribution.
This bull case holds as long as year-on-year revenue growth remains above 15.0% for the next two consecutive quarters.
Good 3: Buying Below Fair Value
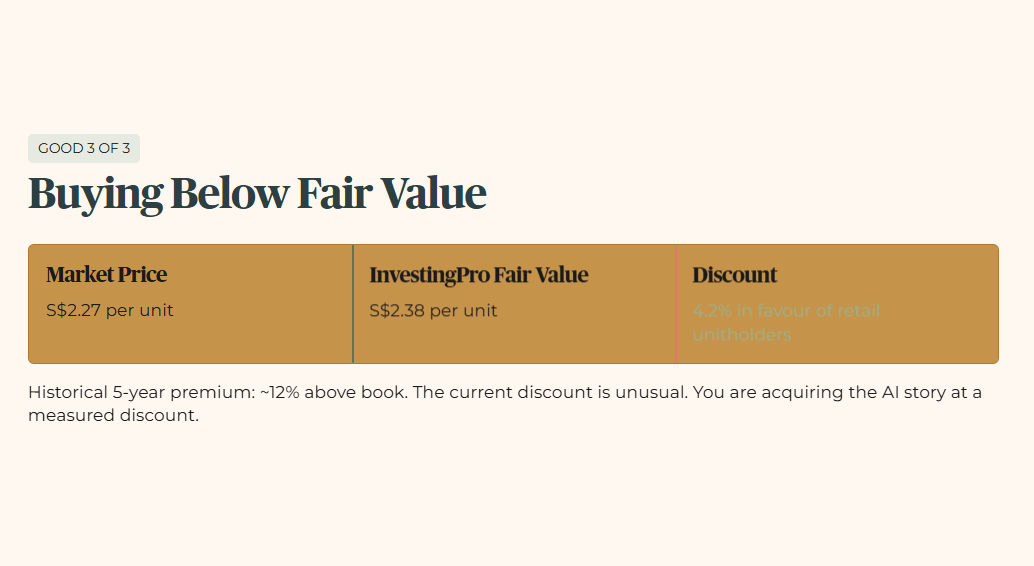
Keppel DC REIT is trading at S$2.27 per unit against its InvestingPro fair value of S$2.38. That creates a 4.2% margin in favour of retail unitholders. You are not overpaying for the AI story — you are acquiring it at a measured discount.
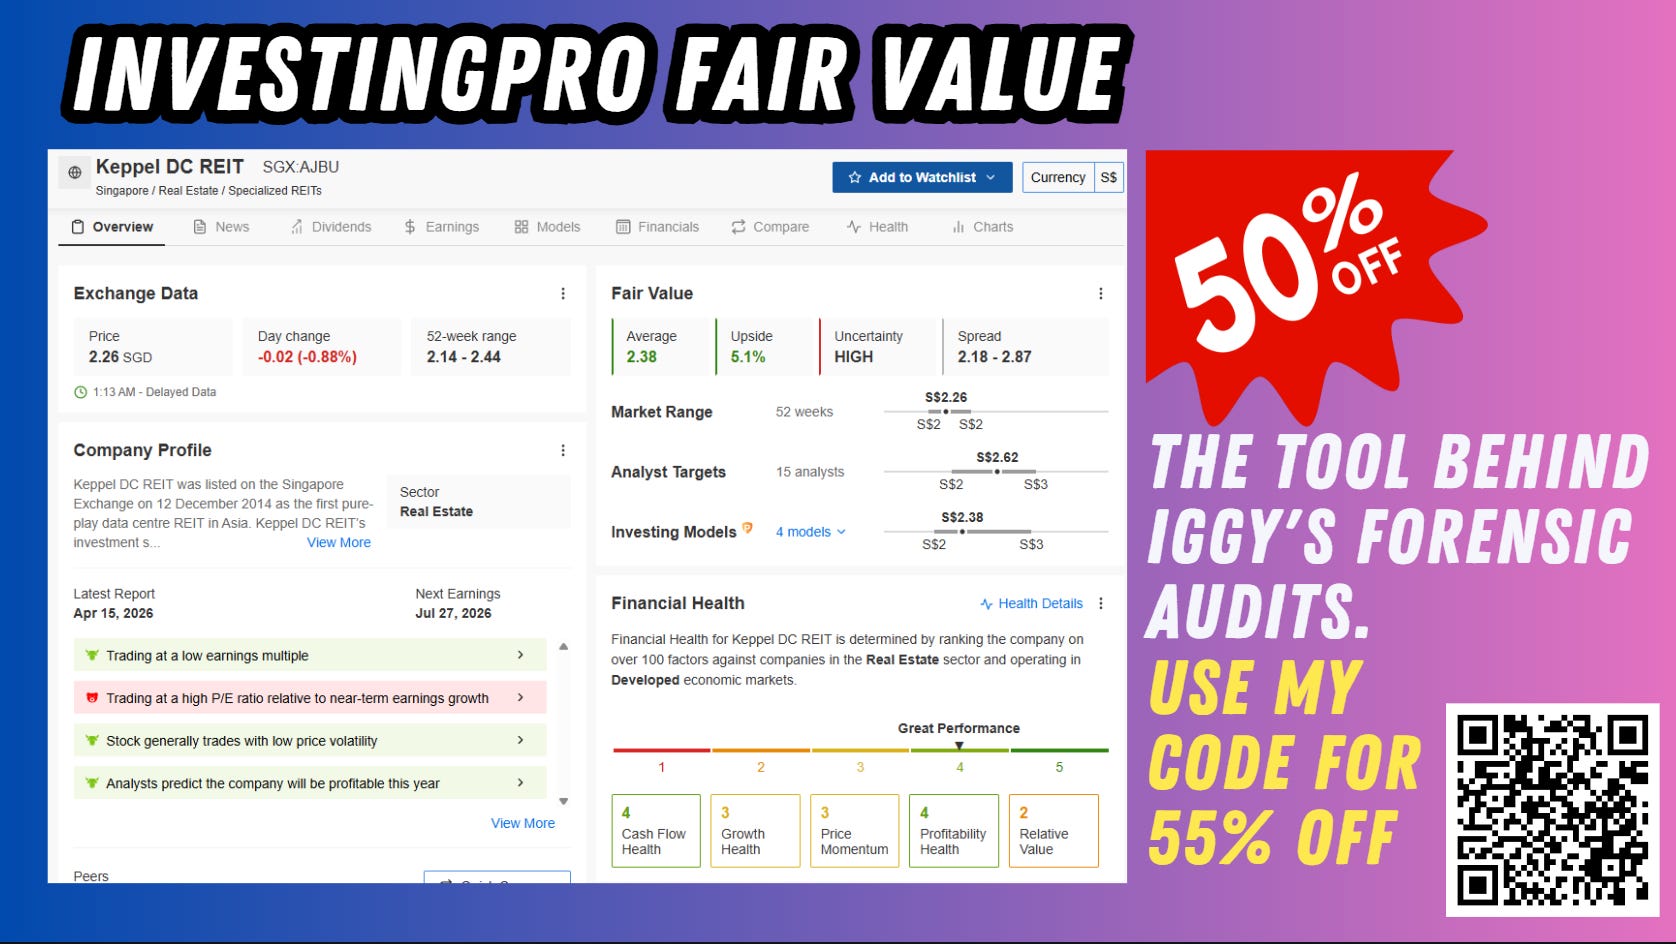
The historical five-year premium for this REIT has hovered around 12% above book value. The current discount is unusual and worth noting. For context, fair value premium data for peer data centres is not available via standard market data sources, so no direct peer comparison is possible here — but the principle stands: buying below model fair value is a meaningful entry signal when the underlying business fundamentals are sound.
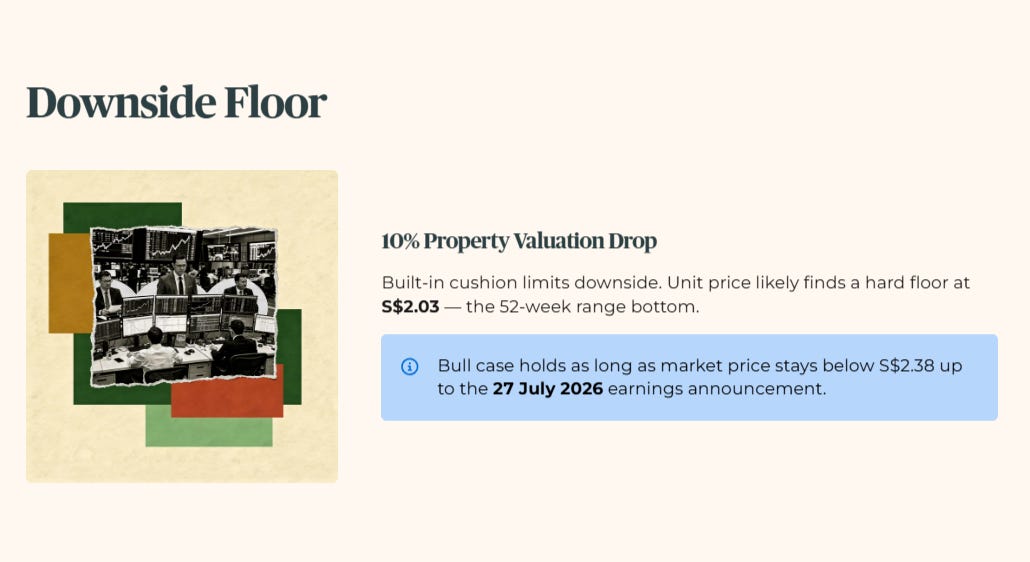
If global property valuations drop 10%, Keppel DC REIT’s built-in cushion limits downside. The unit price would likely find a hard floor at S$2.03 — the bottom of its 52-week range.
This bull case holds as long as the market price remains below the InvestingPro fair value of S$2.38 up to the July 27 2026 earnings announcement.
The 3 Red Flags — The Bear Case
Red Flag 1: Your Retirement Income Is At Risk Before the Yield Even Clears the Hurdle
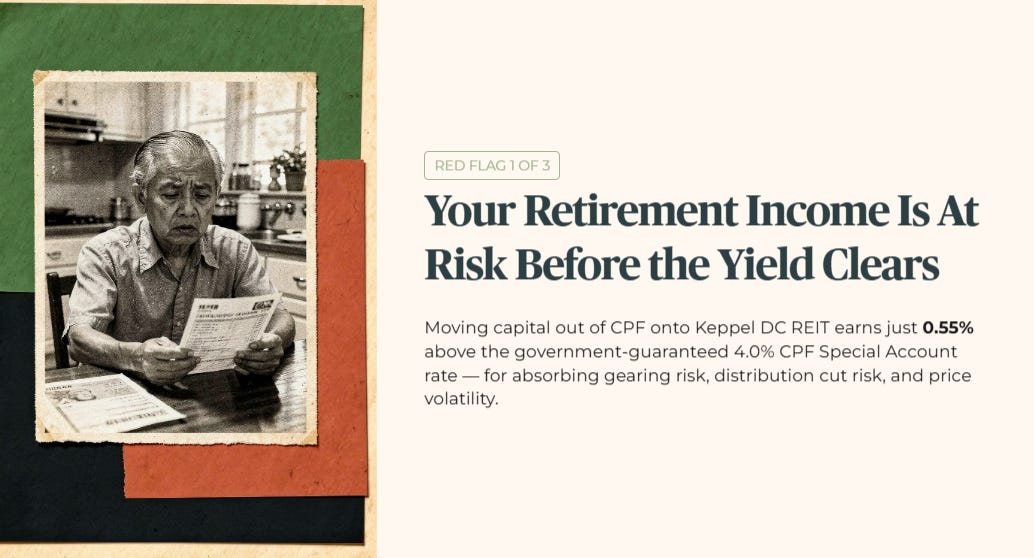
Here is what the yield miss means for your money before we even look at a number. A Singaporean investor moving capital out of CPF to buy Keppel DC REIT is stepping off a guaranteed 4.0% CPF Special Account return — backed by the Singapore government — and onto an equity asset that pays 4.55%. The additional return for absorbing gearing risk, distribution cut risk, and price volatility is just 0.55%. That is a very thin reward for a very significant step up in risk.
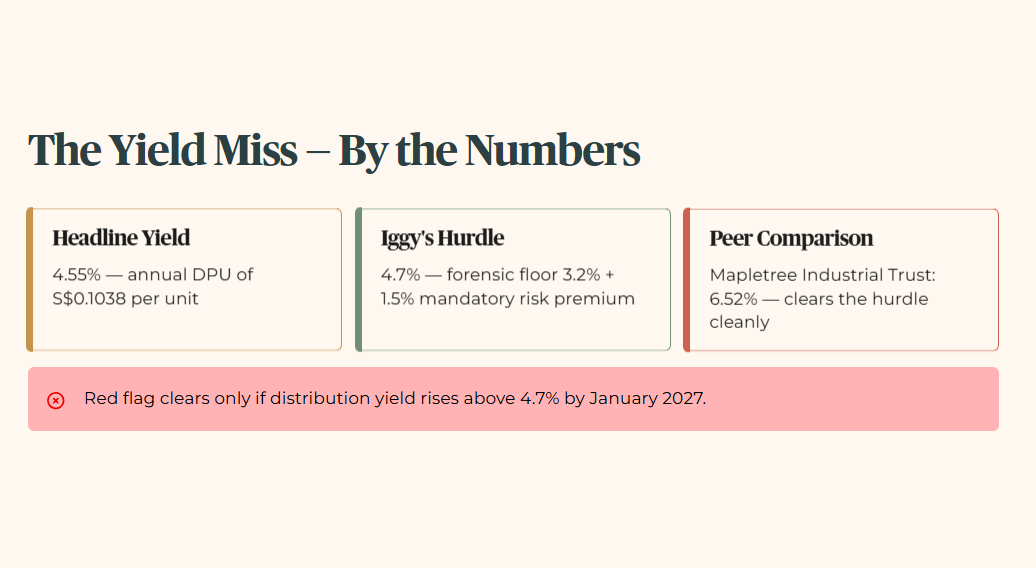
The headline yield is 4.55%, based on an annual distribution of S$0.1038 per unit. That fails my mandatory minimum yield hurdle of 4.7% — the income threshold I require before any stock qualifies for a retirement portfolio. My hurdle is calculated as the 3.2% forensic floor plus a 1.5% mandatory risk premium for taking on equity exposure.
The five-year median dividend yield for this REIT is 4.35%. The current yield is marginally higher than its own history, but it remains uncompetitive against the sanctuary benchmark. Mapletree Industrial Trust offers 6.52% and clears the hurdle cleanly. The yield shortfall here is real, and it matters most for investors who need their money to work immediately.
This red flag clears only if the distribution yield rises above 4.7% by the January 2027 distributions.
Red Flag 2: Debt Level Sitting at the Ceiling — One Acquisition Away From Zone 4
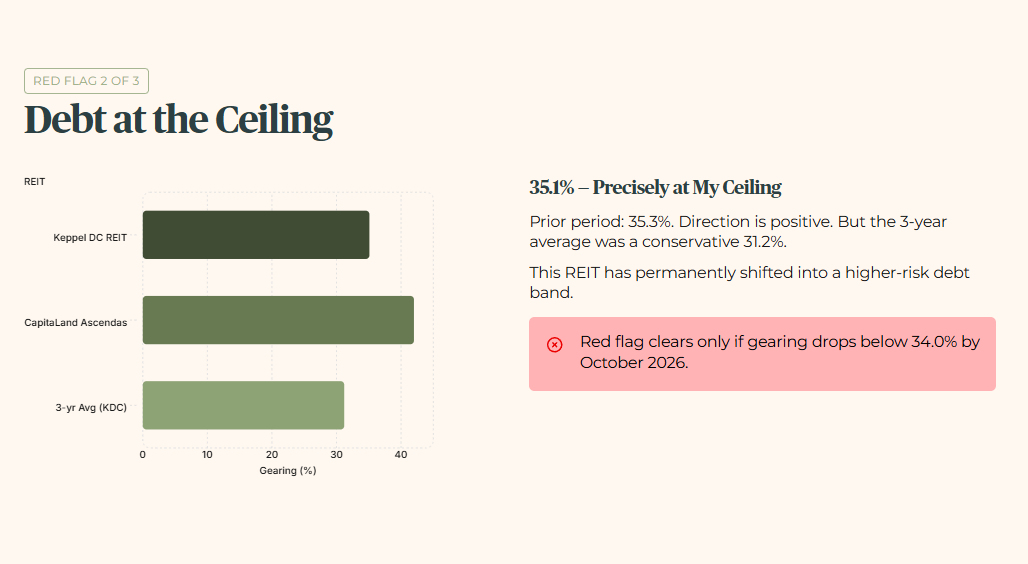
The aggregate leverage — the proportion of total assets funded by borrowed money — stands at 35.1% as of Q1 2026. That sits precisely at my 35% forensic ceiling. The prior period was 35.3% for FY2025, so the directional movement is positive. But the three-year historical average was a conservative 31.2%. This REIT has permanently shifted into a higher-risk debt band.
The peer context makes this more sobering, not more reassuring. CapitaLand Ascendas REIT — often cited as the benchmark for large diversified REITs — has aggregate leverage at 42.0% following recent acquisitions, expected to improve to 37.3% only after a completed equity fundraising. Even the sector’s anchor names are feeling the debt pressure. Keppel DC REIT at 35.1% is directionally better than that peer, but it is still at the boundary of safe territory.
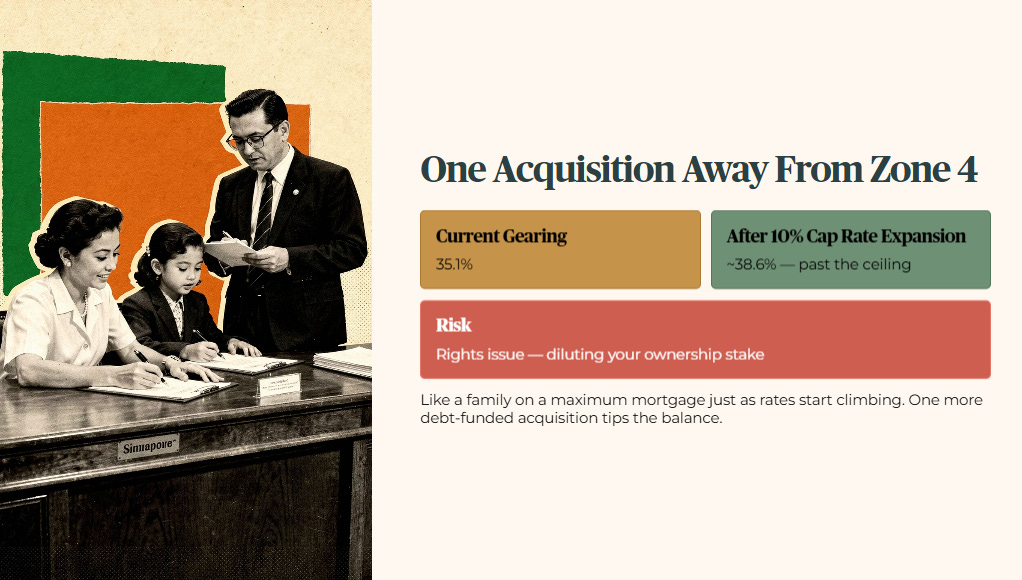
Stress-test this. If property cap rates expand 10% across its European data centre portfolio, asset values fall. That pushes leverage from 35.1% to approximately 38.6%. Think of it like a family who has taken on a maximum mortgage just as interest rates start climbing. One more debt-funded acquisition pushes Keppel DC REIT past my ceiling entirely — raising the risk of a rights issue, where the REIT sells new units to existing investors to raise cash, diluting your ownership stake in the process.
This red flag clears only if aggregate leverage drops below 34.0% by the October 2026 quarterly update.
Red Flag 3: Unitholder Dilution Running at an Aggressive Rate
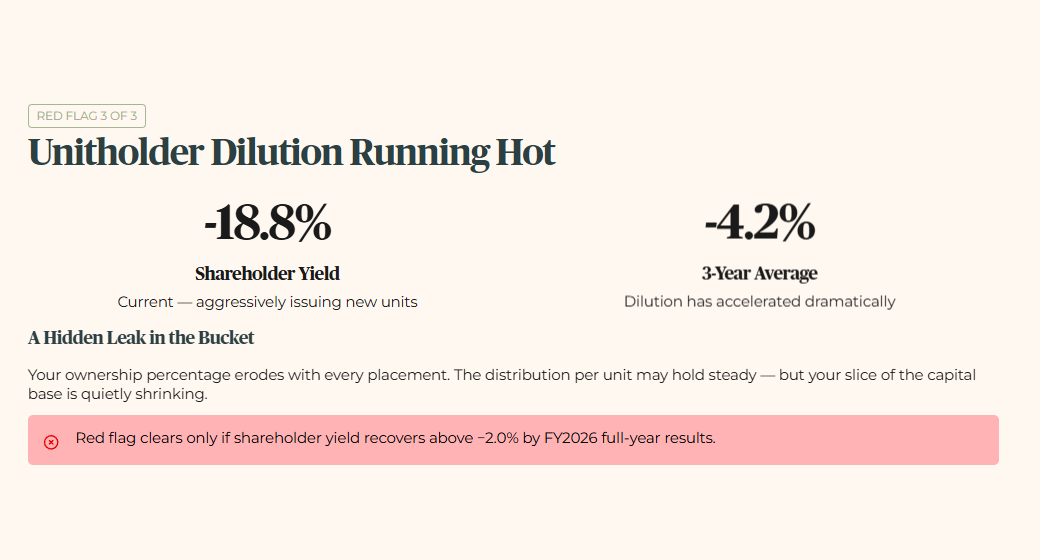
The shareholder yield — a measure of whether a company is returning capital to investors or eroding their ownership through new unit issuance — has collapsed to negative 18.8%. A healthy income asset should carry a positive or flat reading. Negative 18.8% means the REIT is aggressively issuing new units to fund its expansion. Your ownership percentage is being eroded with every placement.
The three-year historical average for this metric was negative 4.2%. The current pace of dilution has accelerated dramatically. Standard market data sources do not provide a unified shareholder yield metric across peers for direct comparison, but the directional picture is unambiguous: negative 18.8% is not normal for a retirement-grade income asset, and it is not a rounding error.
For a retail investor holding this for long-term compounding, this is a hidden leak in the bucket. The acquisition growth story looks compelling on paper, but it is being funded by constantly diluting your ownership. The distribution per unit may hold steady while the number of units outstanding keeps rising — meaning the total capital base is growing, but your slice of it is quietly shrinking.
This red flag clears only if shareholder yield recovers to better than negative 2.0% by the FY2026 full-year results.
🦎 Iggy’s Insight Block 1
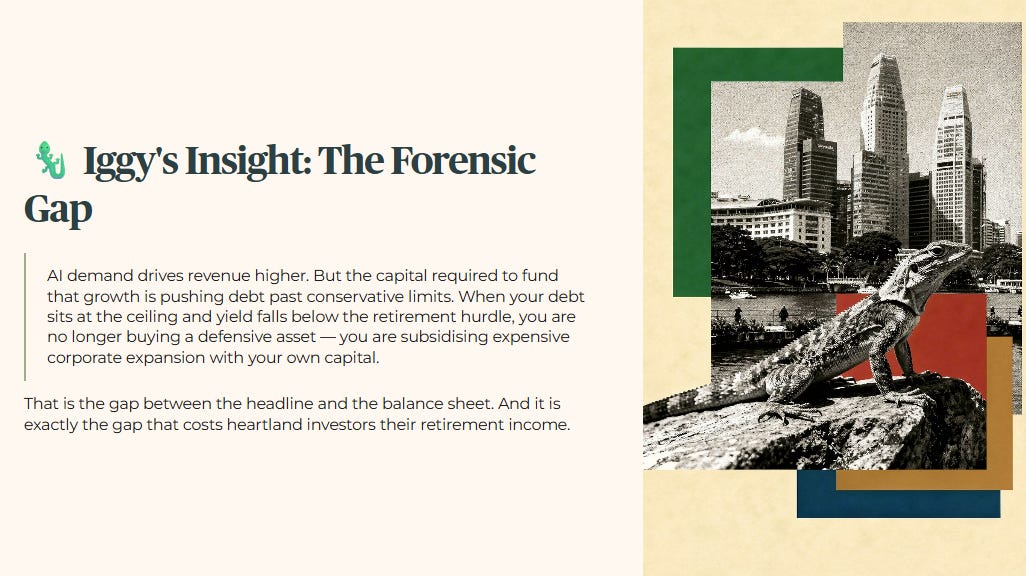
Keppel DC REIT is a classic Forensic Gap. The structural tailwinds from AI are real, but they conceal balance sheet stress that the headline numbers do not surface. AI demand drives revenue higher. But the capital required to fund that growth is pushing debt levels past conservative limits.
Institutional analysts celebrate the 42.2% revenue jump. They focus on the data centre story. As a forensic auditor, I look at how that growth is paid for. When your debt level sits at the ceiling and your yield falls below the retirement hurdle, you are no longer buying a defensive asset. You are using your own capital to subsidise expensive corporate expansion. That is the gap between the headline and the balance sheet — and it is exactly the gap that costs heartland investors their retirement income.
The Singaporean Context — The Stress-Test
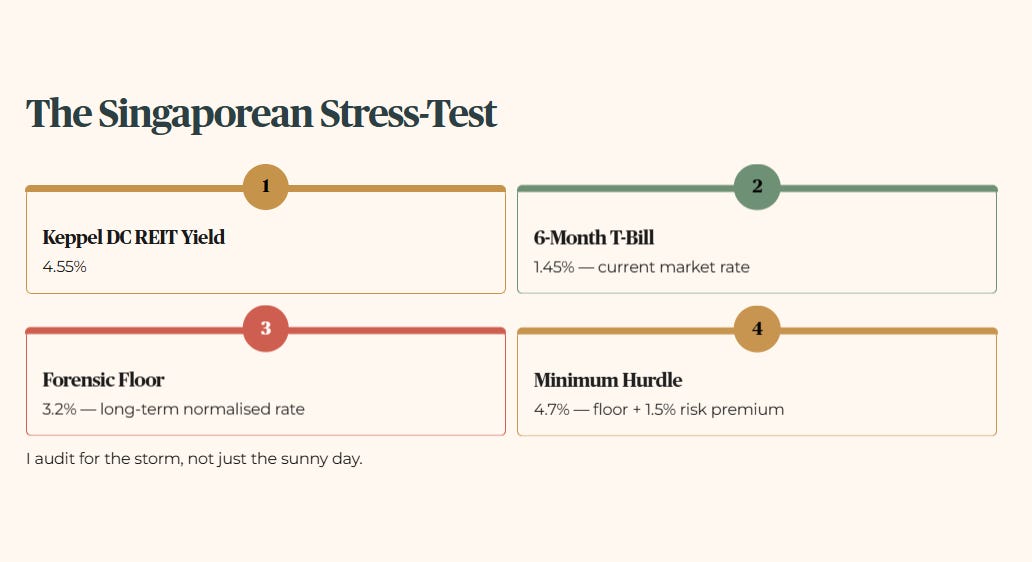
To understand your true risk-adjusted return, we need to calculate the equity risk premium — the additional return you earn above a risk-free government rate — on offer here. Take Keppel DC REIT’s dividend yield of 4.55% and subtract the current 6-month Singapore T-Bill yield of 1.45%. That gap is what you are earning for stepping off government paper and onto an equity asset.
A note on my stress-test approach. I apply a conservative forensic floor of 3.2% regardless of where the T-Bill sits on any given day. The T-Bill at 1.45% reflects current market conditions. My floor reflects the long-term average where rates will eventually normalise. I audit for the storm, not just the sunny day. The minimum yield hurdle remains 4.7% — the 3.2% floor plus a 1.5% mandatory risk premium.
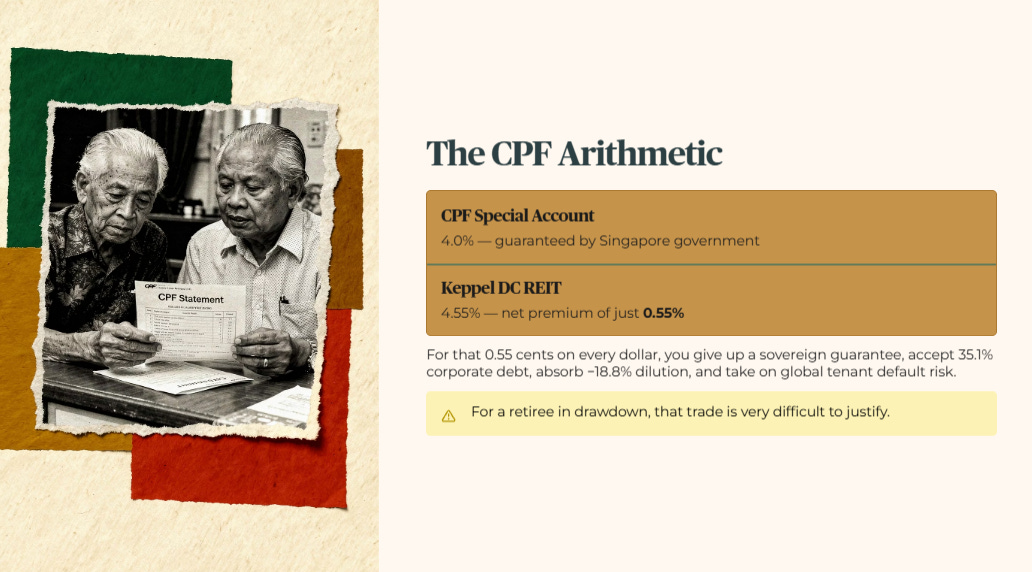
Now place this against the sanctuary benchmark: the CPF Special Account, which pays 4.0% guaranteed by the Singapore government. Keppel DC REIT delivers a net premium of just 0.55% above that guaranteed rate. For capital inside the CPF system, the arithmetic is uncomfortable. You are giving up a sovereign guarantee, accepting a 35.1% corporate debt ratio, absorbing negative 18.8% unitholder dilution, and taking on global tenant default risk — for an additional 0.55 cents on every dollar. For a retiree in drawdown, that trade is very difficult to justify.
The equity risk premium arithmetic you have just seen clears the floor on paper — but the dividend trajectory and peer comparison in the next section decide whether Keppel DC REIT truly earns a place in a retirement‑grade portfolio.
