

Keppel DC REIT Q1 Performance Forensic Audit: 35.1% Gearing
Beyond the AI hype, the WALE by income is shrinking. We audit the numbers management didn't highlight in the slides.

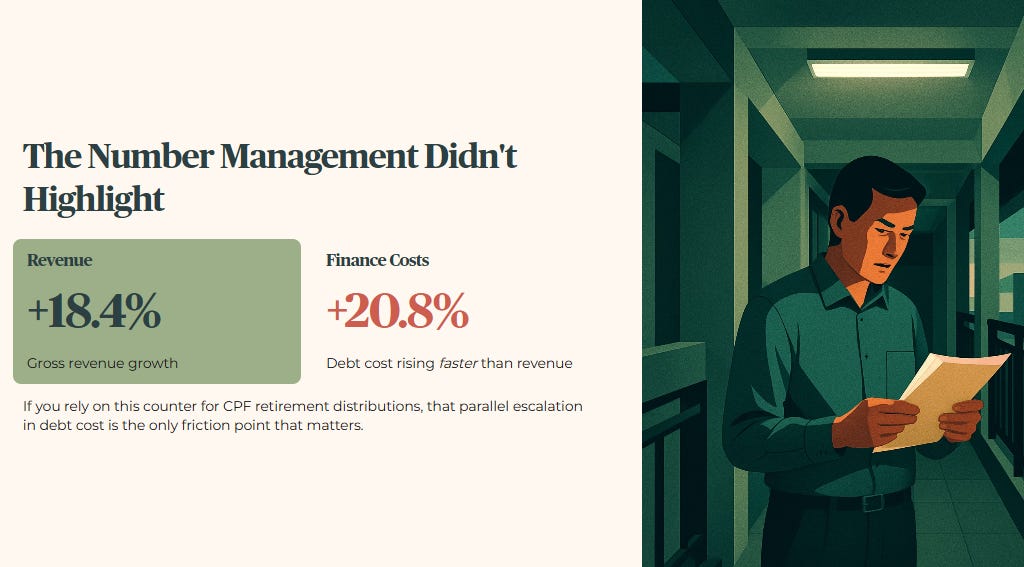
Revenue is up 18.4 percent, but finance costs have quietly surged by an uncomfortable 20.8 percent in the same reporting period. If you are relying on this counter to fund your CPF retirement distributions, that parallel escalation in debt cost is the only friction point that matters. Here is the forensic audit revealing what the management presentation obscured about your actual dividend sustainability.


In This Article:
The Slide-by-Slide Audit: Revenue and DPU Realities
The Balance Sheet and Gearing Breach
Operational Choke Points and Tenant Concentration
The AI Mirage vs Structural Reality
The Reality Check
The Scorecard and Yield Spread
The Forward Outlook
Iggy’s Bottom Line
Iggy’s Forensic Compliance Standards — Standard Disclaimer
The Slide-by-Slide Audit: Revenue and DPU Realities
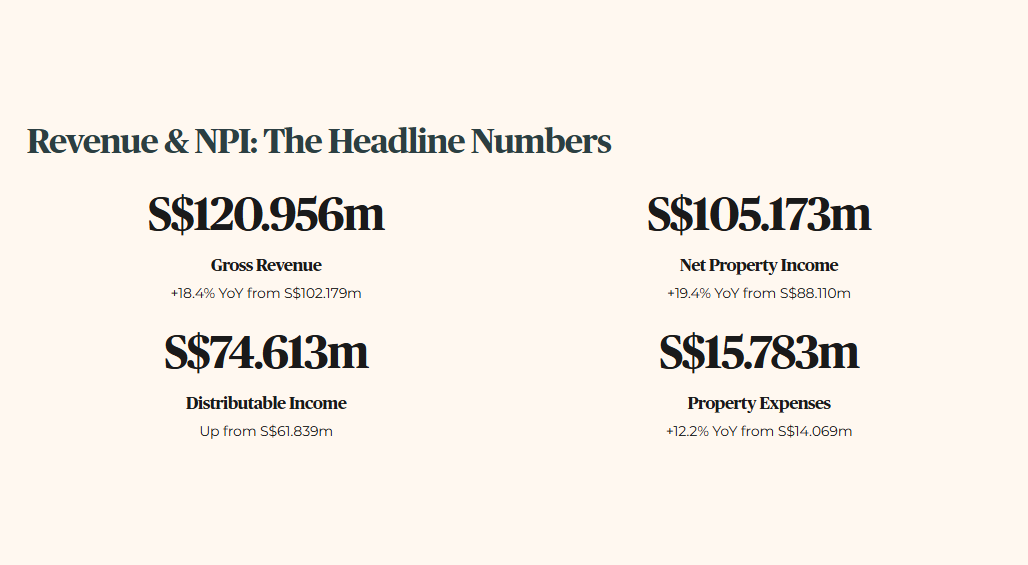
Management is aggressively promoting a gross revenue figure of S$120.956 million for the first quarter of 2026. This is an 18.4 percent increase from S$102.179 million in the same quarter last year. Property expenses crept up 12.2 percent to S$15.783 million, from S$14.069 million. Net property income settled at S$105.173 million, growing 19.4 percent year-on-year from S$88.110 million. Distributable income grew to S$74.613 million, up from S$61.839 million.
The raw distribution per unit is 2.833 cents. For the uninitiated, Distribution Per Unit (DPU) is the exact cash payout allocated to each share you own. It is the ultimate lifeblood metric for any income-focused heartland investor. This 2.833 cents payout passes our initial health check, representing a 13.2 percent year-on-year increase from 2.503 cents.
What does this mean for you? If you are a 55-year-old uncle holding exactly 10,000 units in your Supplementary Retirement Scheme account, that translates to a reliable S$283.30 quarterly distribution.
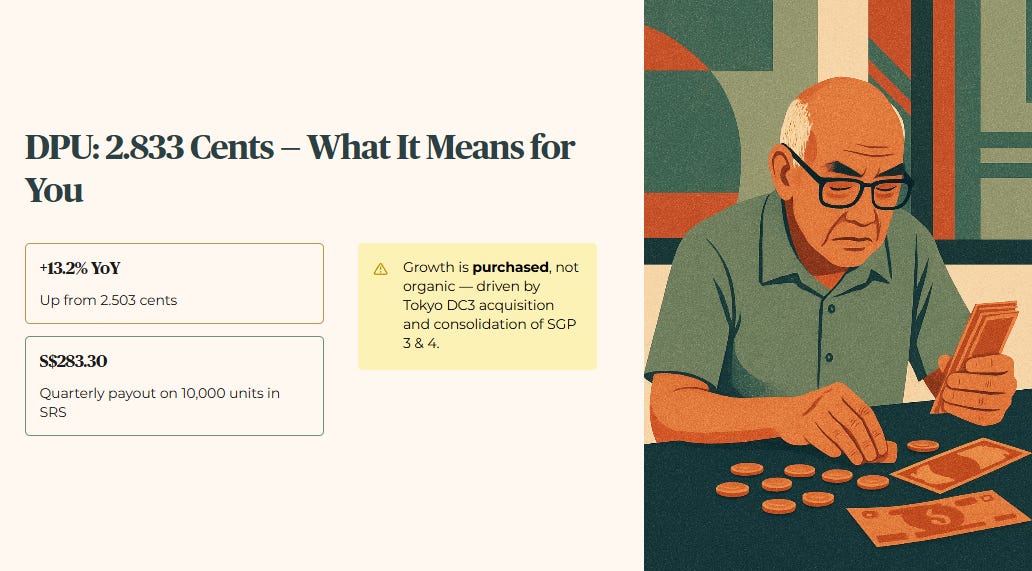
However, we must aggressively question how they engineered this uplift. The revenue bump is largely attributed to the outright acquisition of Tokyo Data Centre 3 and the consolidation of the remaining interests in Keppel DC Singapore 3 and Singapore 4. This is not purely organic rent growth. It is purchased growth via the balance sheet.
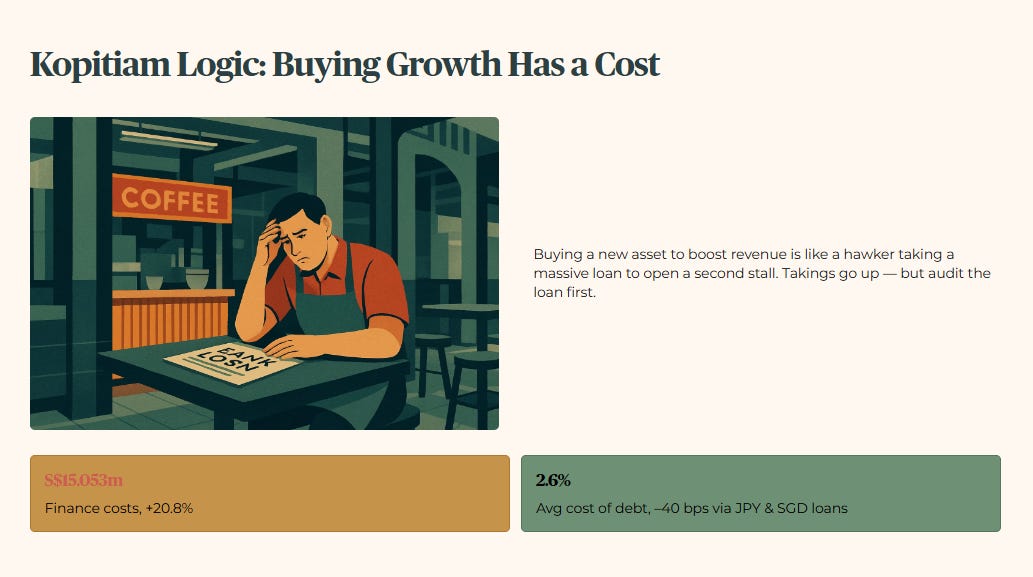
Let us apply basic Kopitiam Logic here. Buying a new asset to boost gross revenue is exactly like a hawker taking out a massive bank loan to buy a second stall to sell more chicken rice. Yes, your total daily takings will go up. But you must immediately audit the bank loan you took to purchase that second stall. Finance costs skyrocketed to S$15.053 million, up from S$12.457 million. That is a 20.8 percent jump in raw interest expense. Finance income dropped slightly to S$3.811 million from S$3.855 million. The Manager claims an average cost of debt of 2.6 percent, an improvement of 40 basis points, largely achieved by drawing down Japanese Yen and Singapore Dollar loans.
The Balance Sheet and Gearing Breach
Now we strip down the balance sheet. Aggregate leverage sits at exactly 35.1 percent. Gearing or Aggregate Leverage is the ratio of a REIT’s total debt to its total property assets. It is the primary gauge of bankruptcy risk and balance sheet weight. The raw fact is that aggregate leverage is 35.1 percent, down 20 basis points from 35.3 percent in December 2025. Historically, this REIT enjoyed a pristine low-30s gearing profile, averaging around 32 percent over the past five years. Crossing the 35.0 percent threshold means they are operating with a significantly heavier backpack than their own historical standard.

Looking at peer context, a broad industrial player like Mapletree Industrial Trust frequently operates around 37.2 percent and passes its sector threshold. However, Keppel DC REIT is a pure-play digital infrastructure operator with massive tenant concentration. That means it fails my strict 35.0 percent forensic ceiling for this specific asset class.
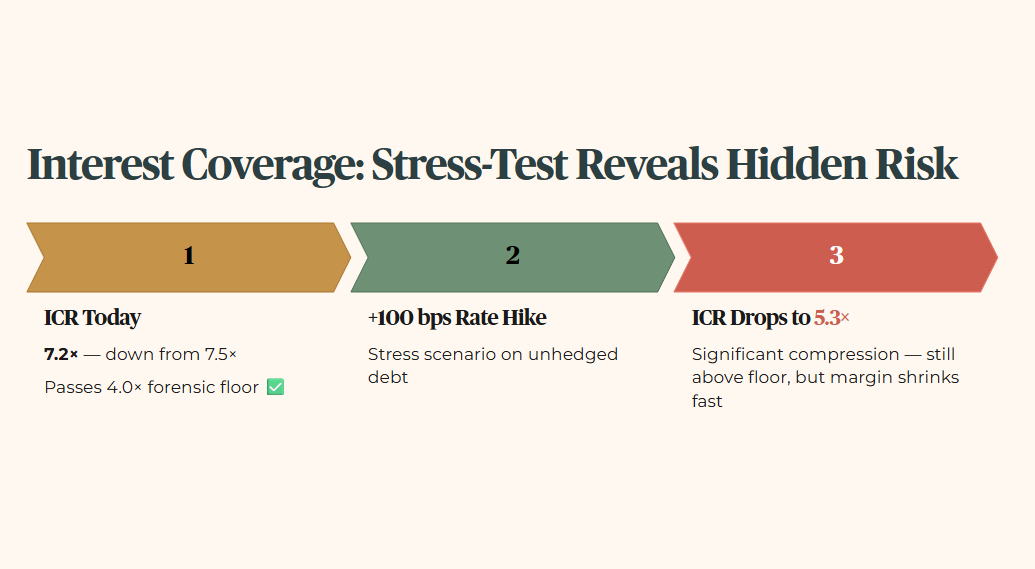
We must apply a forward stress scenario. The Interest Coverage Ratio (ICR) stands at 7.2 times, down slightly from 7.5 times. ICR measures how many times a company’s operating profit can pay its current interest obligations. A ratio of 7.2 times easily passes our 4.0x forensic floor. However, if we run a stress scenario where the Federal Reserve triggers a 100 basis points increase in benchmark interest rates, that ICR drops severely from 7.2 times to 5.3 times on unhedged debt.
The wallet impact for a 60-year-old Singaporean relying on this for passive income is severe. The Manager’s debt headroom is capped at approximately S$550 million before hitting their internal 40 percent ceiling.
The 7.2 times Interest Coverage Ratio still clears our 4.0x floor today — but once you overlay the 35.1 percent gearing breach against the WALE-by-income rollover schedule in the next section, the true stress point for your dividend stream looks very different.
