




MIT’s 7.0% Yield Clears My Hurdle. Its Balance Sheet Fails Two Tests and Sits on a Third 🦖
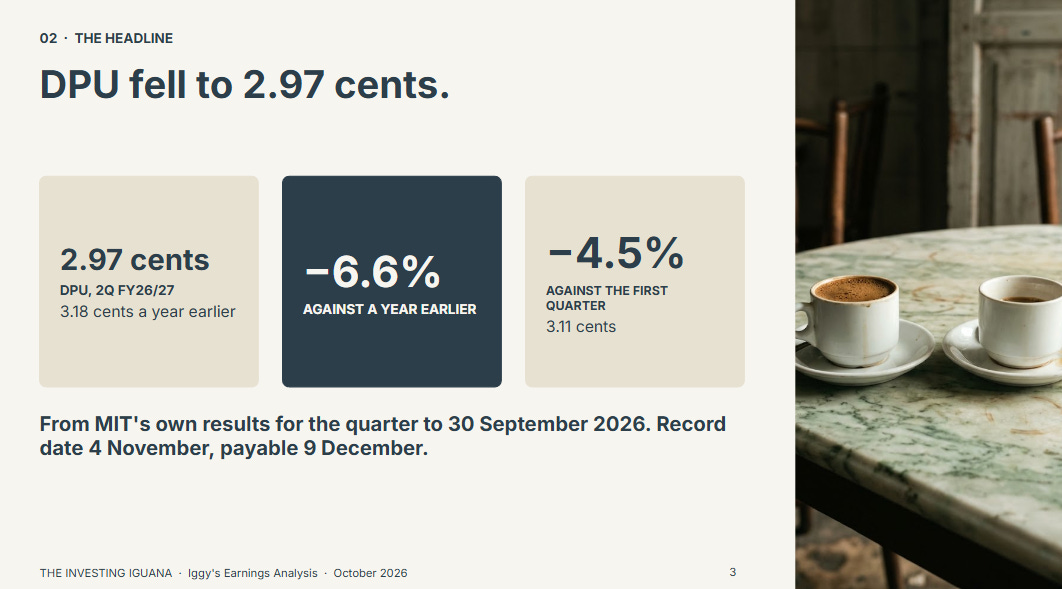
DPU fell 6.6% to 2.97 cents against a year earlier. Leverage is 37.7% against my 35% ceiling, and interest cover is 4.0x again, exactly on my floor.
Mapletree Industrial Trust (MIT) paid 3.18 cents a unit for the quarter to September 2025, and has just declared 2.97 cents for the same quarter this year, a fall of 6.6%. At SGD 1.79, the last four payments still give a trailing yield of 7.01%. Both numbers come from MIT’s own filings, and they point in different directions.
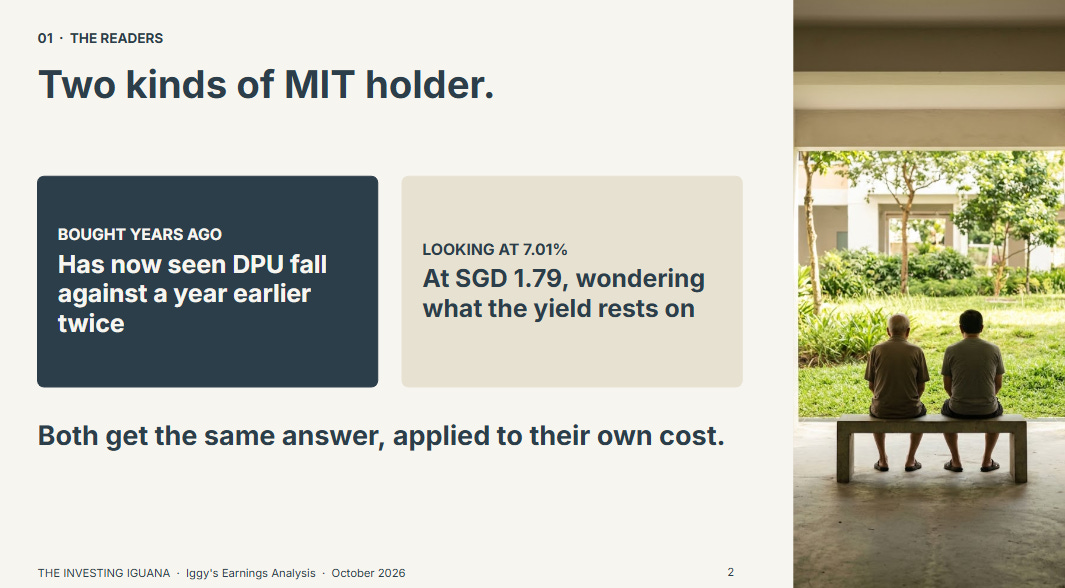
If you own MIT, you have now seen the distribution fall against a year earlier two quarters running, and you are owed an account of what sits behind it. If you are looking at the units for the first time, the yield looks generous and the price sits near the bottom of its 52-week range, so it helps to know what the yield rests on. You are both reading the same results, so I will stay with the filings. I am not telling either of you what to do.
What This Piece Does
It sets out what MIT’s second-quarter results say about income and the distribution, what the company gives as the reasons, and where the vacancy sits.
It shows how the yield tests against my hurdle and what the payout looks like in a table by quarter.
It shows how MIT tests against my other thresholds, what happened to leverage when the perpetual securities were redeemed, and what I will watch next.
The first part is free. The balance sheet, the tests that set the label, the comparison with two other REITs and my closing read are in the paid half.
No view on share price direction. Nothing here is a recommendation.

What This Piece Does
What the Results Say
Where the vacancy sits
Iggy’s Insights
Where MIT Sits on My Framework
What the Payout Looks Like at SGD 1.79
What the Paid Half Adds
What the Balance Sheet Carries
Where the Tests Land
Legacy Holders vs. Fresh Capital
What I Would Watch Next
Iggy’s Forensic Read
Sources
What the Results Say
Revenue edged up and the distribution still fell
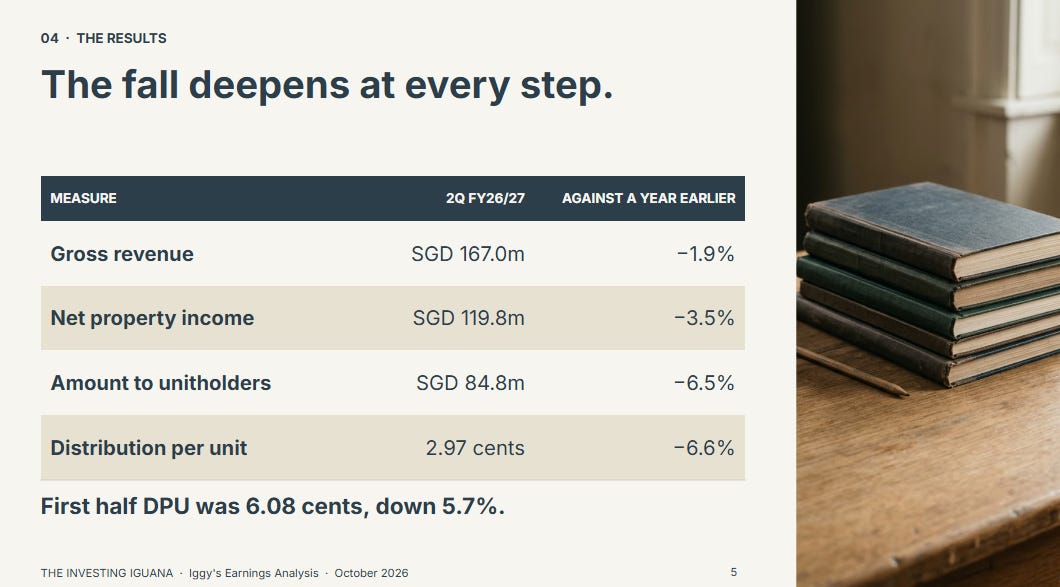
MIT published its results for the second quarter of FY2026/27, the three months to 30 September 2026, on the evening of 27 October. Gross revenue was SGD 167.0 million, 2.9% higher than the first quarter and 1.9% lower than a year earlier. Net property income was SGD 119.8 million, 2.1% lower than the first quarter and 3.5% lower than a year earlier. The amount available to unitholders was SGD 84.8 million, down 6.5% on the year, and distribution per unit (DPU) was 2.97 cents, down 4.5% on the first quarter’s 3.11 cents and 6.6% on the 3.18 cents of a year earlier. For the half year, DPU was 6.08 cents against 6.45, a fall of 5.7%.
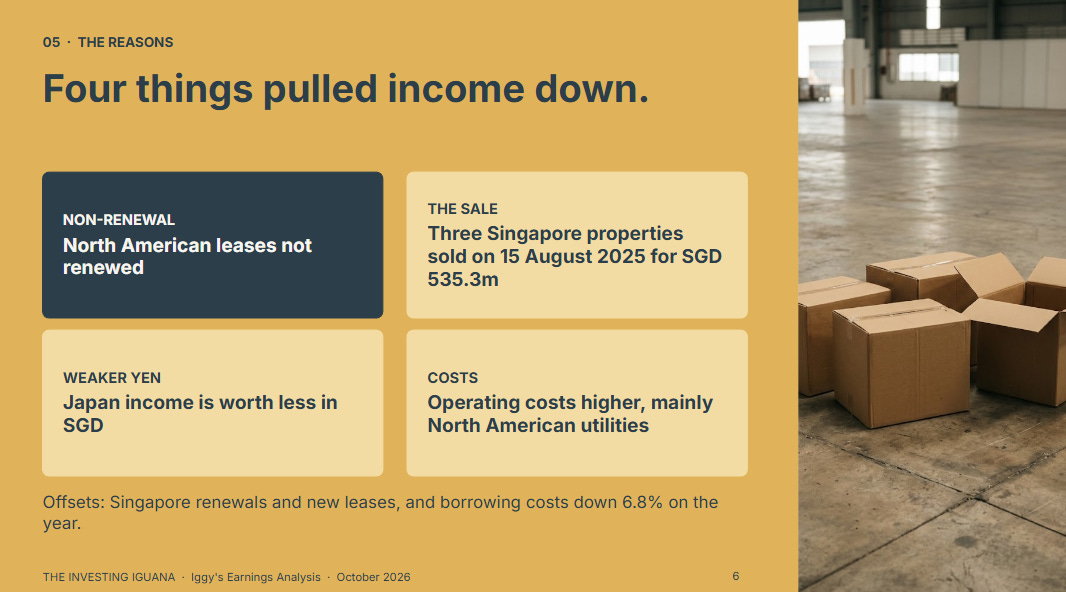
The company gives four reasons. Contributions from the North American portfolio fell because some leases were not renewed, and operating costs rose. The yen weakened against the Singapore dollar, which lowers the Japan portfolio’s income in Singapore dollars.
Three Singapore industrial properties sold on 15 August 2025 for SGD 535.3 million no longer contribute income. Renewals and new leases in Singapore offset part of this. Borrowing costs fell 6.8% on the year to SGD 20.2 million, because sale proceeds repaid debt and floating rates were lower. Cash distributed by the North American data centre joint venture rose 13.1% to SGD 6.0 million, which the company ties to utility credits and rent escalations.
Compared with the first quarter, borrowing costs rose 9.1%. The company says interest rate swaps that had been locked in at lower rates matured and were replaced at higher ones, and that the saving from temporarily repaying loans with new perpetual securities proceeds ended. I will come back to that second point in the paid half.
Where the vacancy sits
Portfolio occupancy was 89.7% at 30 September, down from 90.7% at 30 June. The fall is almost all in North America.
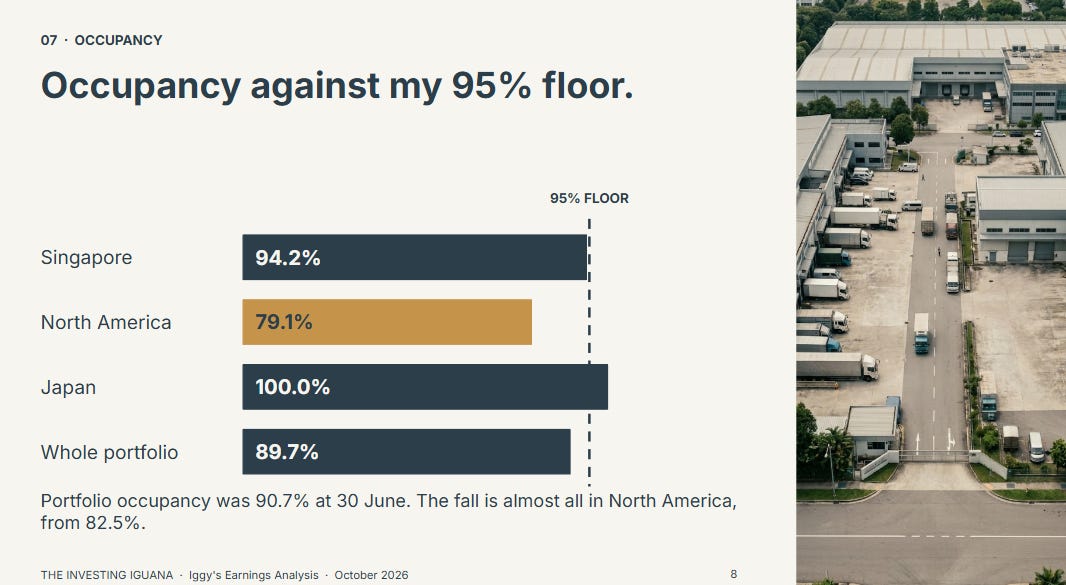
Source: MIT results presentation, 27 October 2026. The data centre and North American figures include MIT’s 50% interest in the joint venture with Mapletree Investments.
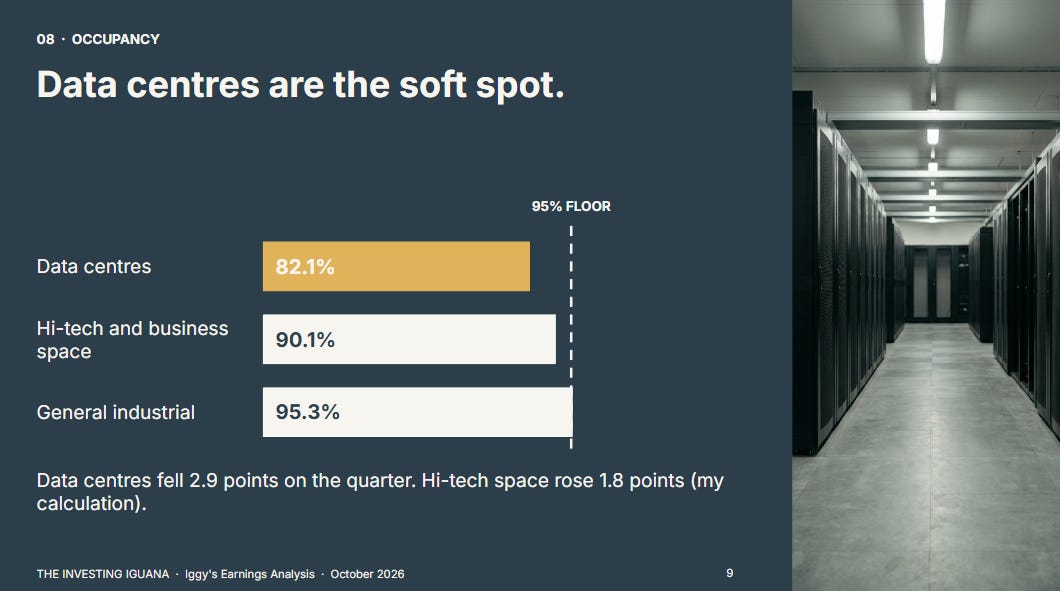
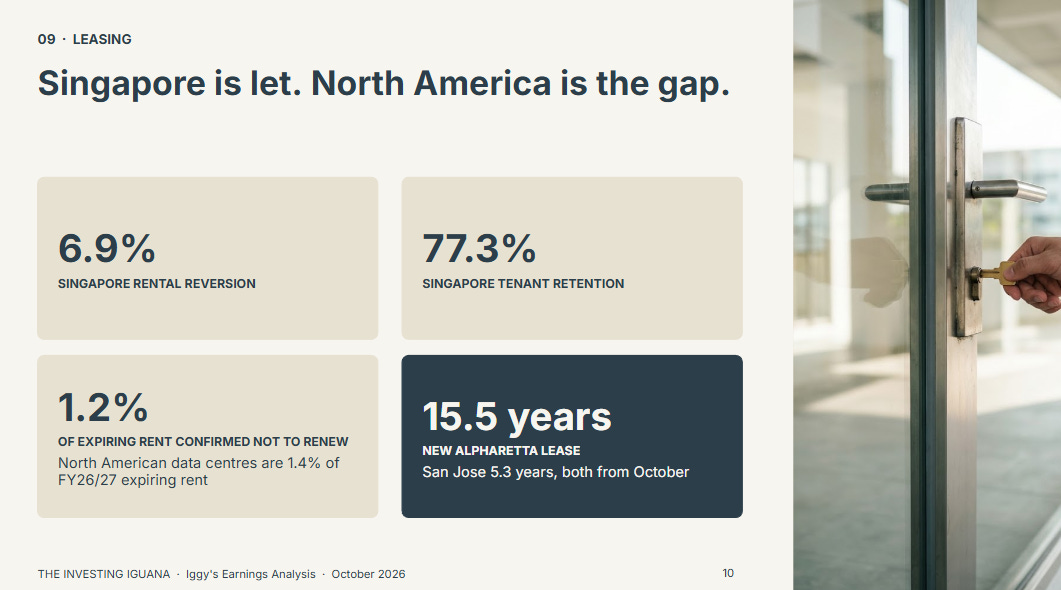
Picture a hawker centre with two wings. The Singapore wing is nearly full, and about one stall in five stands empty in the American wing. In Singapore, rents on renewed leases rose 6.9% and the tenant retention rate was 77.3%. In North America, the company cites a lease that was not renewed as a drag on income. North American data centres make up about 1.4% of the rent from leases expiring in FY2026/27, and tenants representing 1.2% of expiring rent have confirmed they will not renew. After the quarter ended, MIT signed a 15.5-year lease at its Alpharetta, Georgia data centre and a 5.3-year lease at San Jose, California, both starting in October. MIT also sold two small North American data centres this half: Philadelphia for USD 14.5 million in June and Eagan, Minnesota for USD 9.81 million at the end of September.
🦖 Iggy’s Insights
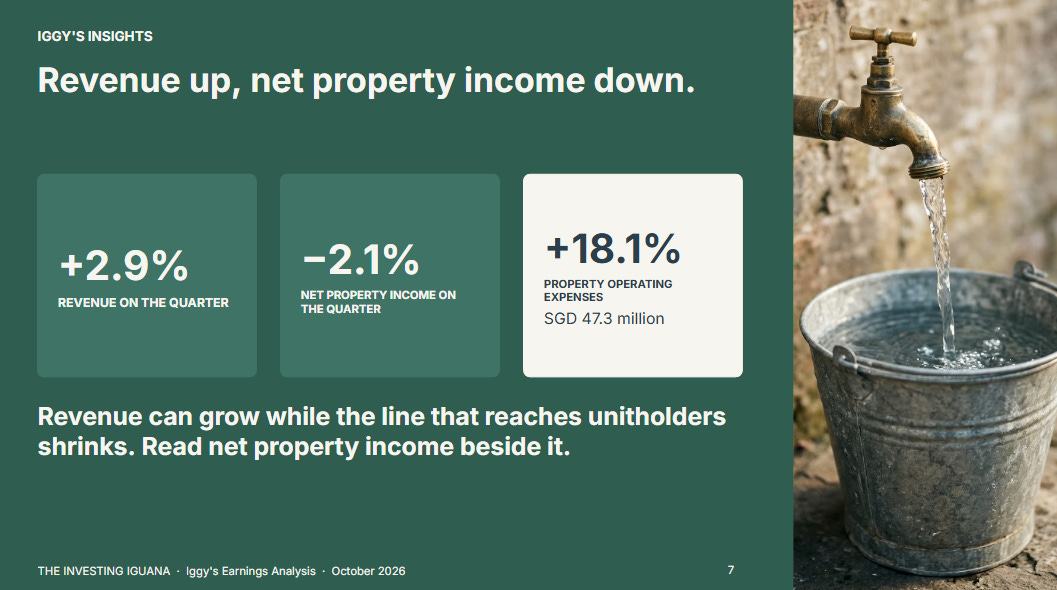
Revenue rose 2.9% on the quarter, and net property income fell 2.1%. The gap is operating costs. Property operating expenses rose 18.1% on the quarter to SGD 47.3 million, which the company attributes mainly to higher utility costs in North America. A revenue line that includes recovered utility income can grow while the line that reaches unitholders shrinks. When a REIT reports revenue growth, read the net property income line next to it, then ask which costs were passed on and which were not.
Where MIT Sits on My Framework
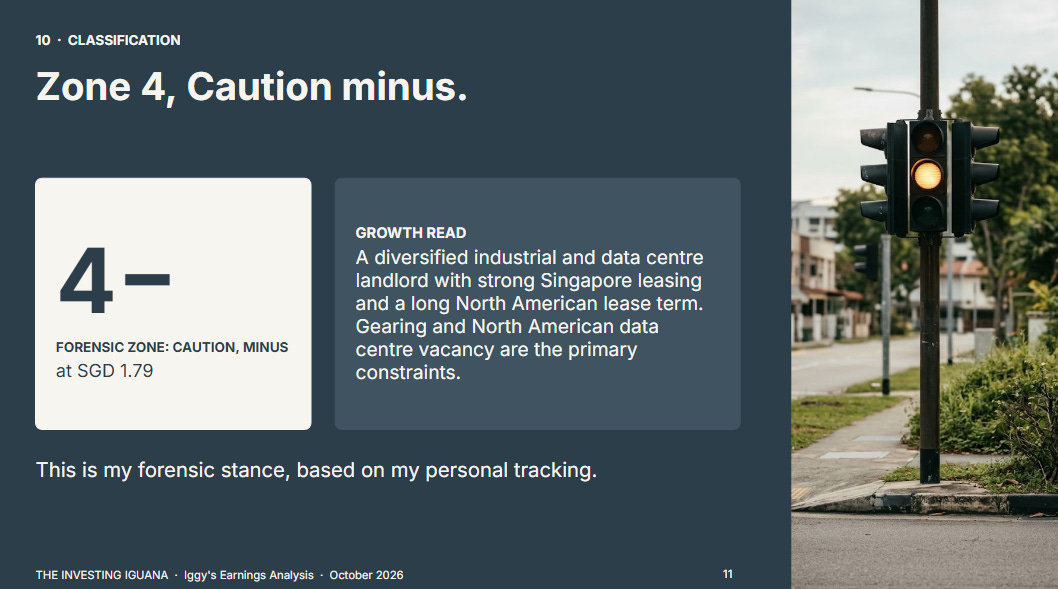
Iggy’s Forensic Zone: Zone 4, Caution - (Growth Read: a diversified industrial and data centre landlord with strong Singapore leasing and a long North American lease term, gearing and North American data centre vacancy are the primary constraints)
The zone reflects the 27 October results and will be recalculated against the price on the day I next cite it. Zone 4 describes how my framework is calibrated. It is not an instruction to anyone. The framework is built around a reader drawing income in retirement, so it applies fixed tests to every company. Someone with many years before drawdown may reasonably sit through the swings it is built to flag, and someone using money beyond what retirement income needs may reasonably hold a company to a different standard. The paid section shows which tests set the label and by how much.
What the Payout Looks Like at SGD 1.79
The price is SGD 1.79 on InvestingPro’s page as captured on the morning of 28 October. It appears to be the 27 October close, before the results came out, so prices since then may differ, and I will say so if I cite a later one. The units trade between SGD 1.72 and SGD 2.23 over 52 weeks, and about 10% above net asset value per unit of SGD 1.62 (my calculation).
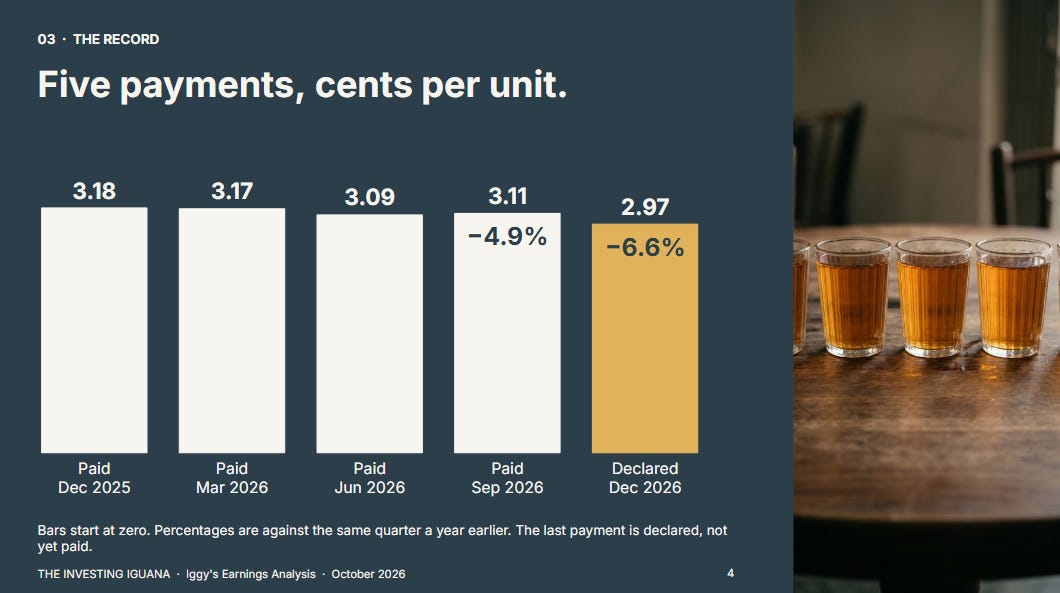
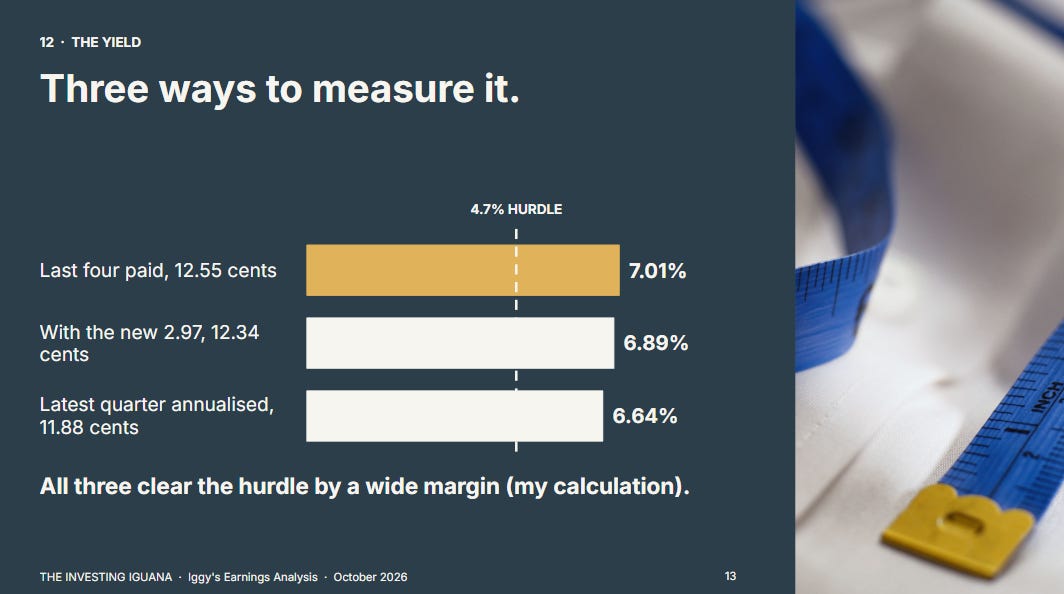
The last four quarterly payments were 3.18 cents (paid December 2025), 3.17 cents (March 2026), 3.09 cents (June 2026) and 3.11 cents (September 2026). That is 12.55 cents over the trailing twelve months, and at SGD 1.79 a yield of 7.01%, my arithmetic. It matches the 7.0% that InvestingPro displays. It clears my 3.2% forensic floor on yield and my 4.7% hurdle by 2.3 percentage points. It would equal the hurdle only at about SGD 2.67. If I count the newly declared 2.97 cents in place of the oldest payment, the figure is 12.34 cents and a yield of 6.89%. On the latest quarter annualised, 11.88 cents, the yield is 6.64%. All three bases clear the hurdle by a wide margin.
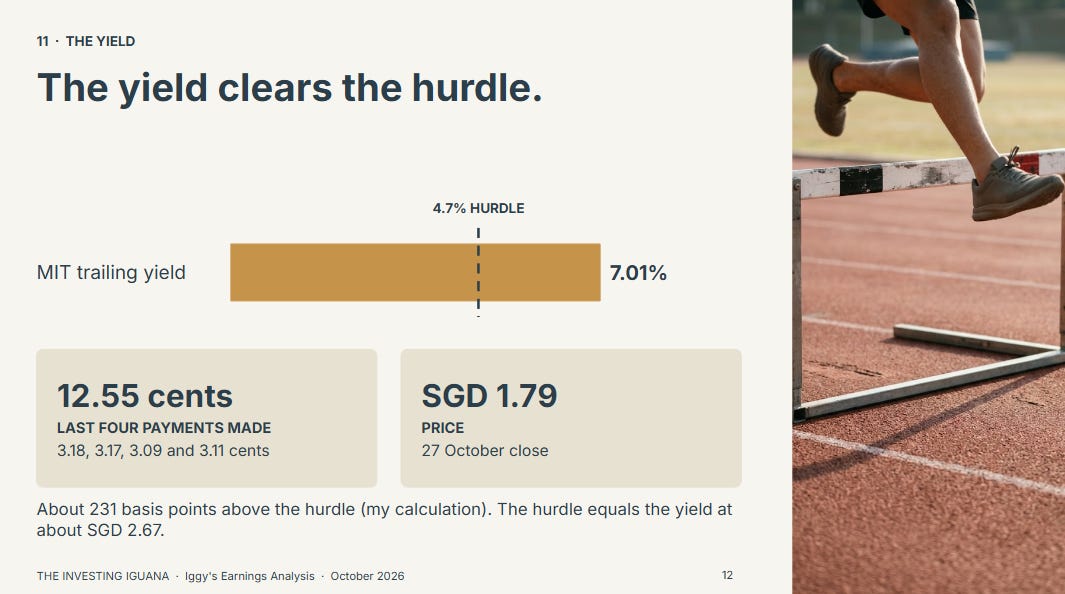
Source: InvestingPro dividend history (components summed per payment) and MIT’s results releases. The last row is declared, not yet paid. The record date is 4 November 2026.
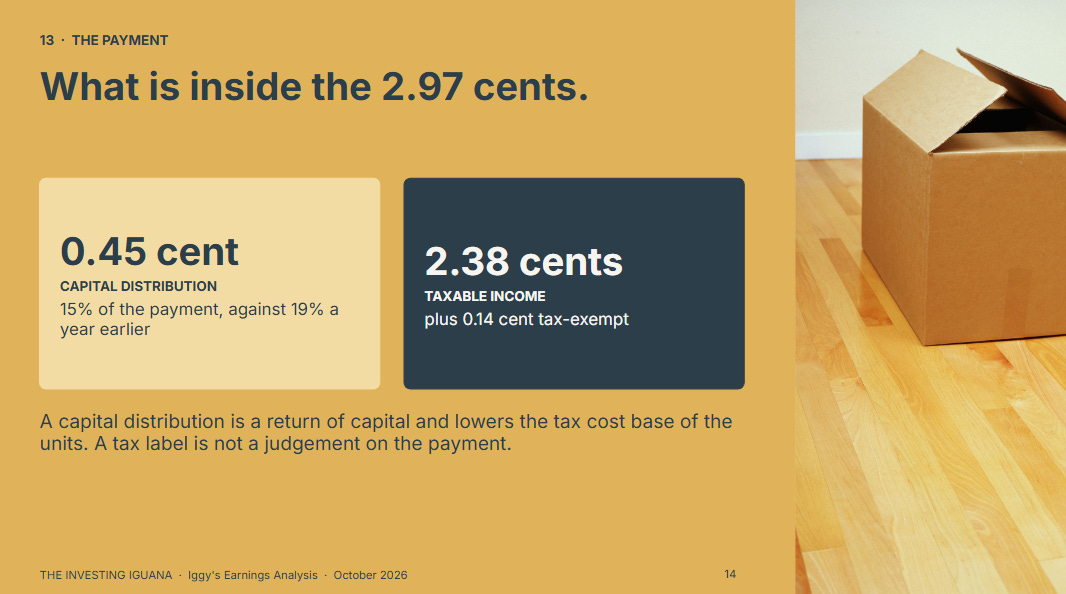
One feature of the 2.97 cents deserves a line. It is made up of 2.38 cents of taxable income, 0.14 cent of tax-exempt income and 0.45 cent of capital distribution, which is a return of capital and reduces the cost base of the units for tax purposes. The capital part is 15% of the payment. A year earlier it was 0.61 cent of 3.18, or 19%. A tax label is not a judgement on the payment, and it is worth knowing it is there when you compare yield figures.
What the Paid Half Adds
The free half has set out what the results say, where the vacancy sits, how the yield tests against my hurdle and where MIT sits on my framework. What it has not shown is why the label is what it is.
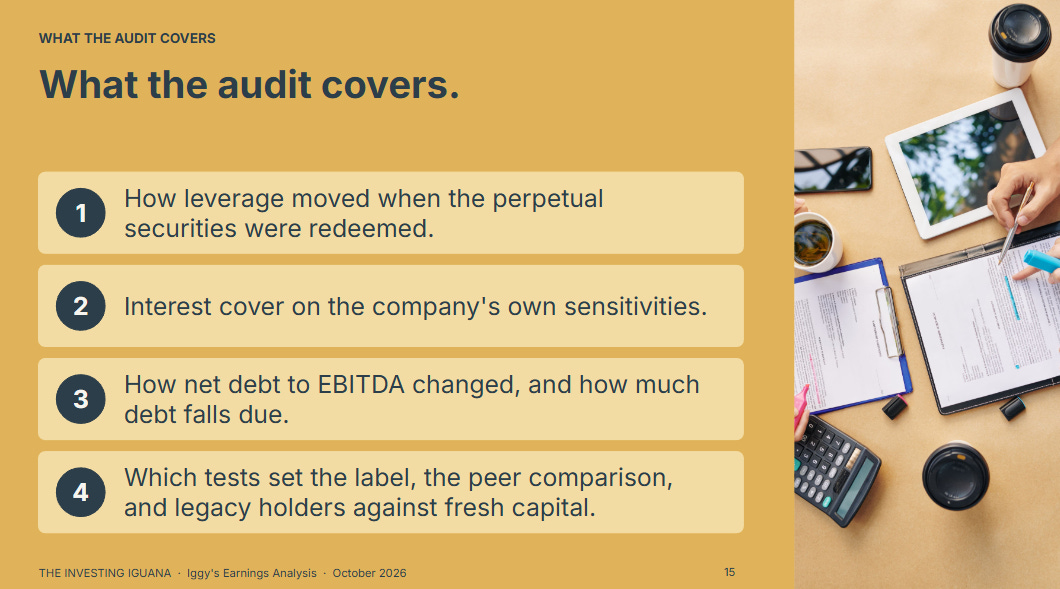
The paid half sets out how leverage moved when the perpetual securities were redeemed and why the 31 March figure was low, what interest cover looks like on the company’s own sensitivities, how net debt to EBITDA has changed, and how much debt falls due and when. It then shows which tests set the label and by how much, puts MIT beside two other REITs on the same tests, and works through what the payout means for someone who bought at a different price.
The Substack Only Plan, US$8 a month, gives you the full written analysis, the portfolio walkthroughs and the analyst cheatsheets.
The YouTube Only Plan, S$5 a month, gives you the full-length Members Edition video.
The YouTube/Substack Combo, S$12 a month, gives you all of it.
🔒 What’s Next
The 7.01% trailing yield clears my 4.7% hurdle by 2.3 points. The leverage and interest cover figures in the next section show why a yield that clears the hurdle does not settle the label.
