

NTT DC REIT - 7.5% Yield, Global Assets… So Why Is SG’s Biggest IPO Trading Like a Value Trap?
Here's the complete analysis of what went wrong and whether this discount represents a genuine opportunity or a warning sign for Singapore's REIT market.

Most investors expected NTT DC REIT's 7.5% yield and blue-chip backing to create instant demand, but two months later, the stock sits 4.5% below its IPO price while data center peers soar. Here's the complete analysis of what went wrong and whether this discount represents a genuine opportunity or a warning sign for Singapore's REIT market.
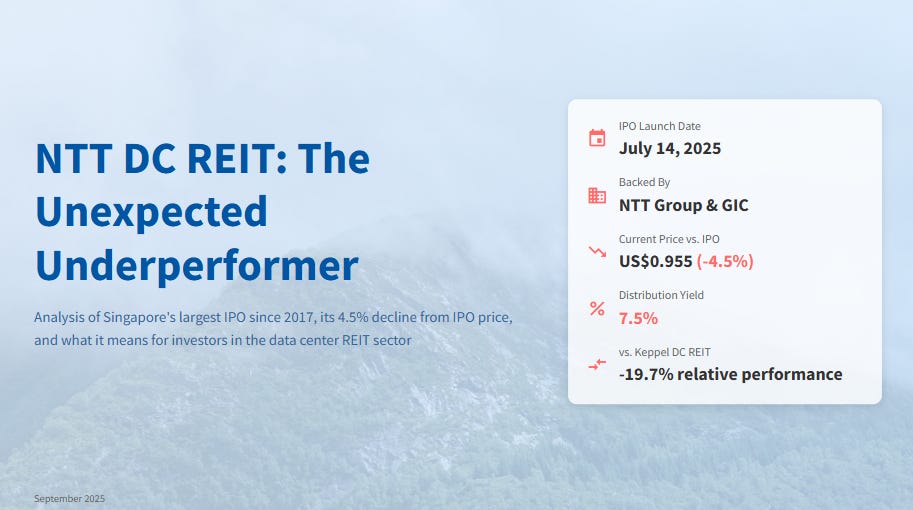
When NTT DC REIT launched on July 14, 2025, it carried all the hallmarks of a blockbuster IPO success story. Singapore's largest listing since 2017, backed by tech giant NTT Group and cornerstone investor GIC, promised a mouth-watering 7.5% distribution yield in a data center sector riding the AI wave. Yet today, two months after its debut, the REIT trades at US$0.955 – a stubborn 4.5% discount to its US$1.00 IPO price.
This performance stands in stark contrast to the data center narrative that has propelled competitors like Keppel DC REIT to 15% gains over three years, while NTT DC REIT's price action suggests investors remain unconvinced despite the compelling fundamentals. For Singaporean investors weighing this high-yield opportunity, understanding why this IPO stumbled and what it means for future returns has become critical.
The IPO That Couldn't Hold Its Ground
Initial Euphoria Meets Market Reality
NTT DC REIT's launch generated significant institutional interest, with the offering oversubscribed 4.6 times and GIC committing to a substantial 9.8% stake. The REIT briefly touched US$1.03 on its first trading day before quickly retreating to the IPO price. This initial pop-and-drop pattern set the tone for what would become a prolonged period of price weakness.
The subsequent price action tells a story of systematic selling pressure. By the end of the first trading week, the stock had declined 5% to US$0.95. Throughout August, it continued drifting lower, occasionally touching US$0.93-0.94 levels, suggesting weak retail demand despite strong institutional backing.
Table: NTT DC REIT Price Performance Since IPO
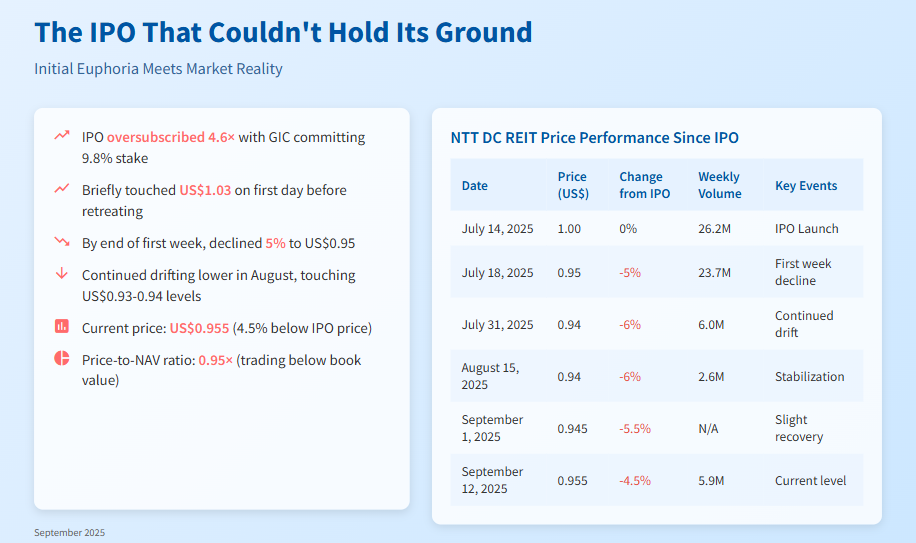
This table tracks NTT DC REIT's share price from launch through September. The key point: the REIT never gained traction post-listing and is still down nearly 5% from IPO price. Volume also fell sharply after initial trading, a sign of limited investor enthusiasm.
Current Market Position
As of September 12, 2025, NTT DC REIT trades at US$0.955 with daily volumes around 5.9 million units. This represents a price-to-NAV ratio of approximately 0.95x, making it one of the few data center REITs trading below book value. The discount becomes more pronounced when compared to regional peers trading at significant premiums to NAV.
Competitive Landscape Analysis: Where NTT DC REIT Stands
The Data Center REIT Pecking Order
Singapore's data center REIT landscape reveals stark performance differences that help explain NTT DC REIT's struggles. The market currently features four main players with varying degrees of data center exposure.
Table: Singapore Data Center REITs Comparison (September 2025)
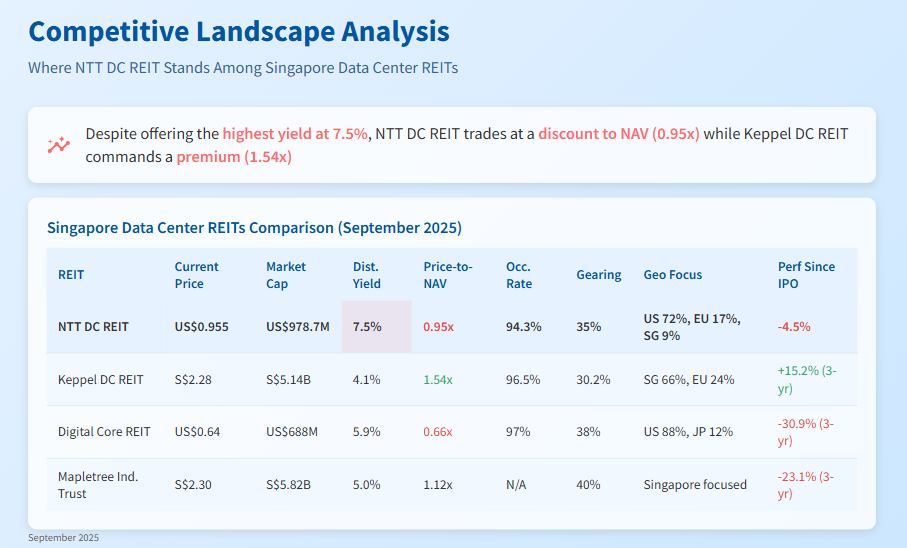
This table lays out price, yield, gearing, portfolio data, and recent performance for Singapore’s four key data center REITs. Despite its headline yield, NTT DC REIT lags on price, while Keppel DC REIT commands top premium and returns. Digital Core highlights the downside of concentration risk and tenant issues.
Yield Premium Paradox
NTT DC REIT's 7.5% projected yield represents a significant premium over established peers:
+3.4% vs. Keppel DC REIT (4.1%)
+1.6% vs. Digital Core REIT (5.9%)
+2.5% vs. Mapletree Industrial Trust (5.0%)
