

OCBC FY2025 Deep Dive: Why Net Profit Dropped 2% Despite Record S$14.6B Income
Because a hawker selling record bowls of noodles doesn't matter if his take-home pay is shrinking.

The Hook and Intro
The man sitting across from me on the East-West Line last Tuesday was reading his CDP statement on his phone. He read it three times. Then he put his phone in his pocket and stared at the floor for the rest of the journey to Jurong East. He was looking at a portfolio heavily weighted in local banks. The numbers were telling him a story that the evening news was completely ignoring.
Download OCBC FY2025 Results Presentation Here:
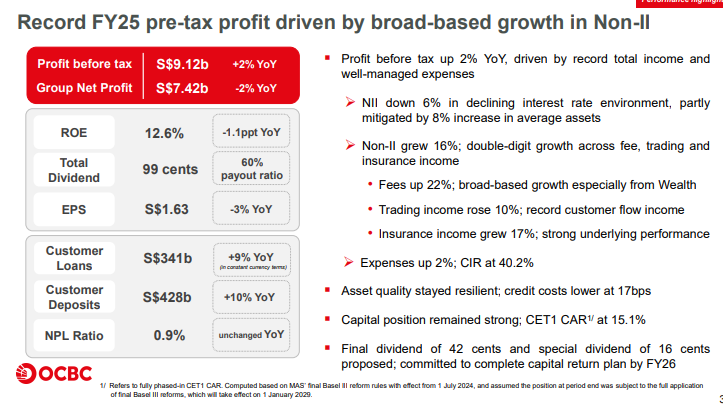
OCBC just posted a record total income of S$14.6 billion. Revenue grew. The dividend hit 99 cents. But net profit and earnings per share actually dropped—and that gap is where your retirement math gets complicated.
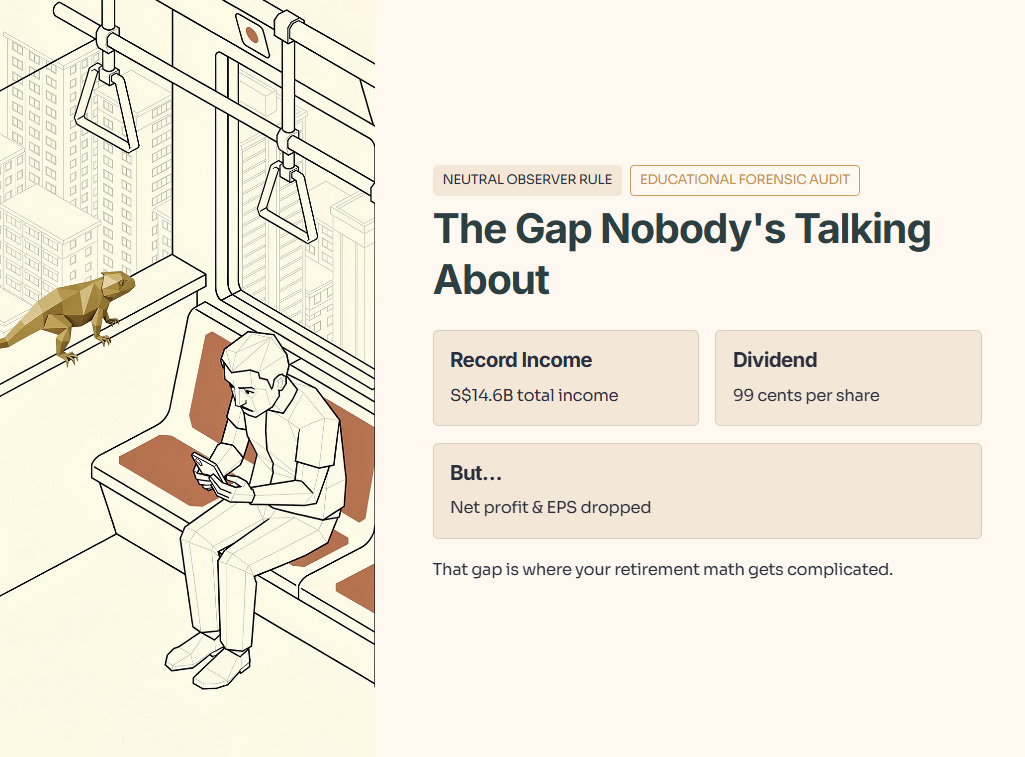
Before we begin, a reminder of the Neutral Observer Rule. This analysis is an educational forensic audit of the balance sheet. I do not provide buy, sell, or hold recommendations. I do not give price targets. We are here to uncover the math.
🦎 Iggy’s Insight
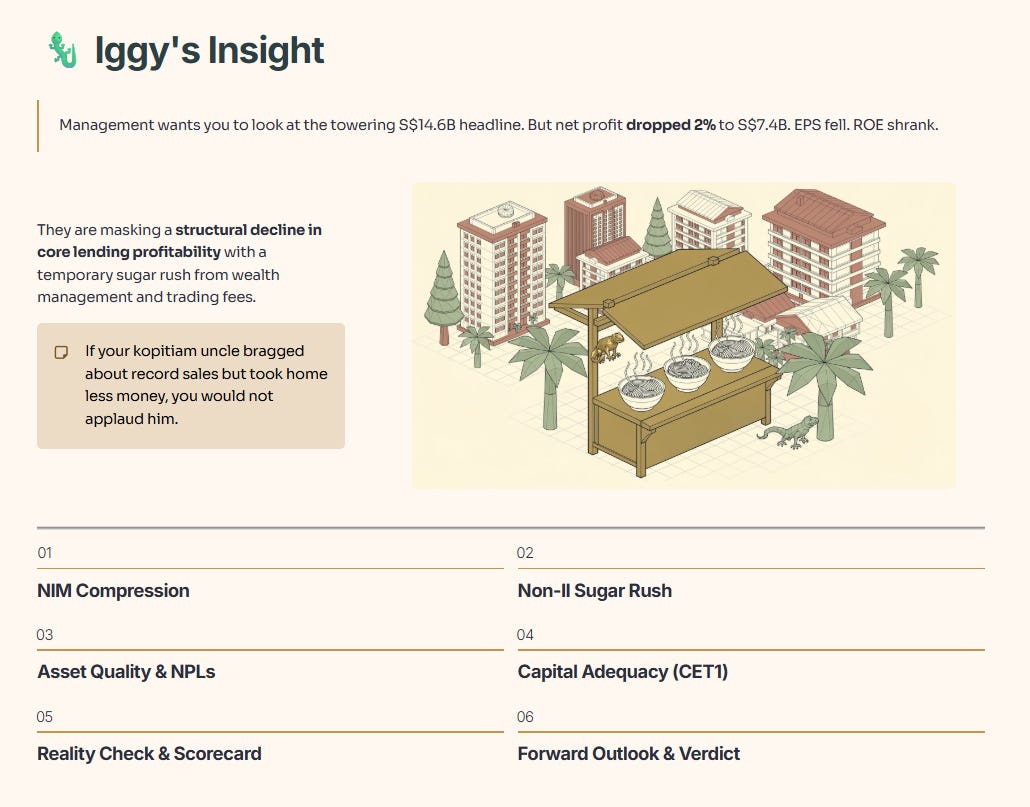
Management wants you to look at the towering record total income of S$14.6 billion. It is a beautiful headline that makes you feel warm and safe. But the forensic reality is hiding in the basement. Net profit actually dropped 2% year-on-year to S$7.4 billion. Earnings per share fell. Return on equity shrank. They are masking a structural decline in core lending profitability with a temporary sugar rush from wealth management and trading fees. If your kopitiam uncle bragged about record sales but took home less money, you would not applaud him. Boring is your best friend in banking, and right now, the boring part is leaking. The headlines are screaming growth, but the balance sheet is whispering caution
In This Article:
The Slide-by-Slide Audit
Net Interest Margin (NIM) Compression
The Non-Interest Income (Non-II) Sugar Rush
Asset Quality and NPLs
Capital Adequacy (CET1)
The Reality Check
The Performance Scorecard
The Forward Outlook
Scenario Analysis (FY26 / FY27)
InvestingPro Reality Check
The Verdict
About Iggy & the Elite 170
In the Singapore market, the gap between a smart entry and becoming someone else’s exit liquidity can be as little as 48 hours. That’s the cost of informational lag.
Free subscribers get my analysis up to 14 days later. The Elite 170 get it the moment it’s ready.
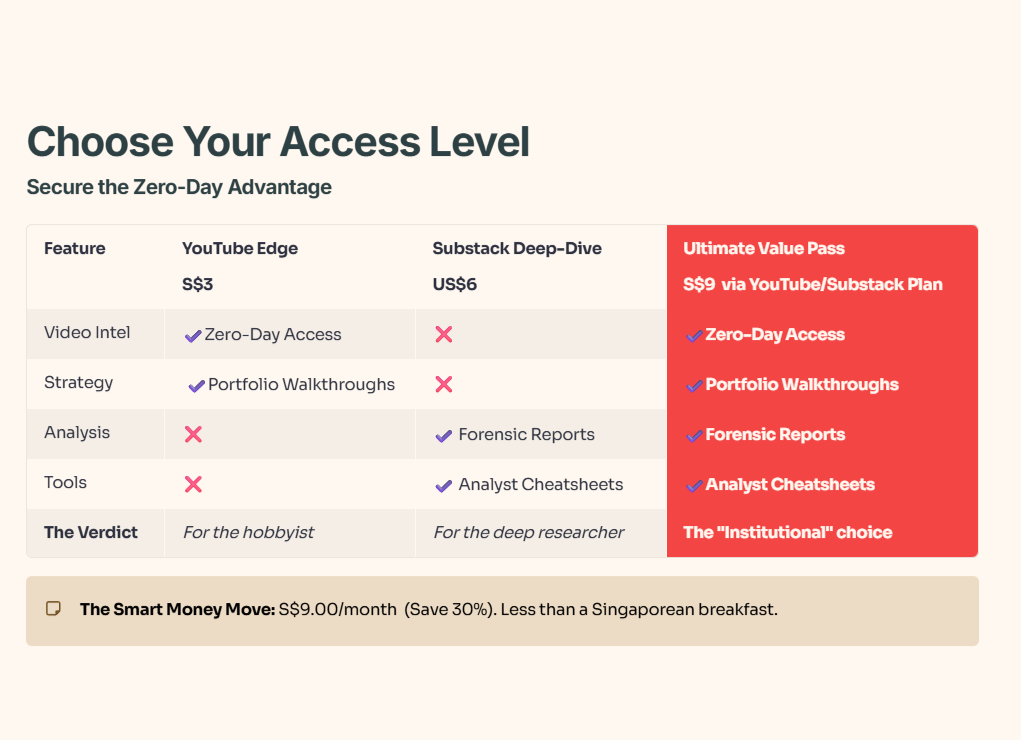
Your Edge: The S$9 Ultimate Value Pass bundles zero-day video intel, forensic reports, and analyst cheatsheets into one institutional-grade feed — for less than a Singaporean breakfast.
The Slide-by-Slide Audit
Let us strip away the presentation polish. We need to look at the actual forensic machinery of this bank. We will start with the most critical engine of profitability.
1. Net Interest Margin (NIM) Compression
Educational Note
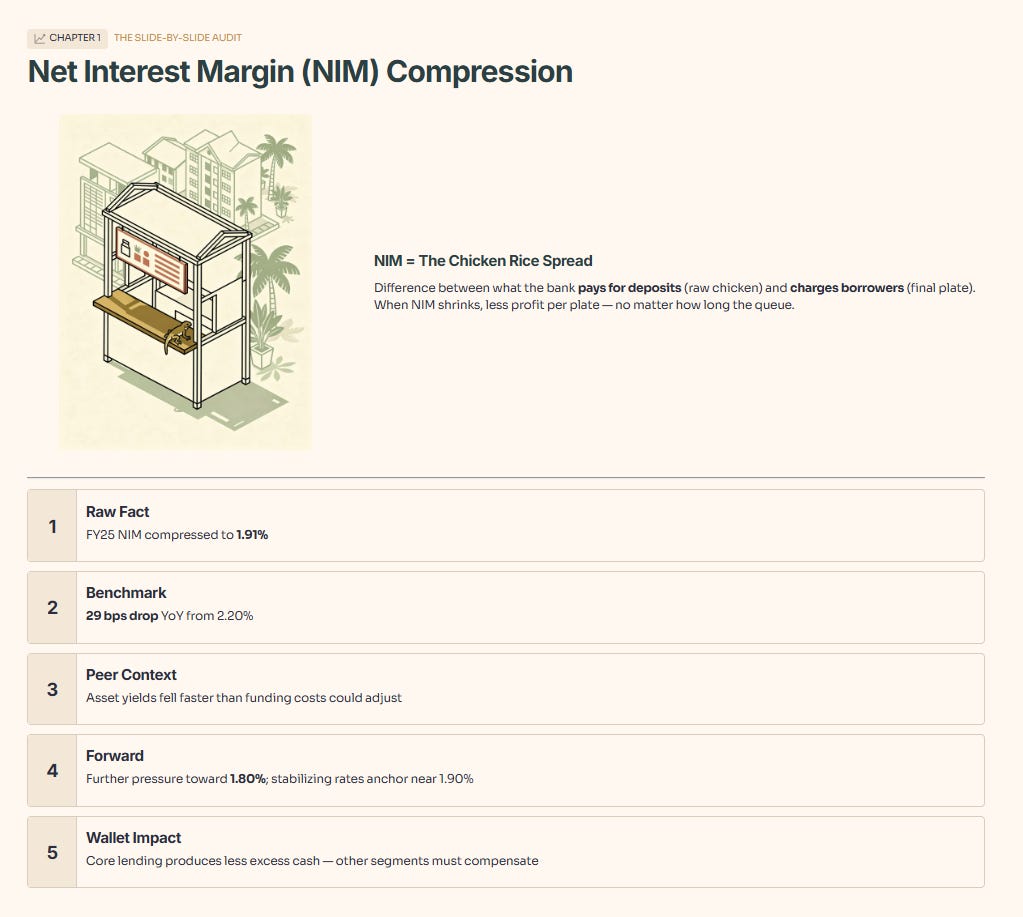
Let’s define that term. Net Interest Margin, or NIM, is exactly like a chicken rice seller’s spread. It is the difference between what the bank pays you for your deposits—the cost of the raw chicken—and what they charge borrowers for loans—the price of the final plate. So what does this mean for you? When NIM shrinks, the hawker makes less profit on every single plate he sells. It does not matter how long the queue gets. Your dividends are directly threatened by this squeeze.
We must apply the Five-Layer Rule to the NIM data to understand the severity of this shift:
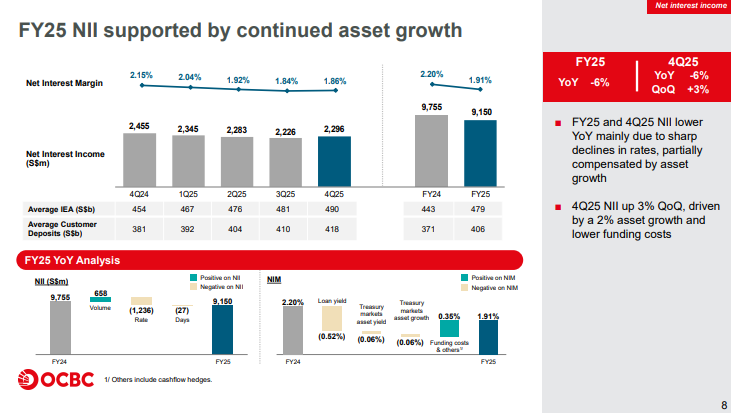
Layer 1 — Raw Fact: FY25 NIM compressed severely to 1.91%.
Layer 2 — Historical Benchmark: This is a massive 29 basis point drop year-on-year from 2.20% in FY24.
Layer 3 — Peer Context: While regional peers are also facing rate pressure, a drop of this velocity indicates the bank’s asset yields fell much faster than their funding costs could adjust.
Layer 4 — Forward Scenario: If global rates continue their current trajectory, NIM could face further pressure toward 1.80%; however, stabilizing rates would see it anchor near 1.90%.
Layer 5 — Wallet Impact: For a retiree in Tampines or Pasir Ris managing a portfolio, this means the bank’s core lending business is producing less excess cash, requiring other segments to pick up the slack.
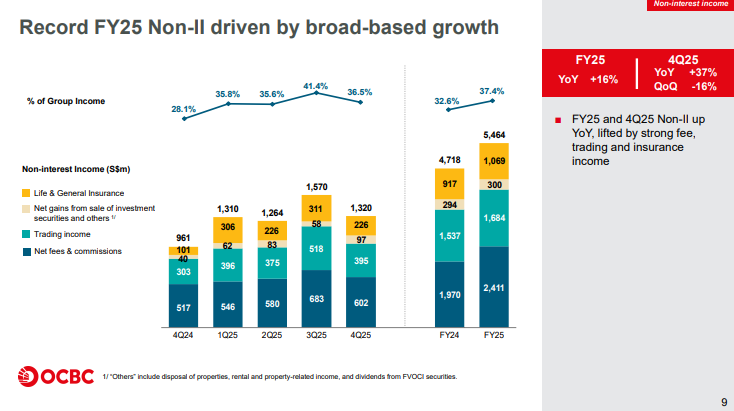
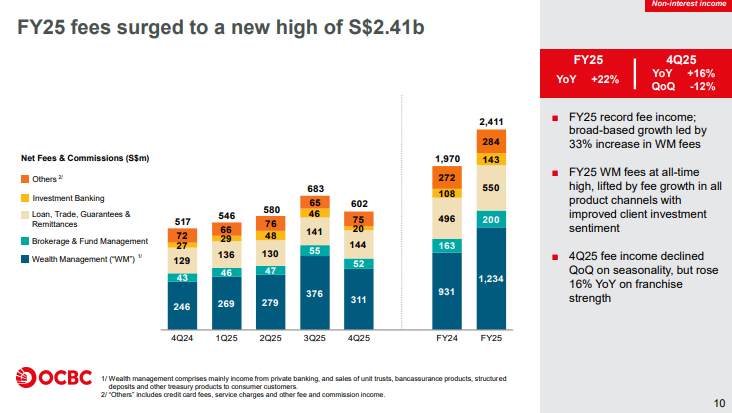
2. The Non-Interest Income (Non-II) Sugar Rush
And let’s be honest, they are not wrong to celebrate their wealth management performance. But here is the uncomfortable truth. Relying on market sentiment for core profits is a dangerous game.
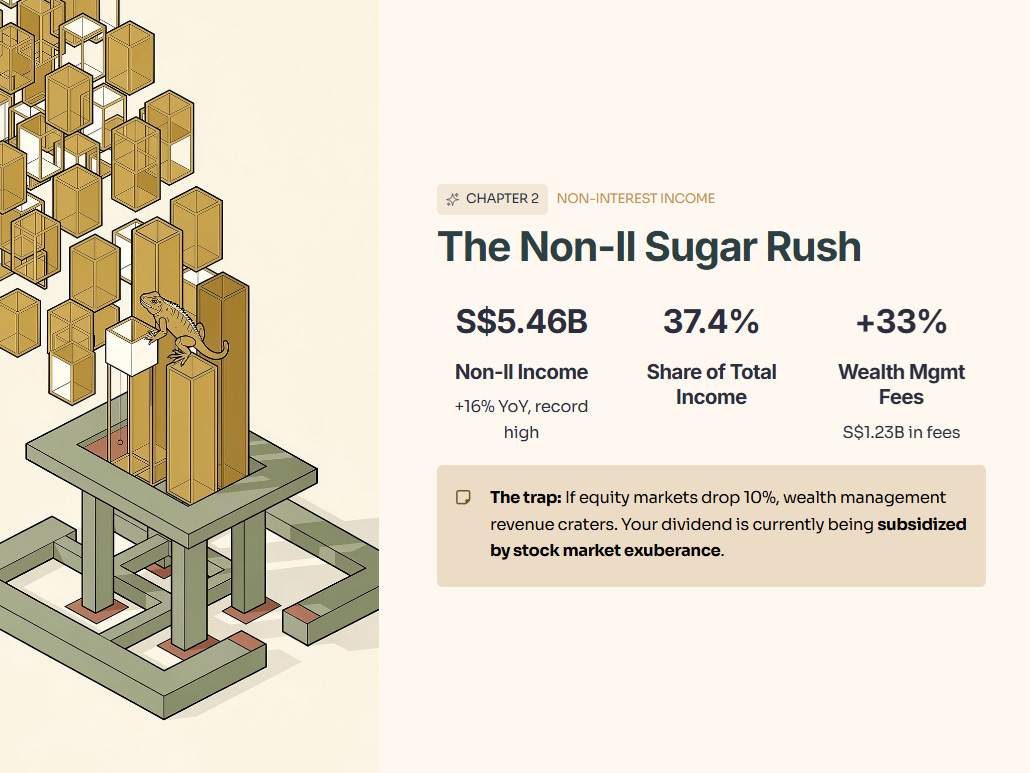
The raw fact is that Non-Interest Income surged 16% year-on-year to S$5.46 billion. The historical benchmark marks this as a record high for the group. This pushes Non-II to a hefty 37.4% of total group income. In terms of peer context, Singaporean banks are all pivoting hard to wealth management to offset interest margin compression, but OCBC’s 22% growth in fee income is structurally aggressive. This was driven by a massive 33% jump in Wealth Management fees to S$1.23 billion. Looking at the forward scenario, if equity markets drop 10%, this wealth management revenue will crater as investors sit on their hands. The wallet impact is profound: your dividend is currently being subsidized by stock market exuberance.
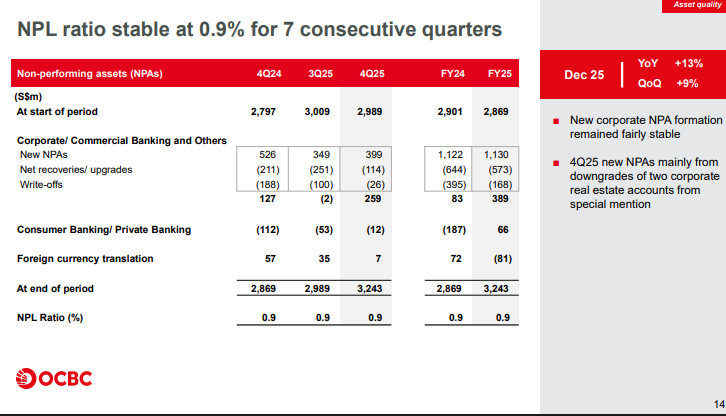
3. Asset Quality and NPLs
Educational Note
Let’s pause on that term for a second. The Non-Performing Loan ratio represents the percentage of borrowers who have stopped paying the bank back. Think of it as the neighbourhood kopitiam tab. If too many uncles stop paying their monthly kopi tabs, the stall goes bankrupt. So what does this mean for you? A low ratio means your invested capital is not being vaporized by bad debts.
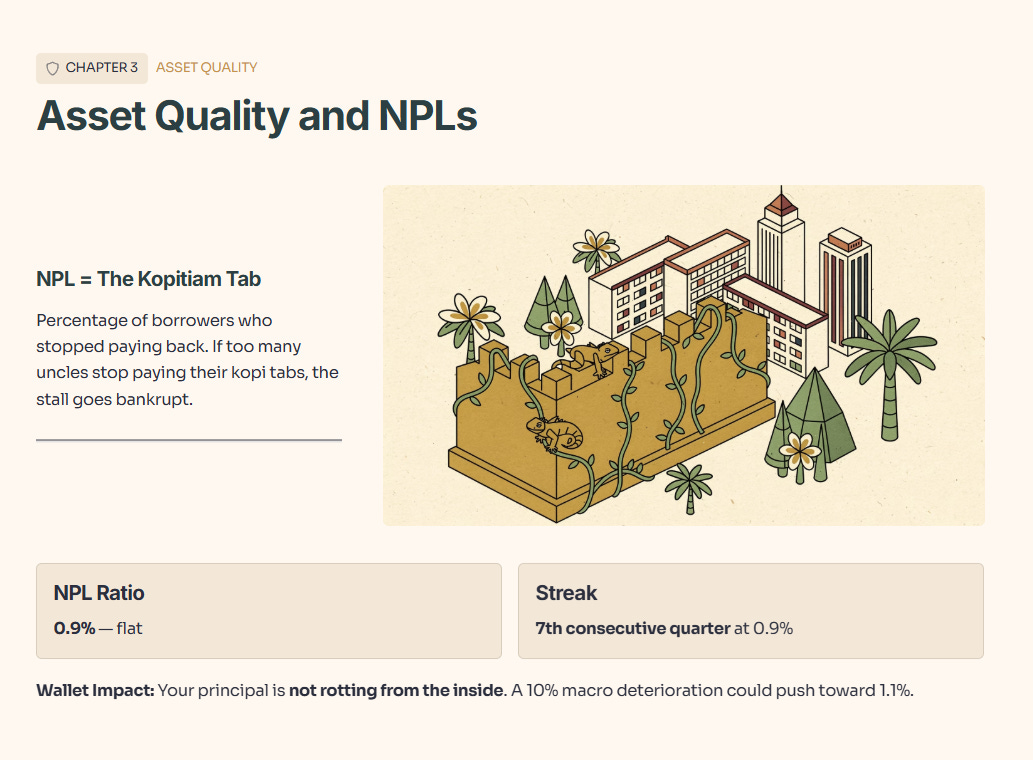
The raw fact is that the NPL ratio remained perfectly flat at 0.9%. The historical benchmark shows this is the seventh consecutive quarter OCBC has held this ratio at exactly 0.9%. This demonstrates remarkable historical stability. For the forward scenario, a 10% deterioration in the macro environment could see this tick toward 1.1%, while a 10% improvement would likely keep it pegged at current levels. The wallet impact is entirely positive: for a Singaporean investor relying on this stock for steady passive income, your principal is not rotting from the inside.
4. Capital Adequacy (CET1)
Educational Note
Now let’s define that. Common Equity Tier 1, or CET1, is the Iron Bastion. It is the hardcore, unencumbered cash and equity the bank holds in its vault to survive a catastrophic economic collapse. So what does this mean for you? It is your ultimate safety net. If CET1 is high, the bank survives a recession without asking you for more money; if it drops too low, your dividends get suspended indefinitely.
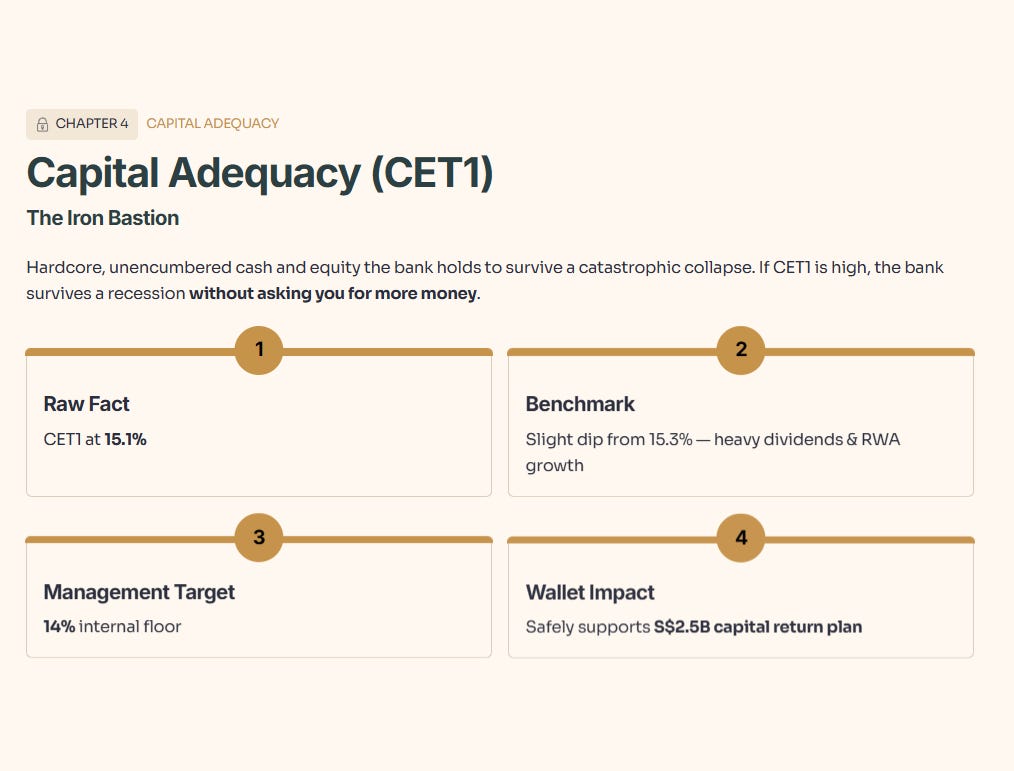
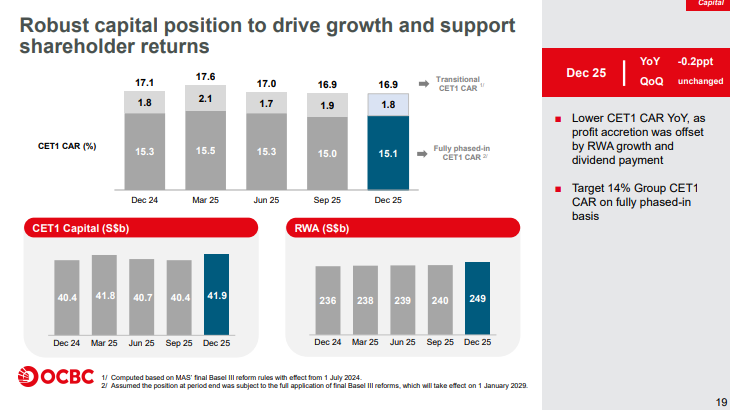
The raw fact is that the fully phased-in CET1 ratio stands at 15.1%. The historical benchmark shows this is a slight dip from 15.3% a year ago, primarily because they paid out heavy dividends and grew risk-weighted assets. Management’s own internal target is 14%. In our forward scenario, aggressive lending growth could pull this toward 14.5%, while further profit accretion would push it back toward 15.5%. The wallet impact is clear: because the bank is sitting above its target, they can safely commit to their S$2.5 billion capital return plan.
🦎 Iggy’s Insight
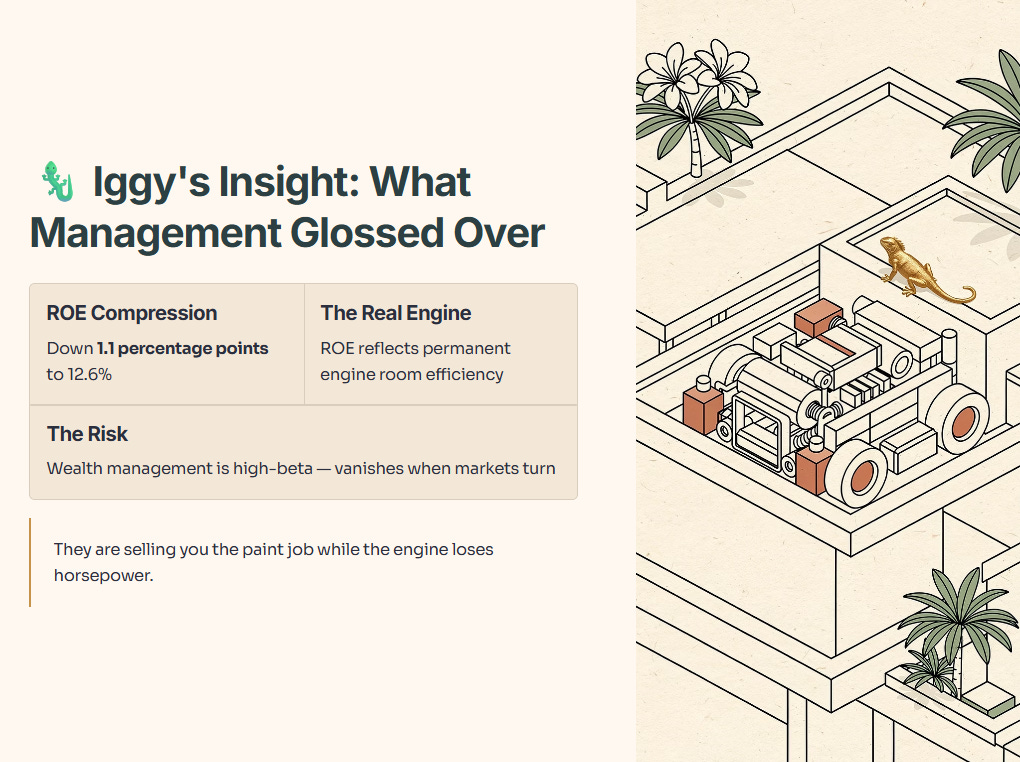
We need to talk about what management glossed over. They spent multiple slides celebrating a 14% jump in wealth management income. But look at the Return on Equity. ROE compressed by a full 1.1 percentage points down to 12.6%. That is the number that dictates how efficiently they use your retained earnings. Management barely breathed a word about this structural drag. Why? Because wealth management is a high-beta confidence game that can vanish when markets turn. ROE reflects the permanent engine room of the bank. They are selling you the paint job while the engine loses horsepower. You won’t get bragging rights at the kopitiam for noticing this, but it protects your capital.
The Reality Check
It is easy to look at a 99-cent dividend and feel like a genius. But relying purely on the management narrative is a mistake. We need to look at the actual receipts.
“I don’t just guess at valuations. I check the institutional models.” Source: InvestingPro Data. Unlock these institutional tools for your own portfolio: Use code INVESTINGIGUANA for an exclusive 50% Discount.
🏛️ [Claim Your 50% Discount Here]
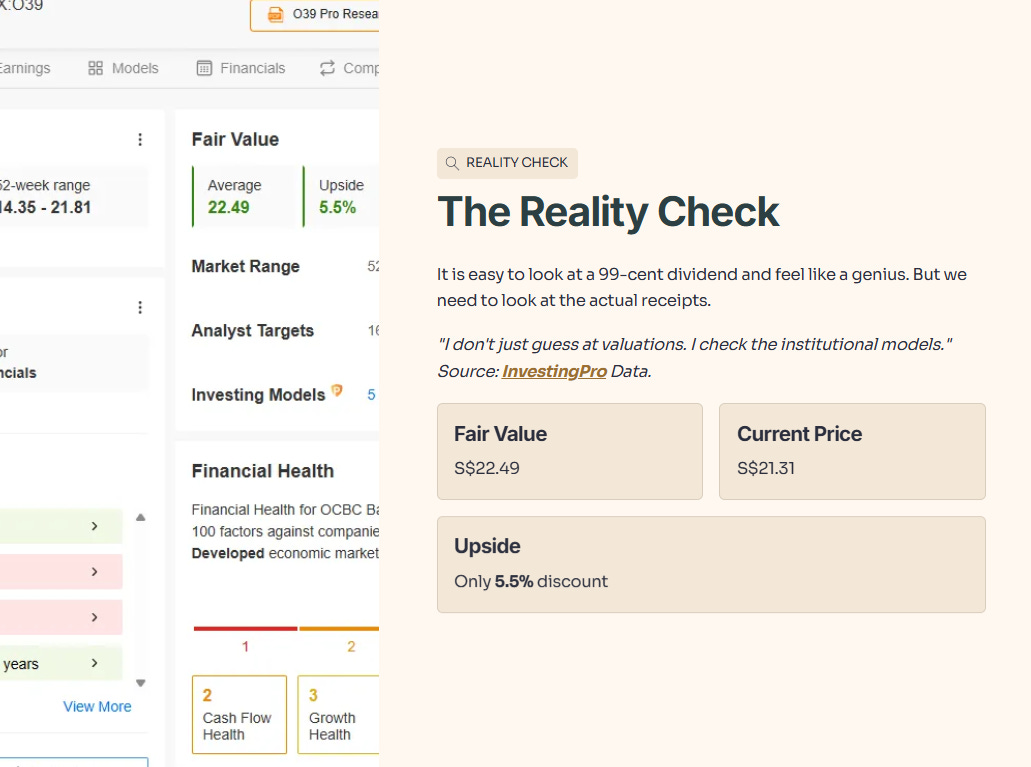
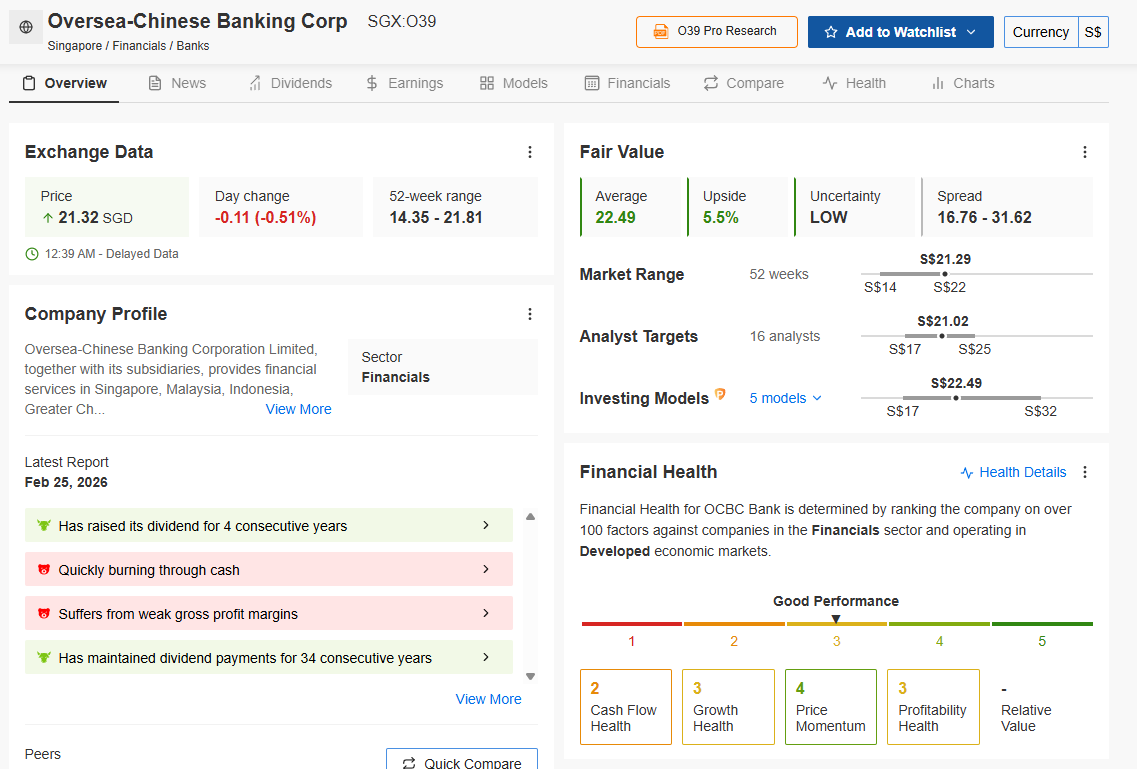
The slides say one thing, but what do the institutional models say? I checked the InvestingPro institutional-grade fair value model, which currently shows the stock trading at a 5.5% discount to fair value. While management highlights growth, the institutional math suggests the stock is priced quite fairly, offering only a modest upside of S$22.49 against the current price of S$21.31.
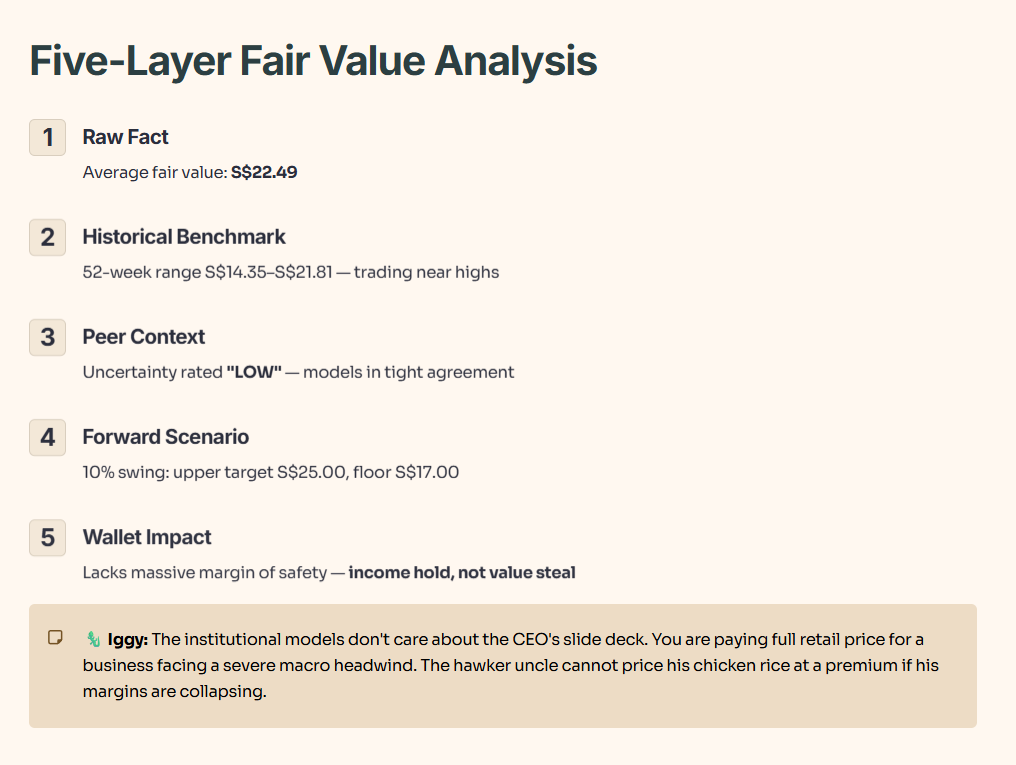
Layer 1 — Raw Fact: The average fair value is S$22.49.
Layer 2 — Historical Benchmark: The 52-week range of S$14.35 to S$21.81 shows it is currently trading near its historical highs.
Layer 3 — Peer Context: The uncertainty is rated as “LOW,” meaning the underlying investing models are in tight agreement on this valuation.
Layer 4 — Forward Scenario: A 10% swing in sentiment could push this toward the upper analyst target of S$25.00, while a reversal could see it drift back toward the S$17.00 floor.
Layer 5 — Wallet Impact: For your funds, this means the current entry point lacks a massive margin of safety, making it an income hold rather than a value steal.
🦎 Iggy’s Insight
The institutional models do not care about the CEO’s slide deck. The institutional fair value aggregator strips away the corporate poetry and looks purely at the cash. Right now, it shows a 5.5% upside, which is “low uncertainty” but also low excitement. This validates management’s stance that the business is stable, but contradicts any “get in before it moonshots” narrative. The hawker uncle cannot price his chicken rice at a premium if his margins are collapsing. The math suggests you are paying full retail price for a business facing a severe macro headwind.
The Performance Scorecard
We must now audit the actual sustainability of the income. Is this dividend built on stone or sand?
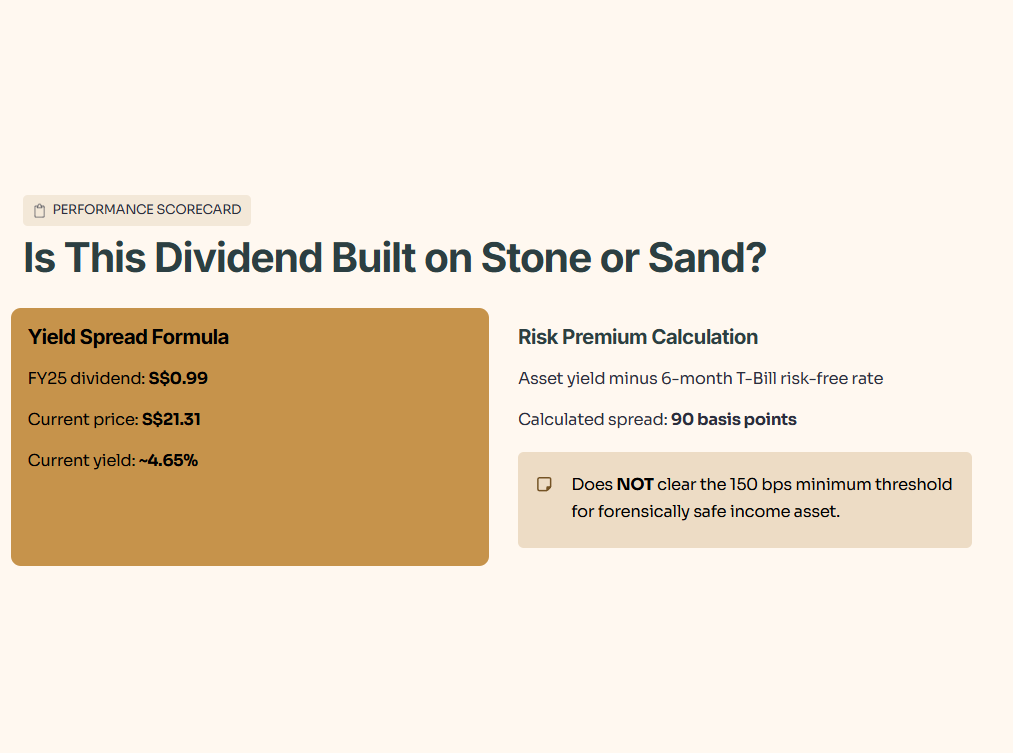
Let’s apply the Yield Spread formula. This is where the math meets your psychology. We will use the current 6-month T-Bill rate as our risk-free proxy. Based on the FY25 total dividend of S$0.99 and current price of S$21.31, the current yield is approximately 4.65%.
The calculated risk premium is the asset yield minus the risk-free rate.
The calculated spread is 90 basis points. This does NOT clear the 150 basis point minimum threshold required to be considered forensically safe for an income asset.
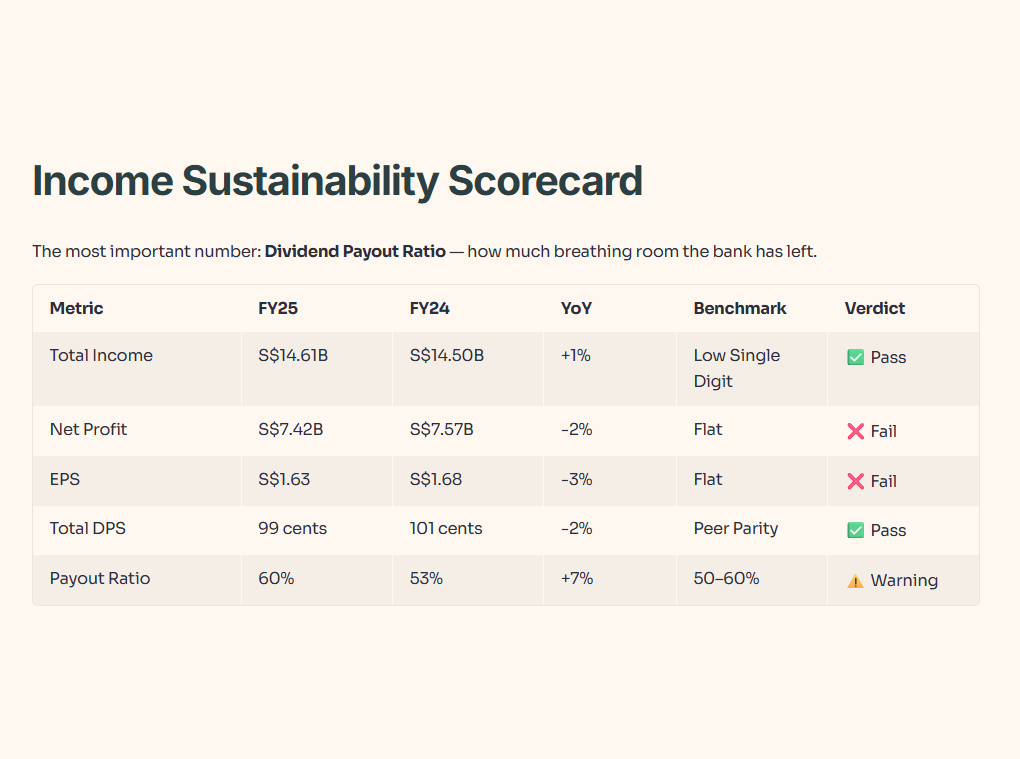
Income Sustainability Scorecard
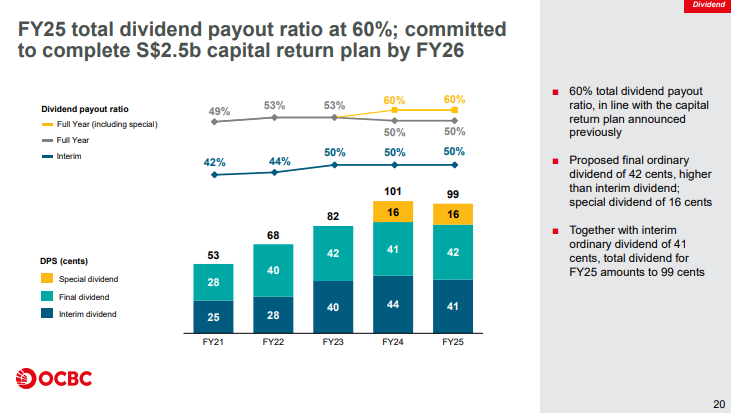
The most important number in this table is the Dividend Payout Ratio, because it shows exactly how much breathing room the bank has left.
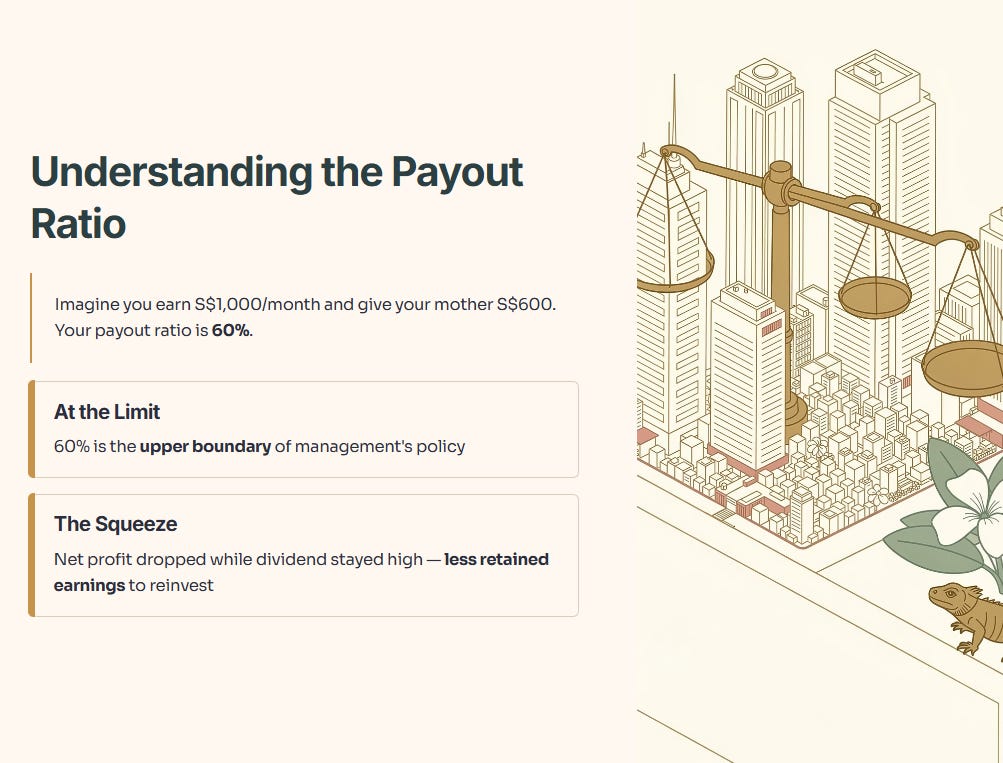
Educational Note
Let’s define that term. The Dividend Payout Ratio is the percentage of the bank’s net profit that it pays out to you. Imagine you earn S$1,000 a month and give your mother S$600; your payout ratio is 60%. So what does this mean for you? A ratio of 60% is at the upper limit of management’s policy. Because net profit dropped while the dividend stayed high, the bank has less retained earnings to reinvest in itself.
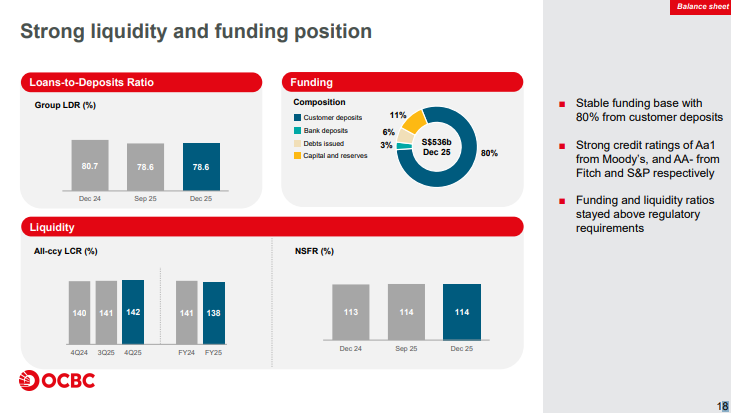
Debt Health Scorecard
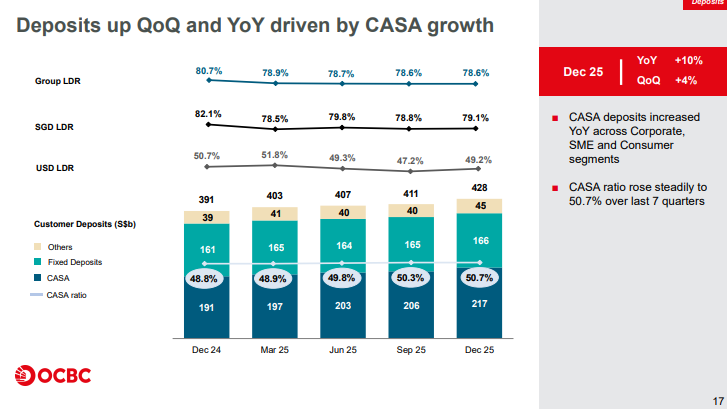
For a bank, “debt” is effectively deposits and funding. We look at liquidity and capital to measure the Debt Wall. The number that matters most here is the loan-to-deposit ratio, because it proves they are not desperately over-lending to chase yield.
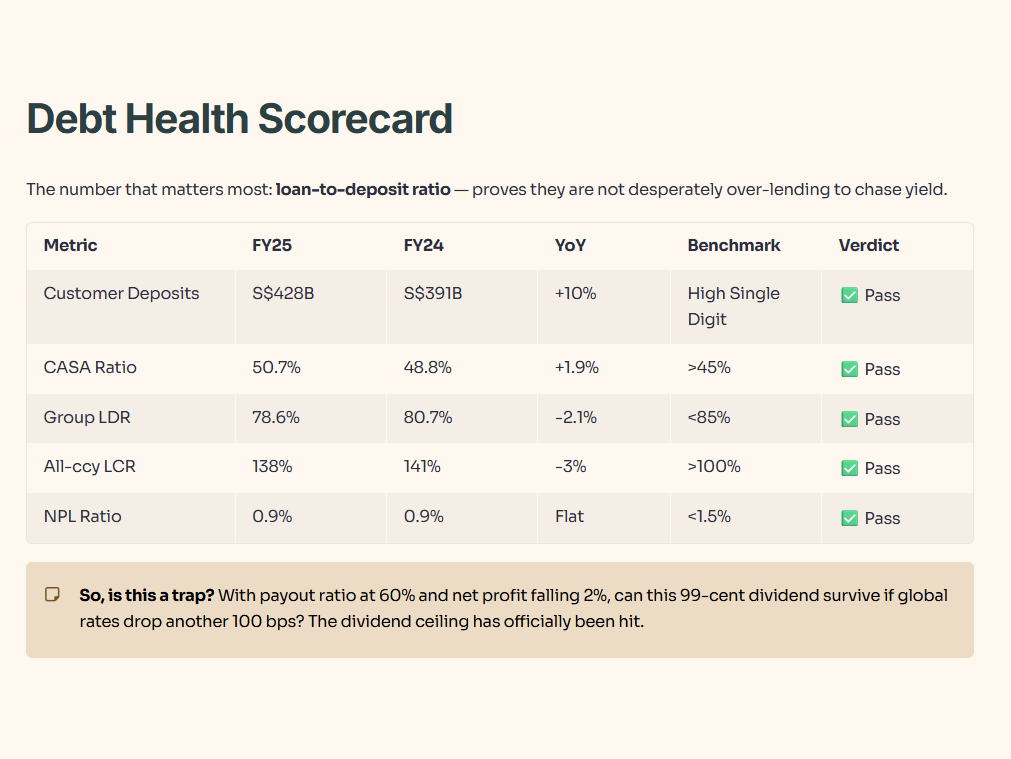
So, is this a trap?
Management delivered on total income growth. But with the payout ratio stepping up to 60% and net profit falling 2%, the real question is whether the balance sheet can sustain this 99-cent dividend if global rates drop another 100 basis points. For a retiree in Woodlands or Sembawang managing funds, a shrinking net profit means the dividend ceiling has officially been hit.
“Next, I’ll show the single ‘red-line’ indicator that tells you whether the 99-cent dividend stays intact—or gets quietly squeezed—if rate cuts arrive faster than OCBC can rebuild its buffer.”
