

OCBC Just Posted Record Profit. Its Dividend Yield Just Fell Below My Forensic Floor.
Record wealth management income and a 15% dividend hike weren't enough to keep pace with a rallying share price, here's what the numbers actually show.


Oversea-Chinese Banking Corporation (OCBC) has declared a record quarterly net profit of S$2.22 billion for 2Q26 and raised its interim dividend by 15% to 47 cents per share. An expanding share price has, at the same time, pushed its ordinary trailing dividend yield down to 2.94%. Both of these things are true at once, and understanding why matters more than picking a headline.

The dual-investor framework makes a clear distinction between equity growth and current cash flow. For a younger investor in the accumulation phase, a bank expanding its fee engines while growing net asset value provides solid compounding potential.

But for a heartland investor in the drawdown phase who needs immediate cash flow to meet living expenses, headline profit records do not pay the bills if the cash payout yields less than guaranteed government benchmarks.


What’s Actually Working
Top-Line Growth
Non-Interest Income Surge
Trading, Treasury & Insurance
Cost Discipline
Asset Quality
Where the Pressure Actually Sits
The Yield Mechanism: Why a Bigger Dividend Still Means a Lower Yield
Dividend Increase
Yield Compression
Financial Health & Income Sustainability Checklist
Capital Health & Solvency
Iggy’s Insight
No One Pays Him To Be Right
What Would Change This
The Bottom Line
What’s Actually Working
Top-Line Growth
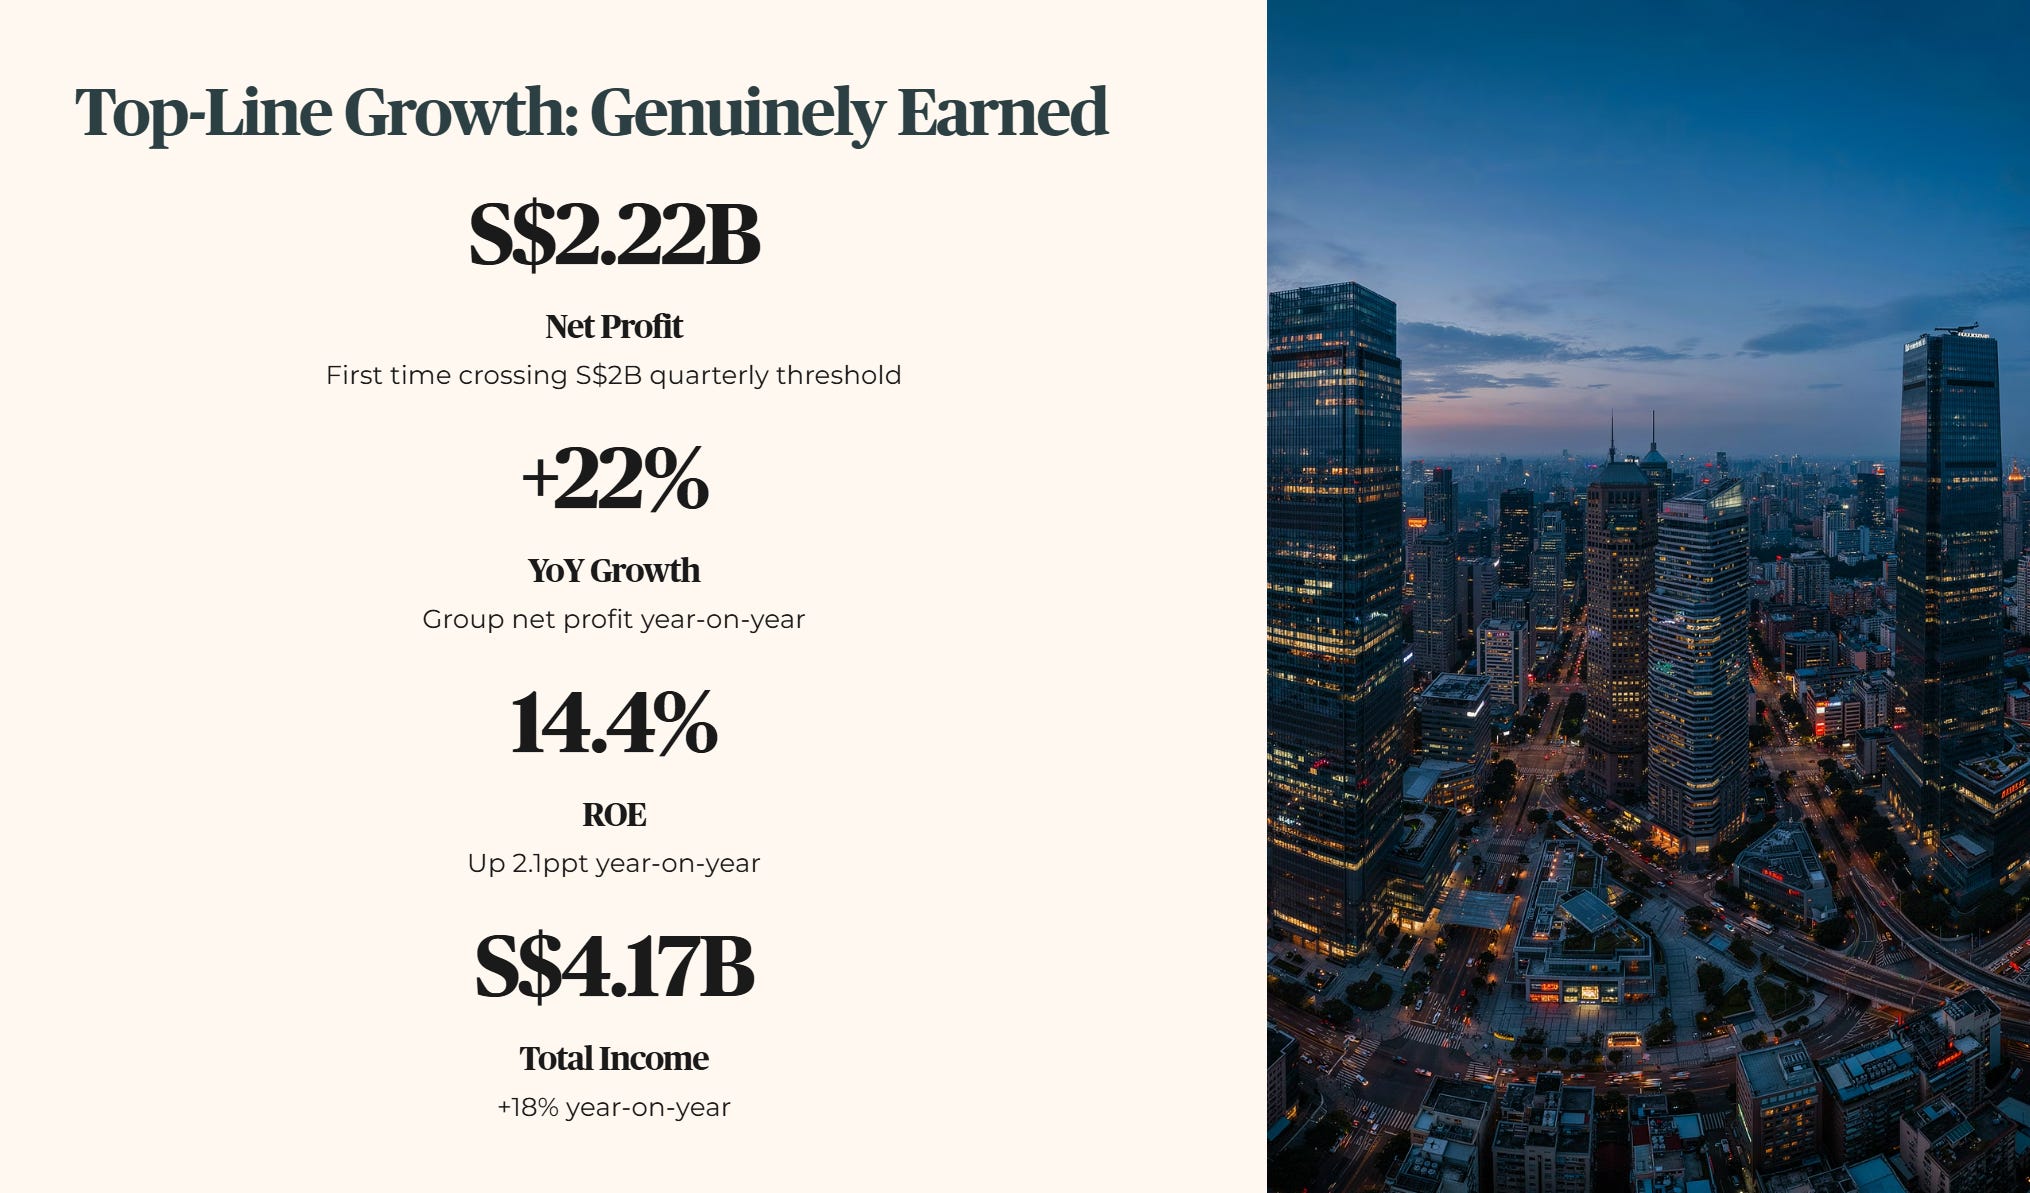
Management led its presentation with impressive top-line growth, and on the fee-generating side of the business, that’s genuinely earned. 2Q26 earnings reached a new high, crossing the S$2 billion quarterly net profit threshold for the first time. Group Net Profit rose 22% year-on-year to S$2.22 billion, pushing annualised Return on Equity (ROE) up 2.1 percentage points to 14.4%. Total income expanded 18% year-on-year to S$4.17 billion.
Non-Interest Income Surge
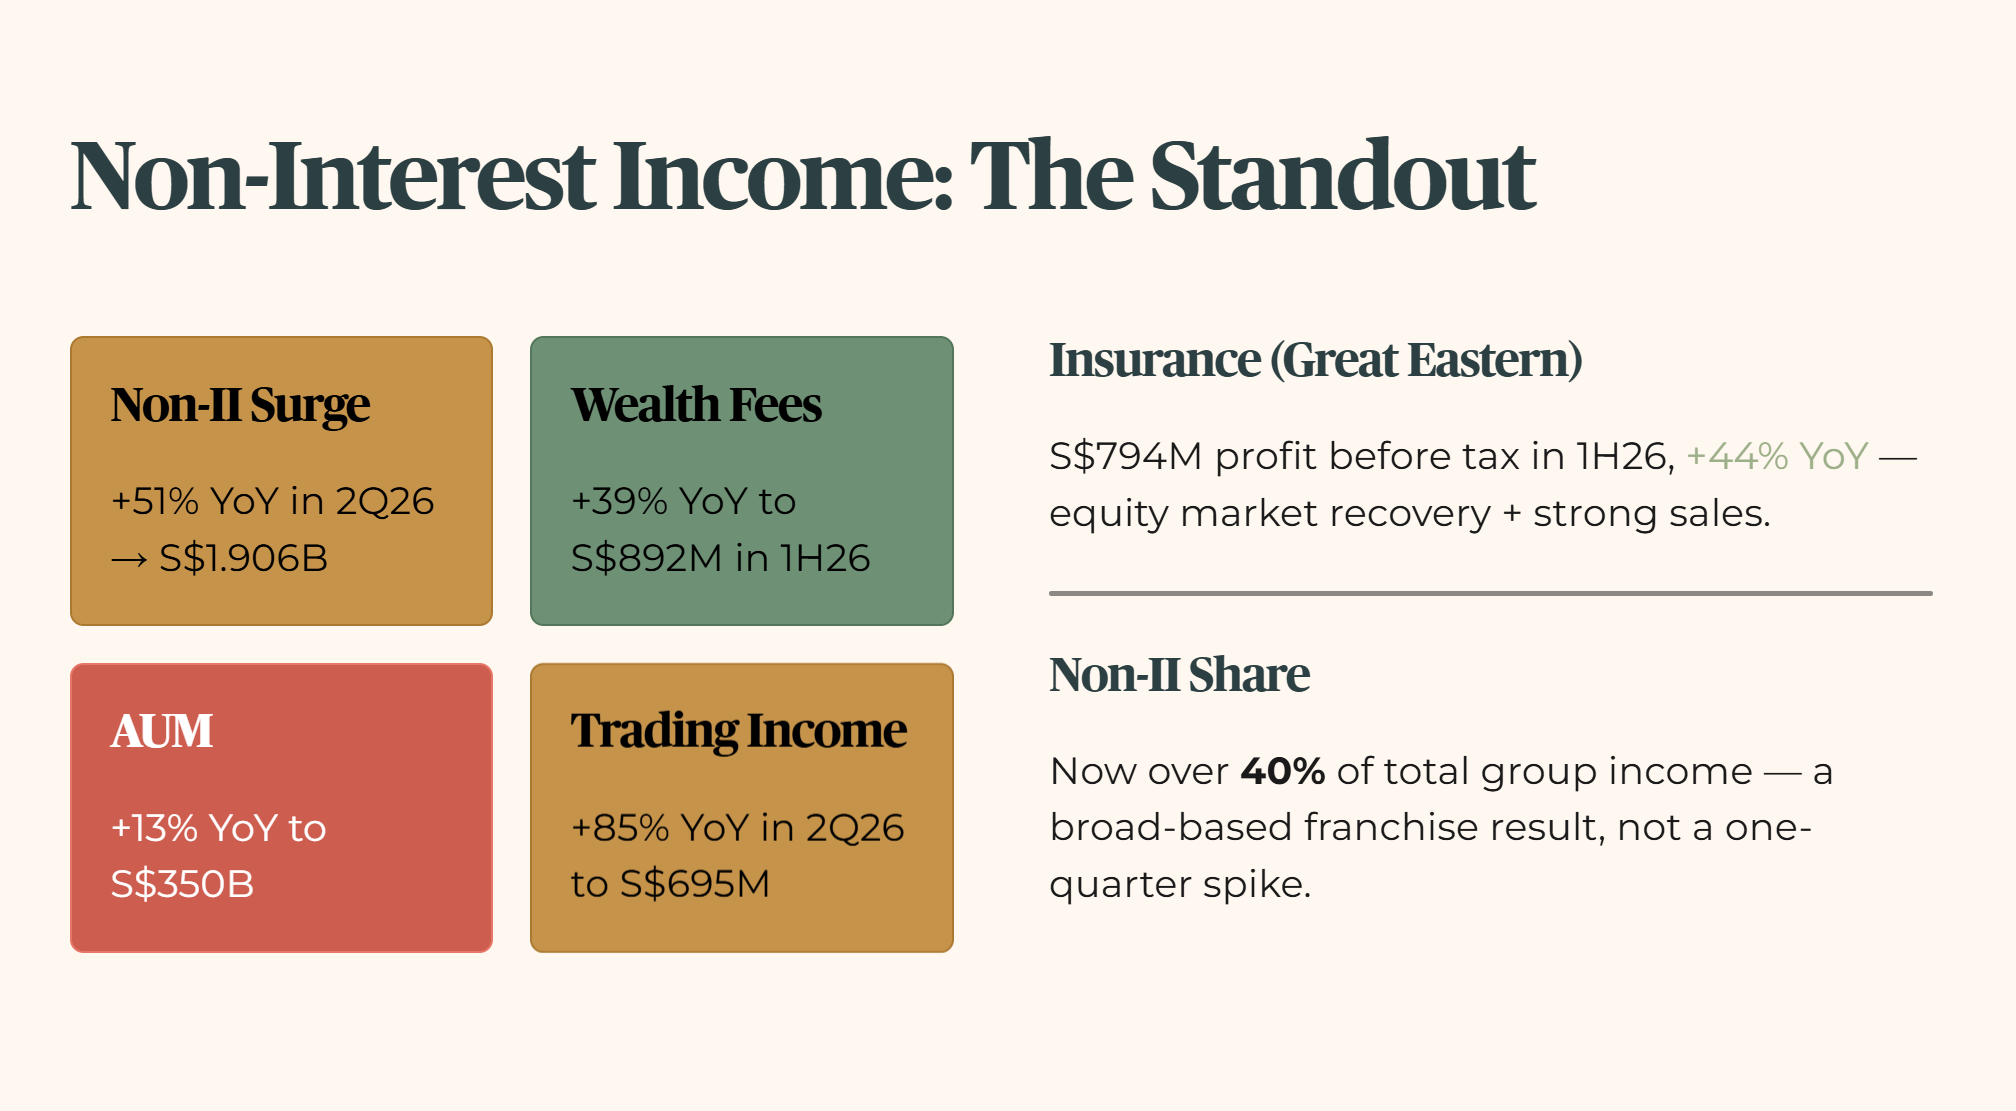
The standout performance of the quarter came from Non-Interest Income (Non-II), which surged 51% year-on-year in 2Q26 to S$1.906 billion. For the first half of 2026, Non-II grew 36% year-on-year to S$3.512 billion, now accounting for over 40% of total group income. Net fee and commission income rose 28% year-on-year in 2Q26 to S$739 million, propelled by wealth management fees, which climbed 39% year-on-year to S$892 million for 1H26. Banking Wealth Management Assets Under Management (AUM) expanded 13% year-on-year to S$350 billion, supported by net new money inflows across private and premier banking tiers. This is a real, broad-based franchise result, not a one-quarter spike.
Trading, Treasury & Insurance
Trading and investment income jumped 85% year-on-year in 2Q26 to S$695 million. Customer flow treasury income set a half-year record of S$873 million, up 47% year-on-year. Insurance income from Great Eastern Holdings (GEH) contributed S$794 million to profit before tax in 1H26, up 44% year-on-year, benefiting from equity market recovery and strong underlying insurance sales.
Cost Discipline
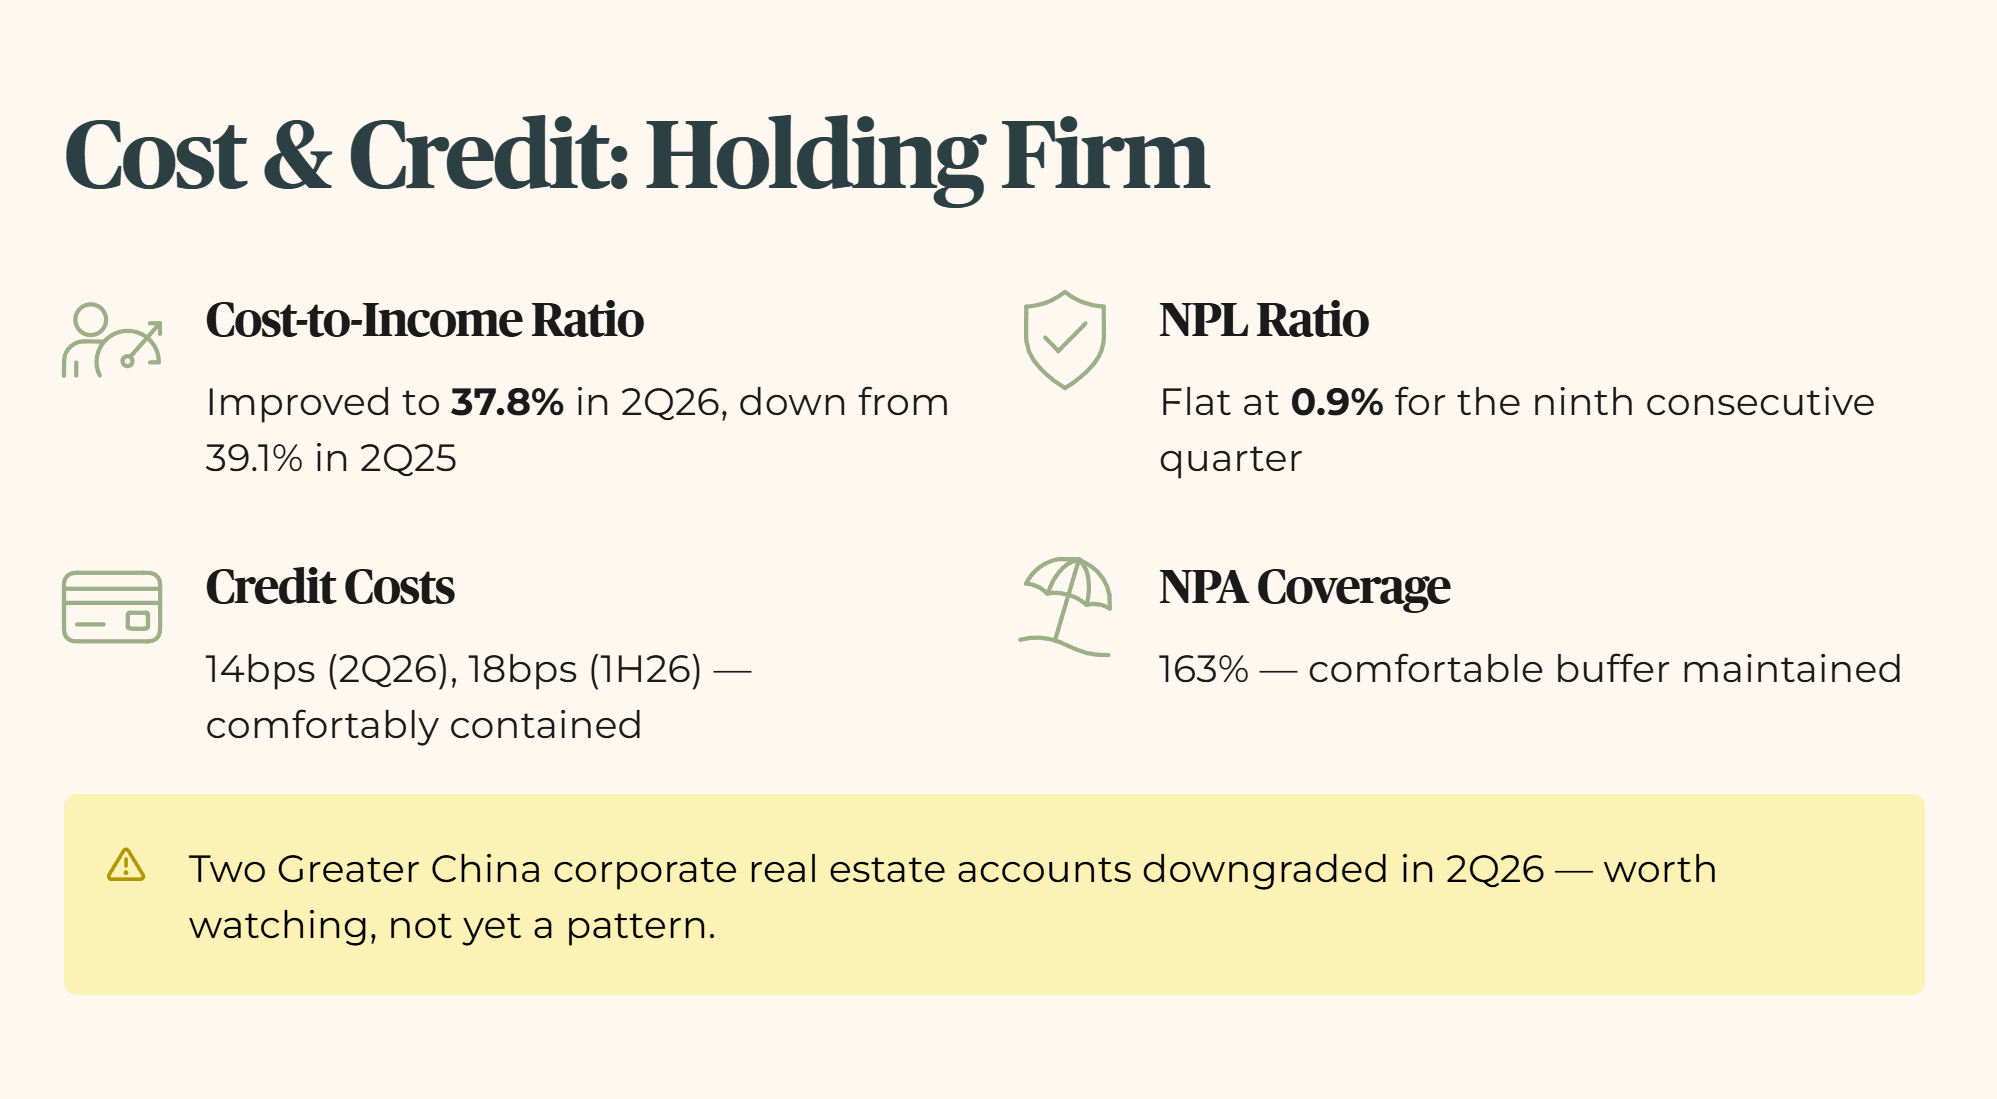
Cost discipline held firm alongside this growth. The Cost-to-Income Ratio (CIR), how much the bank spends to generate each dollar of income, improved to 37.8% in 2Q26, down from 39.1% in 2Q25.
Asset Quality
Asset quality also stayed genuinely stable. The Non-Performing Loan (NPL) ratio, the share of loans where borrowers are behind on payments, remained flat at 0.9% for the ninth consecutive quarter. New non-performing asset formation in 2Q26 rose to S$300 million, primarily from the downgrade of two Greater China corporate real estate accounts, worth watching but not yet a pattern. Annualised credit costs came in at 14 basis points for the quarter and 18 basis points for 1H26, both comfortably contained, and the NPA coverage ratio remained comfortable at 163%.
Where the Pressure Actually Sits
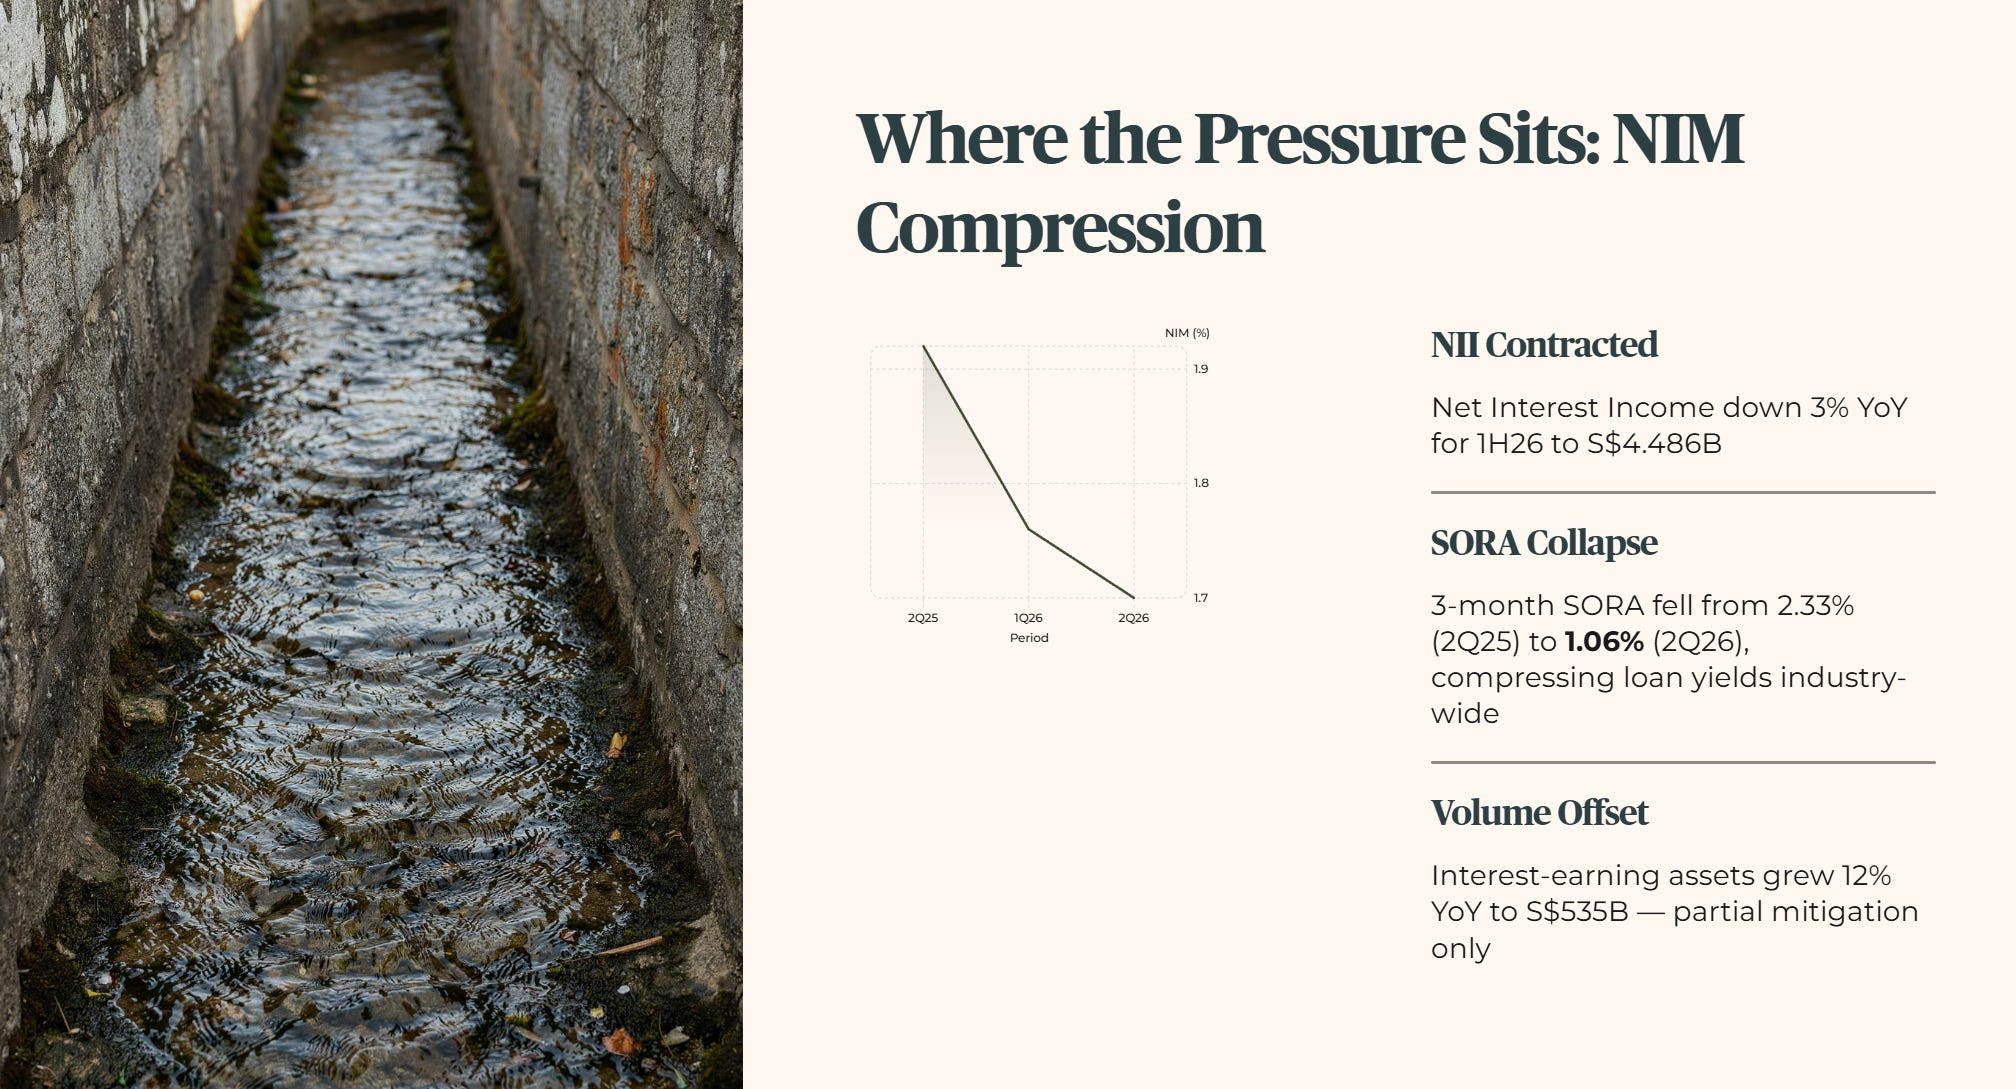
Set against that fee-driven strength, the core lending engine told a quieter story. Net Interest Income (NII), the primary revenue driver for any commercial bank, contracted 3% year-on-year for 1H26 to S$4.486 billion. Net Interest Margin (NIM), the spread between what OCBC earns on loans and what it pays on deposits, landed at 1.70% for 2Q26, a 6 basis point decline quarter-on-quarter and down significantly from 1.92% a year earlier.
Lower Singapore Overnight Rate Average (SORA) benchmarks are compressing loan yields across the industry, average 3-month SORA fell from 2.33% in 2Q25 to 1.06% in 2Q26, and management partially offset this through volume, average interest-earning assets grew 12% year-on-year to S$535 billion.
🦎 Iggy’s Insight
Management dedicated extensive slide coverage to record wealth management fees and Great Eastern insurance income. They glossed over the core engine: Net Interest Margin dropped 6 basis points in a single quarter to 1.70%. Non-interest income is volatile, driven by favourable equity markets and customer treasury flows. When market sentiment cools, non-interest income normalises.
Meanwhile, SORA sits at 1.06%, locking in structural yield compression across the commercial loan book. Wealth fees decorate the balance sheet, but net interest income pays the bills. Relying on trading tides to offset structural margin decline is a real strength, but it is not the same thing as a fortress core.
The Yield Mechanism: Why a Bigger Dividend Still Means a Lower Yield
Dividend Increase
Management highlighted a 15% increase in the interim dividend, raising the payout from 41 cents in 1H25 to 47 cents per share for 1H26, a 50% payout ratio against 1H26 annualised earnings per share of S$1.96. On paper, that’s unambiguously good news for income investors.
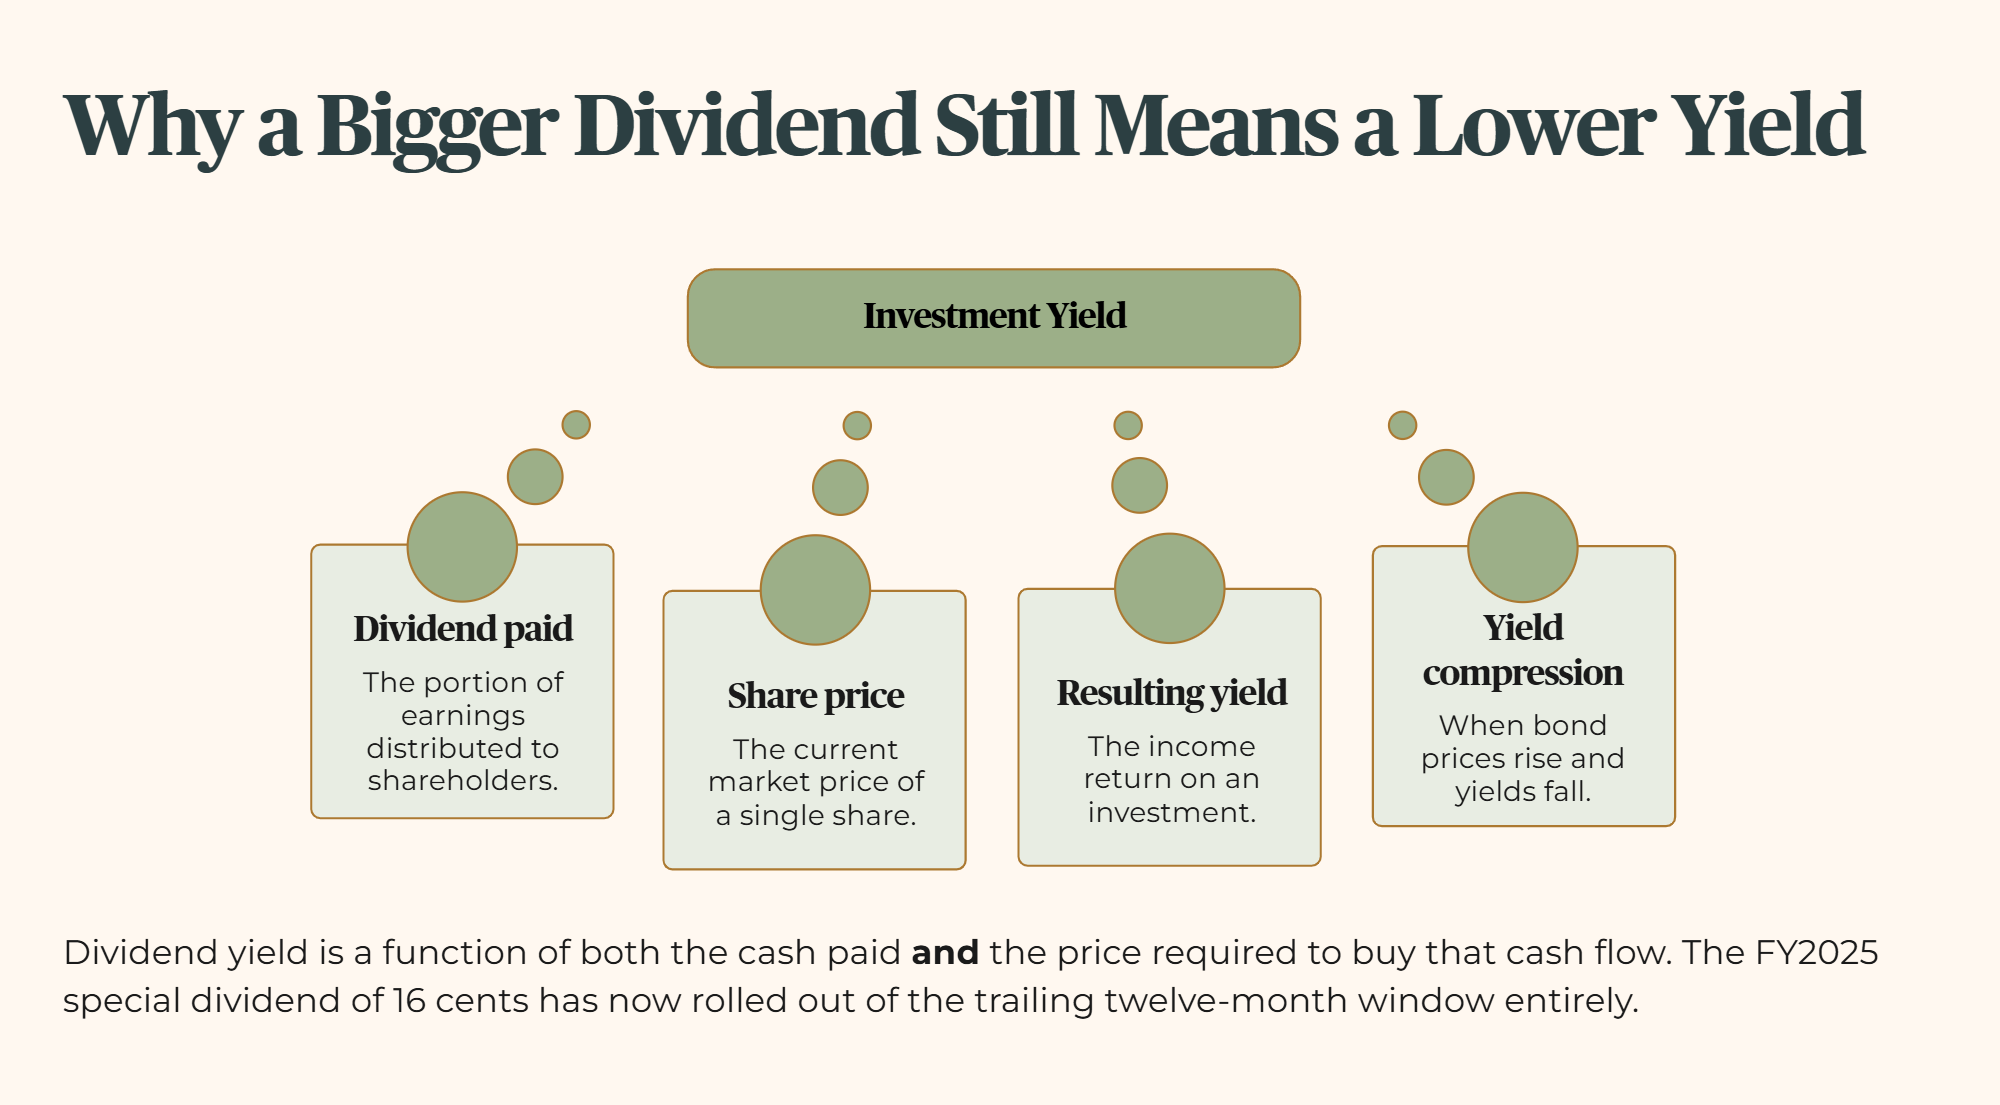
But dividend yield is a function of two things, the cash dividend paid and the price required to buy that cash flow. OCBC’s share price traded at S$30.30 on the report release day. Over the trailing twelve months, that means the 47-cent 1H26 interim dividend plus the 42-cent FY2025 final dividend, 89 cents in total. The FY2025 special dividend of 16 cents, paid in early 2025, has now rolled out of the trailing twelve-month window entirely.
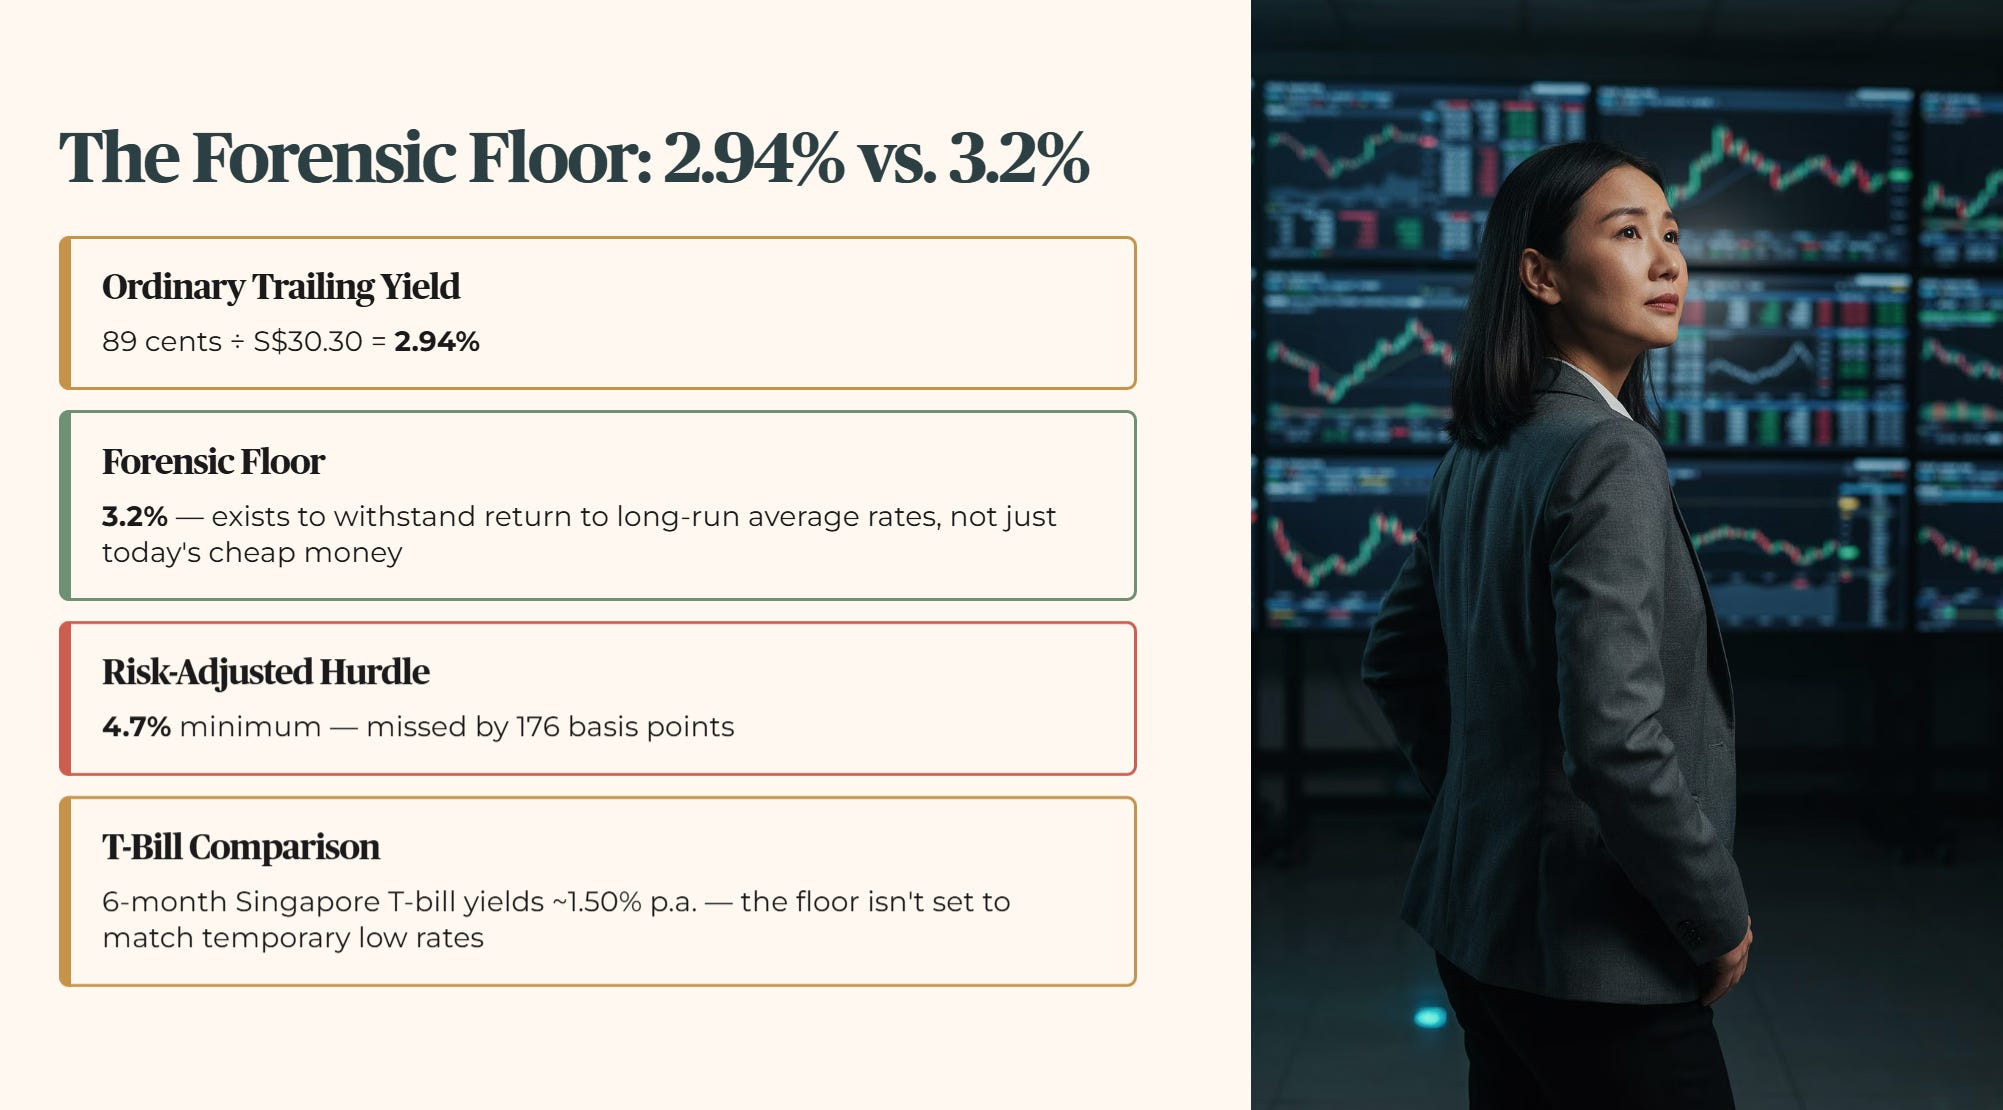
Eighty-nine cents against a S$30.30 share price works out to an ordinary trailing yield of 2.94%. That falls below my conservative forensic floor of 3.2%, and misses the 4.7% minimum risk-adjusted yield hurdle by 176 basis points. For comparison, the current 6-month Singapore T-bill (BS26113X, 2 Jul 2026 auction) yields approximately 1.50% per annum. I don’t lower my floor to match a temporary low-rate environment, my 3.2% floor exists specifically so that sanctuary-grade assets can withstand a return to long-run average interest rates, not just today’s cheap money conditions.
The 2.94% yield breaches the floor. The next calculation shows whether OCBC’s payout structure can realistically repair that gap.
