

OCBC Q1 2026: NIM Bleeds 5% While CET1 Stays 15.2%
And it’s not the 15.2% CET1 paying you. It’s volatile S$1,606m fees replacing S$2,222m lending

Total income hit a record high, but core lending profit silently bled out by 5 percent year-on-year. If you are relying on these dividends for your retirement, this shift from stable interest to volatile trading fees directly impacts your portfolio’s predictability. Here is the forensic audit of Oversea-Chinese Banking Corporation’s latest results, exposing the gap between the glossy headlines and the actual balance sheet mechanics.
My job is simple, even if the balance sheet is not. I read the numbers that the headline skips — the interest coverage, the gearing, the free cash flow sustainability — so that the Singaporean building or living off a dividend portfolio gets the same forensic clarity that institutional money takes for granted.

In This Article:
The Slide-by-Slide Audit
The Reality Check
The Scorecard
The Forward Outlook
The Red Flags Were Always There
Forensic Synthesis
Iggy’s Forensic Disclaimer
The Slide-by-Slide Audit
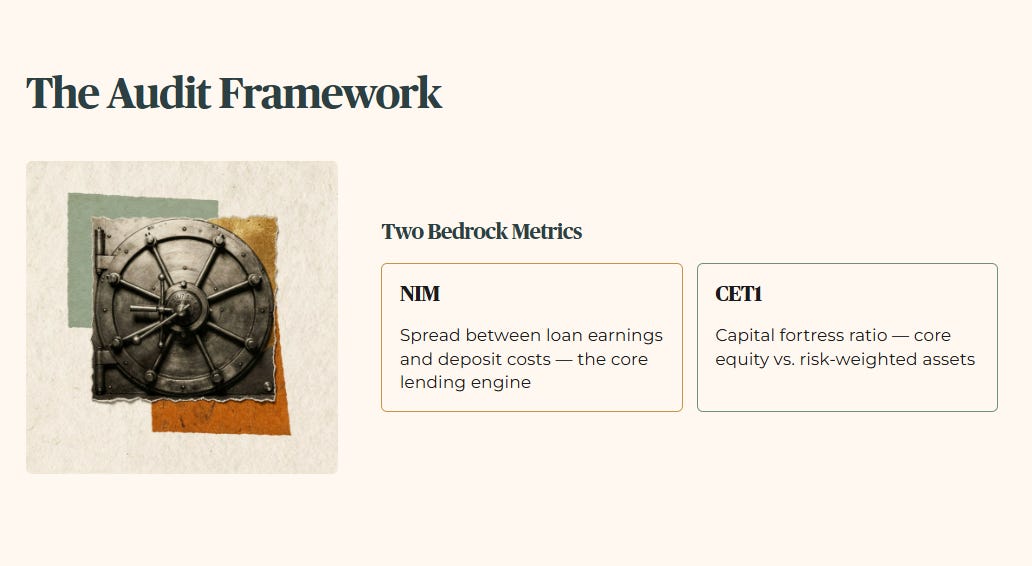
The industry filter for banking structures mandates that we lead with the Net Interest Margin (NIM) and the Common Equity Tier 1 (CET1) ratio. NIM is the spread between what the bank earns on loans and what it pays on deposits — the core engine of a traditional lending bank. CET1 is the capital fortress ratio, measuring the bank’s core equity against its risk-weighted assets. These two metrics form the absolute bedrock of a bank’s ability to generate cash and protect itself from systemic collapse.
The raw fact on NIM is a severe one. Net Interest Margin compressed to 1.76 percent, driving a 5 percent year-on-year decline in Net Interest Income (the total dollar earnings from lending activity) down to 2,222 million dollars. Prior period Net Interest Income was 2,345 million dollars, recorded at a margin of 2.04 percent in the first quarter of 2025. When we look at peer context, DBS Group Holdings (SGX: D05) also faces significant interest rate headwinds but maintains a higher baseline margin due to its specific deposit base structure. Running a forward scenario on this data reveals a bleak trajectory for lending. If the 3-month SORA benchmark — the Singapore interbank rate that determines borrowing costs across the system — drops by another 10 percent, Net Interest Income will contract further. This will force the bank to rely completely on fee-based businesses to cover the shortfall. For a 55-year-old Singaporean managing an SRS portfolio, the wallet impact is stark: this signals a fundamental transition from highly predictable loan income to less predictable, market-dependent fee income.
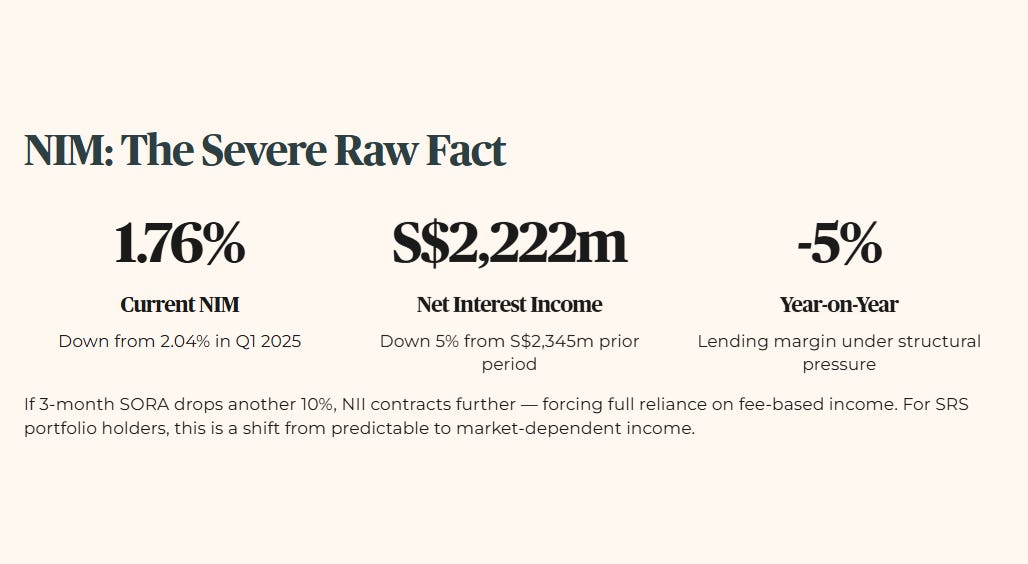
Think of NIM as the gross profit margin of a hawker stall. It is the difference between what the hawker earns from selling chicken rice and what he pays for the ingredients. When the cost of chicken goes up and he cannot raise the plate price, the margin disappears. OCBC faces the same structural squeeze — rates on new loans are falling, but deposit costs cannot be cut fast enough to compensate.
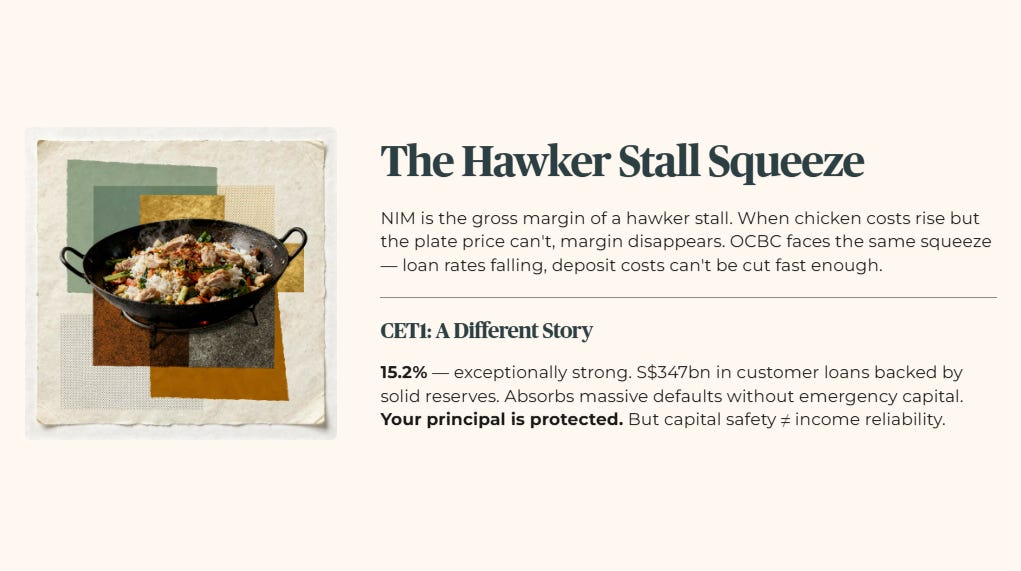
The capital fortress tells a different story entirely. OCBC reported a fully phased-in CET1 Capital Adequacy Ratio of 15.2 percent. This is an exceptionally strong figure, representing 347 billion dollars in customer loans backed by solid reserves. Historically, this remains stable compared to 15.5 percent a year ago. Compared to regional peers, OCBC consistently holds one of the most conservative capital buffers in the entire ASEAN banking system. In a forward scenario where a global recession triggers a wave of loan defaults, this 15.2 percent buffer means the bank can absorb massive losses without needing to cut dividends drastically or raise emergency capital. Your principal is exceptionally well protected by this capital wall. But — and this is the forensic distinction that matters — capital safety is not the same as income reliability. We will return to that point.
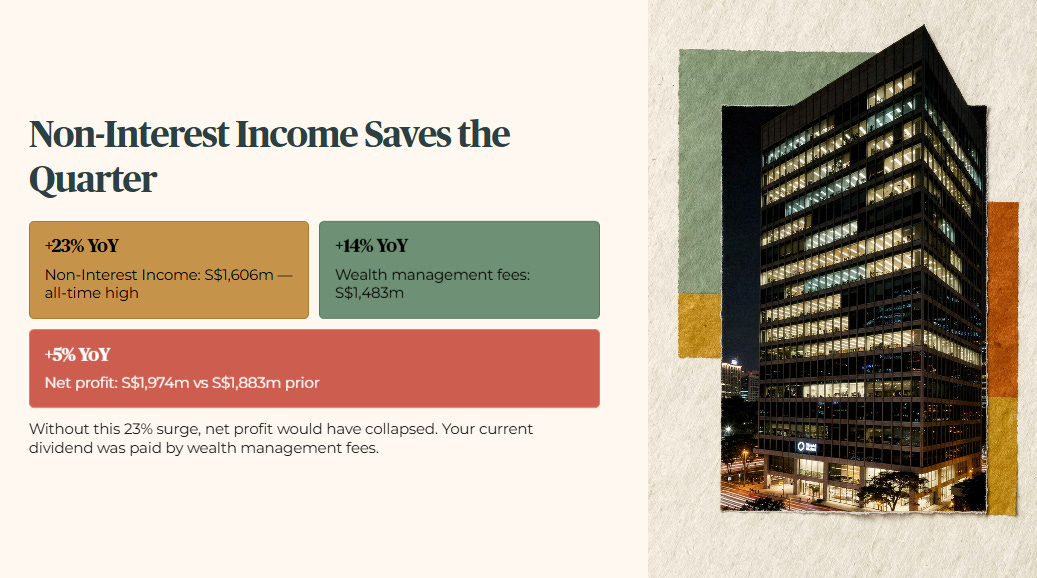
The shortfall in lending was rescued by Non-Interest Income. Non-Interest Income rose 23 percent year-on-year to 1,606 million dollars, hitting an all-time high, up from a prior period baseline of 1,310 million dollars. Wealth management fees were the primary driver, surging 14 percent year-on-year to 1,483 million dollars across both banking and insurance platforms. For the heartland investor holding these shares for yield, this specific segment is what paid for your current dividend. Without this 23 percent surge, overall net profit would have collapsed. This dynamic drove headline net profit to 1,974 million dollars, up 5 percent from the prior period net profit of 1,883 million dollars.
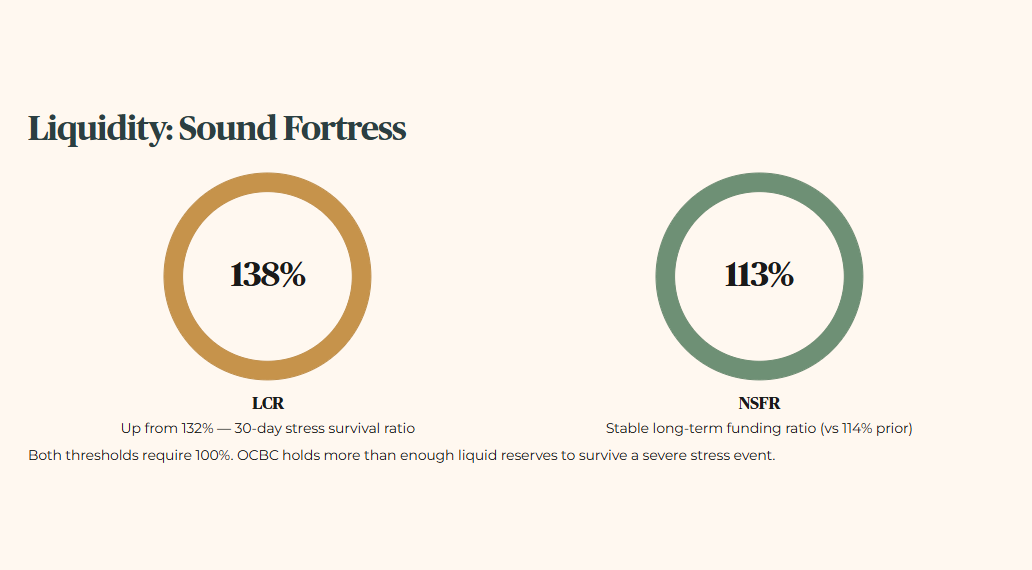
The liquidity position is sound. The Liquidity Coverage Ratio (LCR — the proportion of high-quality liquid assets the bank holds to survive a 30-day stress scenario) stands at 138 percent, improved from 132 percent a year prior. The Net Stable Funding Ratio (NSFR — the measure of stable long-term funding relative to long-term asset requirements) rests at 113 percent, marginally down from 114 percent a year ago. The bank holds more than enough liquid reserves to survive a severe stress event.
🦎 Iggy’s Insight Block 1
The single metric management spent the least time discussing was the exact composition of the 216 million dollars in allowances. They quietly noted these were mostly allowances for non-impaired assets, driven by “heightened macro uncertainties.” Why brush past this? Because they are using a stellar wealth management quarter to quietly build a massive war chest for a rainy day without alarming the market. When banks start stuffing cash under the mattress while simultaneously celebrating record top-line income, retail investors need to pay absolute attention. They are proactively preparing for a global economic storm that they are not talking about publicly. The forensic read: OCBC’s management is more cautious than their press release suggests — and that caution deserves respect.
The Reality Check
We must now contrast the management narrative of a record-breaking quarter with the cold, unfeeling math of the InvestingPro fair value model.
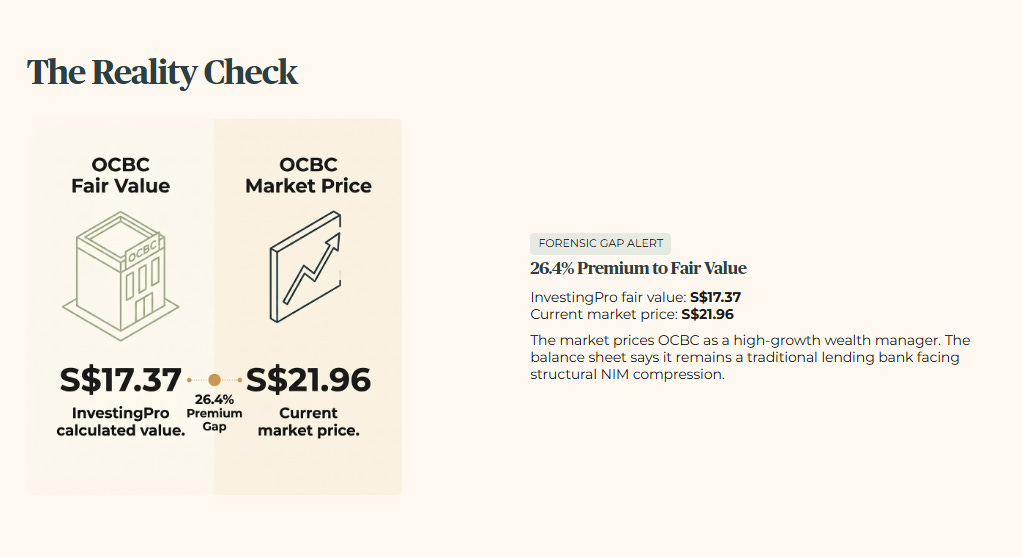
FORENSIC GAP ALERT. InvestingPro places OCBC’s fair value at 17 dollars and 37 cents, derived from an average of three valuation models. The current market price is 21 dollars and 96 cents. That is a 26.4 percent premium to assessed fair value. The market is pricing OCBC as a high-growth wealth manager. The forensic balance sheet says it remains, at its core, a traditional lending bank facing structural NIM compression.
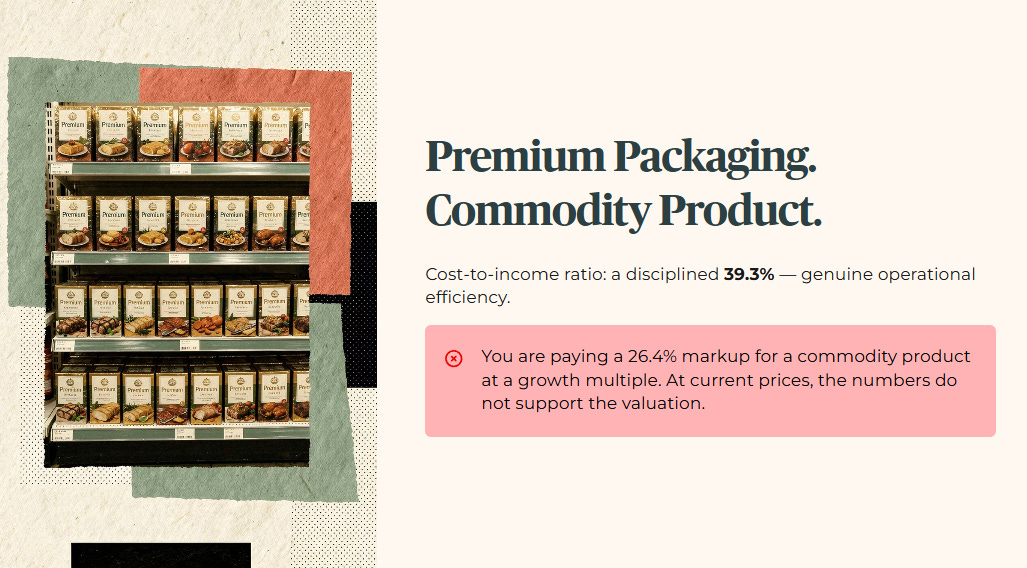
The bank’s cost-to-income ratio has been maintained at a highly disciplined 39.3 percent — genuine operational efficiency. But price is what you pay on the SGX terminal. Value is the actual cash-generating power of the underlying asset. Think of it like buying a FairPrice item with premium packaging. The marketing tells you it is top-tier. But the ingredients list says otherwise. You are paying a 26.4 percent markup for a commodity product at a growth multiple. At current prices, the numbers do not support the valuation.
Once we run OCBC’s fair value against its current yield and hard 4.7 percent hurdle, the entire “record quarter” narrative flips from comforting headline to forensic overpricing alert.
