

ParkwayLife REIT 3Q 2025: Revenue is Up, Premium is Down—Is This the Entry Point?
Last year’s big question was whether PLife’s “crazy” 80%+ premium to NAV was justified. This year, the story has evolved. The new 3Q 2025 results are in, and the picture is much clearer.

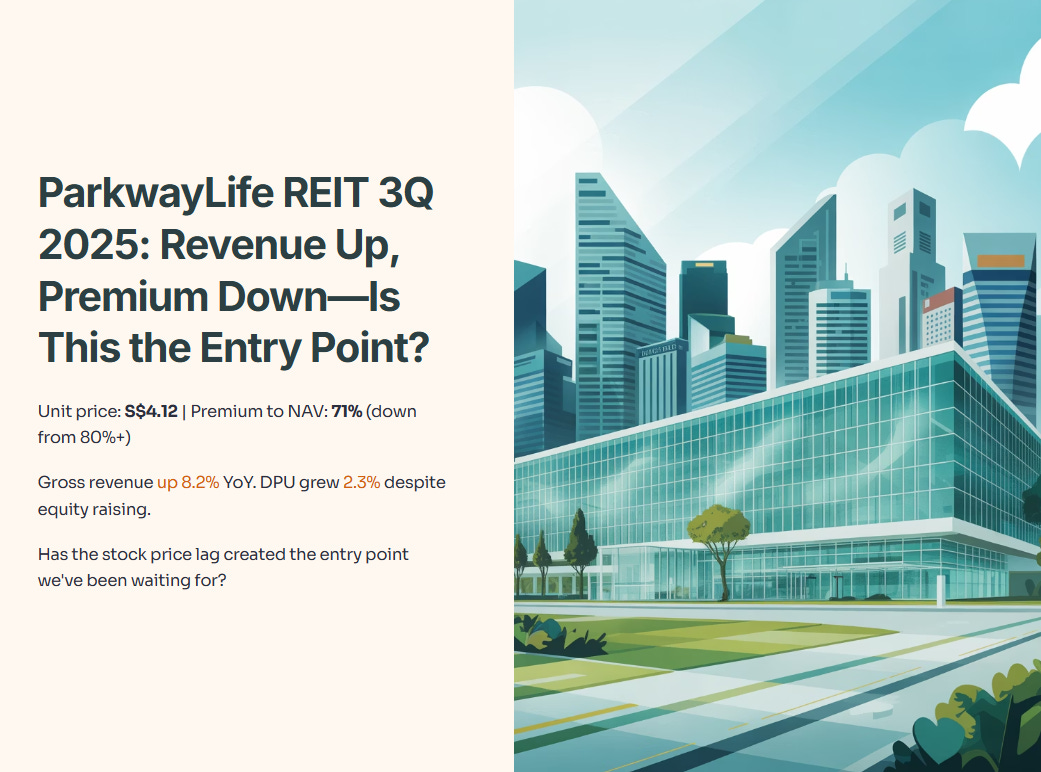
ParkwayLife’s unit price is S$4.12, and the premium to NAV has compressed to 71%. But here’s the kicker: this isn’t a story of a falling knife. This is a story of execution.
Gross revenue is up 8.2% year-on-year, driven by the new France acquisitions and Singapore’s step-up rents. DPU grew 2.3% even after the 2024 equity raising. The France portfolio is no longer a rounding error; it’s now contributing 7.5% of total revenue.
But it’s not all smooth sailing. Finance costs jumped 24.5%, and the all-in debt cost has crept up to 1.57%.
So, the new question is: With the growth strategy clearly working but costs visibly rising, has the recent stock price lag (underperforming the STI) created the entry point we’ve been waiting for?
In this deep dive, we’ll crack open ParkwayLife’s 3Q 2025 investor presentation dated 5 November 2025. We’ll walk through the key slides—breaking down the numbers, assessing the new risks, and giving you the actionable verdict Singapore investors need.
Just so you know you’re in good hands: The Investing Iguana just hit 1.3 million reads and 65,000 likes. We’re also thrilled to welcome over 30 YouTube Premium subscribers and 15 paid Substack members. On top of that, we landed 8th place in Tiger Brokers’ 2024 Influential Tigers ranking. Since October 2025, I’ve produced over 1,200 videos and more than 600,000 watch hours, always spanning regional and global trends for context. If you’re serious about navigating Singapore and regional markets—this is the right place.
In This Article:

• The “Housekeeping” Slides (Slides 1-4)
• [Slide 5: Key Highlights]
• [Slide 6: Opportunistic Asset Recycling & Risk Management]
• [Slide 7: Financial Performance (Divider)]
• [Slide 8: YTD 3Q 2025 Revenue and NPI Composition]
• [Slide 9: Consolidated Statements of Total Return]
• [Slide 10: Consolidated Statements of Financial Position]
• [Slide 11: Un-interrupted Recurring DPU Growth Since IPO]
• [Slide 12: Unit Price Relative Performance]
• [Slide 13: Strong Total Return Since IPO]
• [Slide 14: Property Portfolio (Divider)]
• [Slide 15: PLife REIT Portfolio]
• [Slide 16: PLife REIT Portfolio - Diversification]
• [Slides 17-18: Singapore Portfolio & Tenant]
• [Slide 17: Singapore Portfolio]
• [Slide 18: Operated by Master Lessee]
• [Slide 19: Singapore Portfolio - The Rent Jump]
• [Slides 20-24: Japan & France Portfolios]
• [Slide 20: Japan Portfolio]
• [Slide 21: Japan - Key Tenants]
• [Slide 22: France Portfolio]
• [Slide 23: Forging a... Partnership (DomusVi)]
• [Slide 24: Strategic Foray... (France Acq. Details)]
• [Slides 25-33: Strategy, Capital & Appendix]
• [Slide 26: PLife REIT’s Growth Strategy]
• [Slide 28: Multi-Pronged Growth Strategy]
• [Slide 30: Capital & Financial Management Strategy]
• [Slide 31: Debt Maturity Profile]
• [Slide 32: Debt Headroom]
• [Slide 33: Appendix (Divider)]
• Investor Guidance & Iggy’s Assessment
• Key Risks:
• Key Opportunities:
• Iggy’s Recommendation: ACCUMULATE / BUY
• Strategic Implications for Singapore-Based Portfolios:
• Practical Next Steps:
• Premium CTA & Conclusion
PS: Due to the massive deep dive analysis of this article, I will exclude the original slides from Parkway Life REIT from this. You can download the original deck from right here. 🦎😊
The “Housekeeping” Slides (Slides 1-4)

[Slide 1: Cover and Overview]
[Slide 2: Disclaimer]
[Slide 3: Agenda]
[Slide 4: Key Highlights (Divider)]
We’ll breeze past the first four slides. They’re the standard Cover (Slide 1), the legal Disclaimer (Slide 2), the Agenda (Slide 3), and a title page for the Key Highlights (Slide 4). They confirm this is a pure-play healthcare REIT and tell us not to sue them.
Let’s jump straight to the meat on Slide 5.
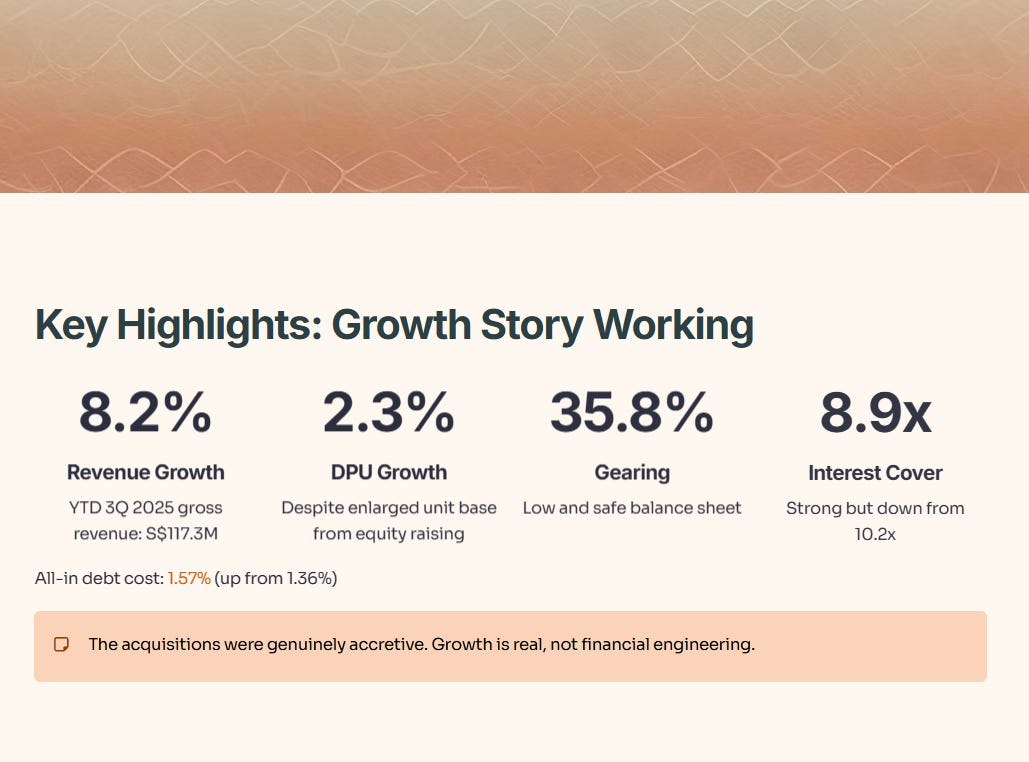
[Slide 5: Key Highlights]
What the Slide Says:
What It Means:
The growth story is working. Revenue is up 8.2%, thanks to the 2024 acquisitions in Japan and France, plus the Singapore hospital’s built-in rent step-up.
Crucially, DPU is up 2.3% despite the enlarged unit base from the 2024 equity raising. This means the acquisitions were genuinely accretive.
The balance sheet remains a fortress. Gearing is a very conservative 35.8%.
Why It Matters:
This slide proves the strategy is paying off. Last year, we hoped the France acquisition would work; this year, we see it in the top-line revenue growth. The 2.3% DPU growth might not sound sexy, but it’s “real” growth on a larger base, not just financial engineering.
Risk Watch:
Look closer. The “fortress” is costing more to maintain. The all-in debt cost has risen to 1.57% (from 1.36% last year). And the Interest Cover has dropped from 10.2x to 8.9x. This shows PLife isn’t immune to the high-rate environment—it’s just heavily shielded.
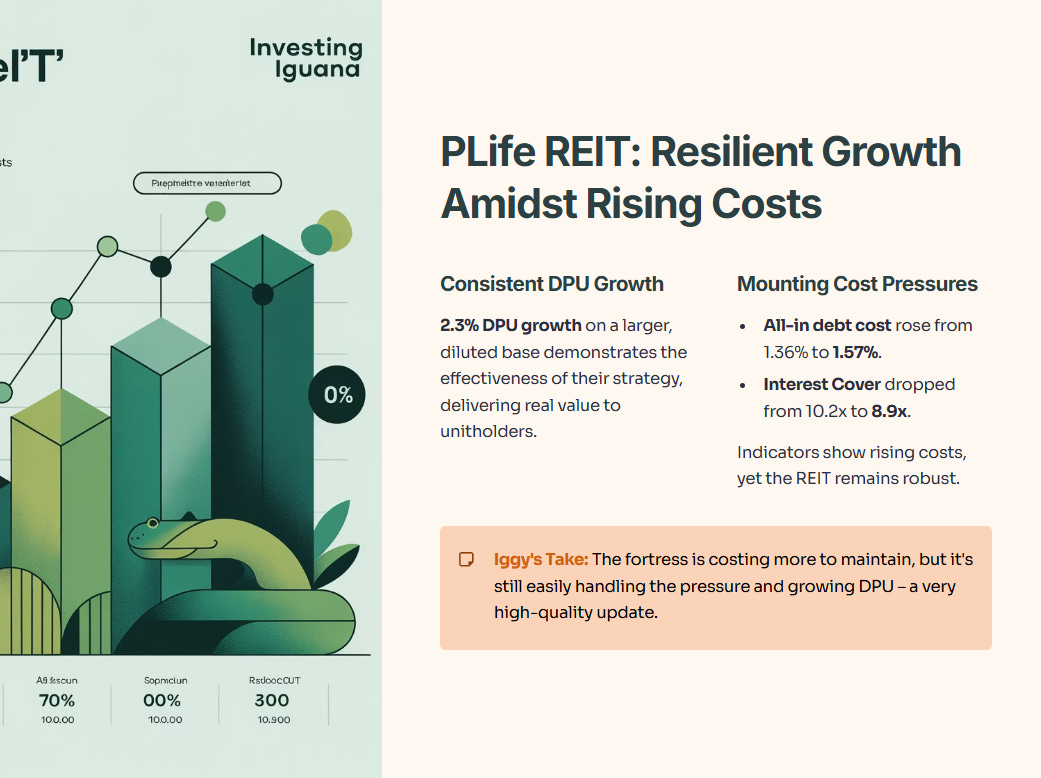
Iggy’s Insight: This is a high-quality update. The growth is now visible. The rising costs (1.57% debt) and falling cover (8.9x) are the new risks to monitor, but they are well within a safe range. The business is absorbing the rate hikes and still growing DPU.
[Slide 6: Opportunistic Asset Recycling & Risk Management]
What the Slide Says:
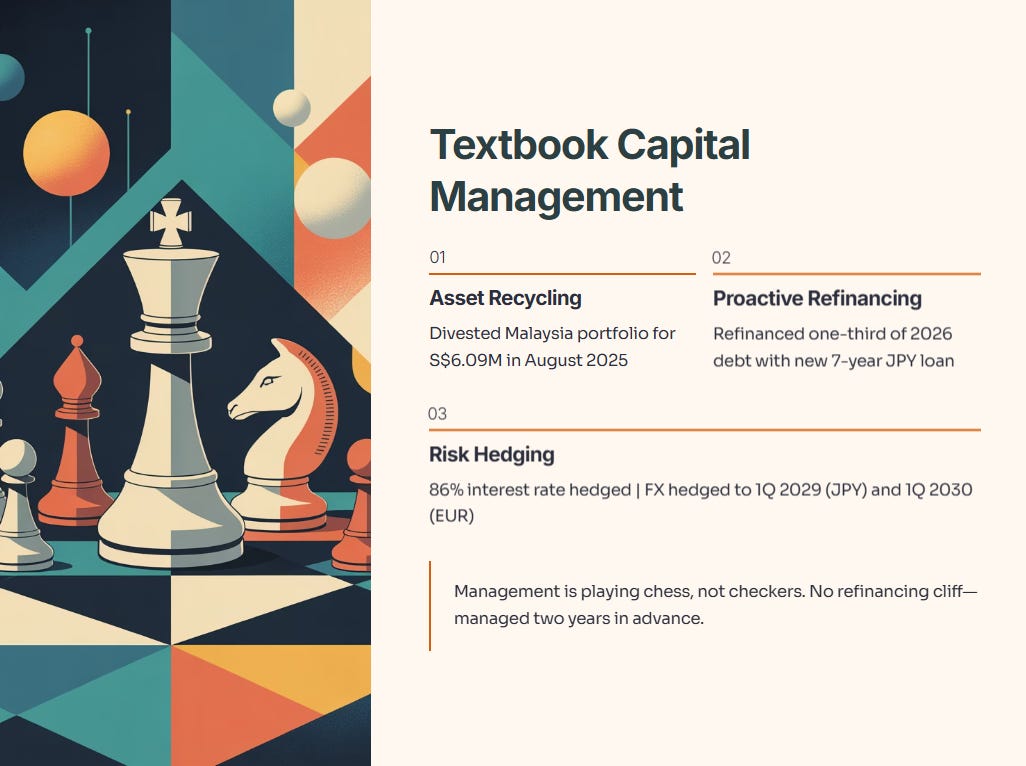
PLife has been busy. They divested their entire Malaysia portfolio for S$6.09 million in August 2025. They also proactively refinanced close to one-third of their 2026 debt with a new 7-year JPY loan. As a result, they have no long-term debt refinancing needs until October 2026. Their interest rate exposure is 86% hedged, and FX hedges are in place for JPY until 1Q 2029 and EUR until 1Q 2030.
What It Means:
This is textbook capital management. They sold a tiny, non-core asset in Malaysia to recycle capital. More importantly, they are already dealing with 2026’s debt, locking in JPY loans.
Why It Matters:
This is why you pay a premium for this REIT. Management is playing chess, not checkers. They don’t wait for a “refinancing cliff.” They manage it two years in advance.
Risk Watch:
The Malaysia divestment is a rounding error, so don’t read it as a major strategic shift. It’s just smart housekeeping.
Iggy’s Take: This is textbook. Selling the Malaysia portfolio is smart focus. Refinancing 2026 debt now is what they do. The balance sheet and risk management remain A+.
[Slide 7: Financial Performance (Divider)]
This is just a divider slide. Let’s get to the numbers.
[Slide 8: YTD 3Q 2025 Revenue and NPI Composition]
What the Slide Says:
The portfolio mix has changed.
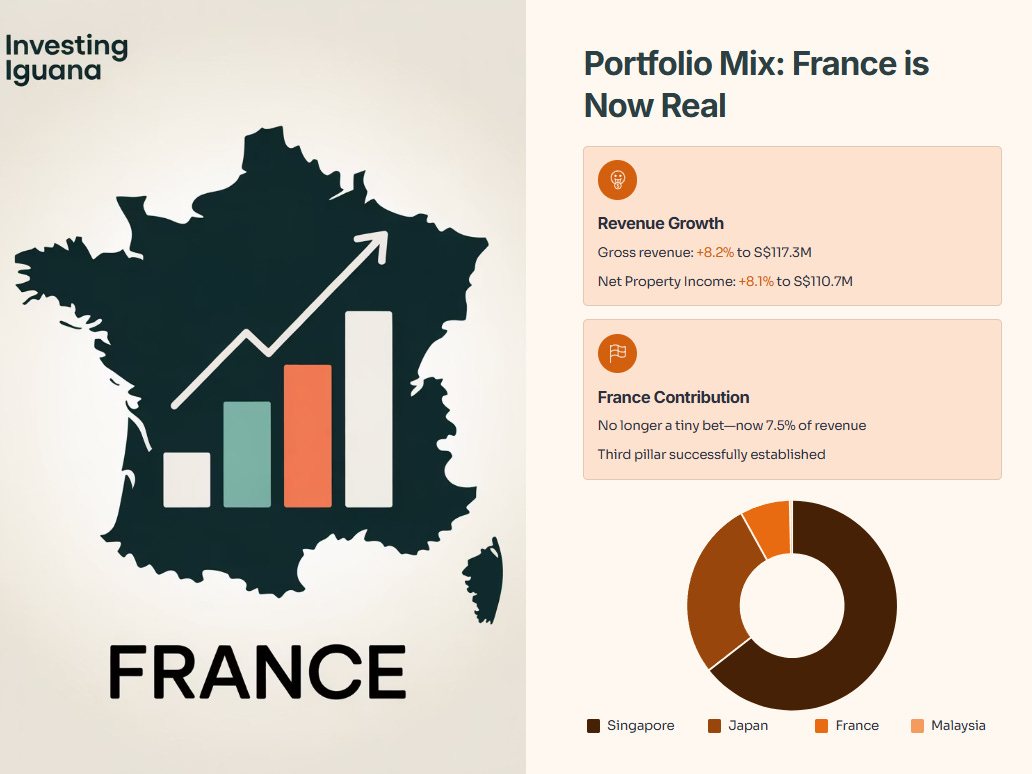
Singapore: 64.9% of Revenue
Japan: 27.5% of Revenue
France: 7.5% of Revenue
Malaysia: 0.1% (now divested)
Overall Gross Revenue grew 8.2% to S$117.3m, and Net Property Income (NPI) grew 8.1% to S$110.7m.
What It Means:
France is no longer a tiny bet; it’s a real, contributing third pillar, already providing 7.5% of revenue. The growth is clean and clear, coming from all three core markets.
Why It Matters:
This slide proves the 2024 diversification strategy worked. It de-risks the REIT from being purely a Singapore/Japan story. A marginal appreciation in the JPY also helped, a nice reversal from last year’s FX headaches.
Iggy’s Take: This is the “I told you so” slide from management. They executed the pivot to France, and it’s already delivering 7.5% of the revenue. This is exactly what we wanted to see.
[Slide 9: Consolidated Statements of Total Return]
What the Slide Says:
What It Means:
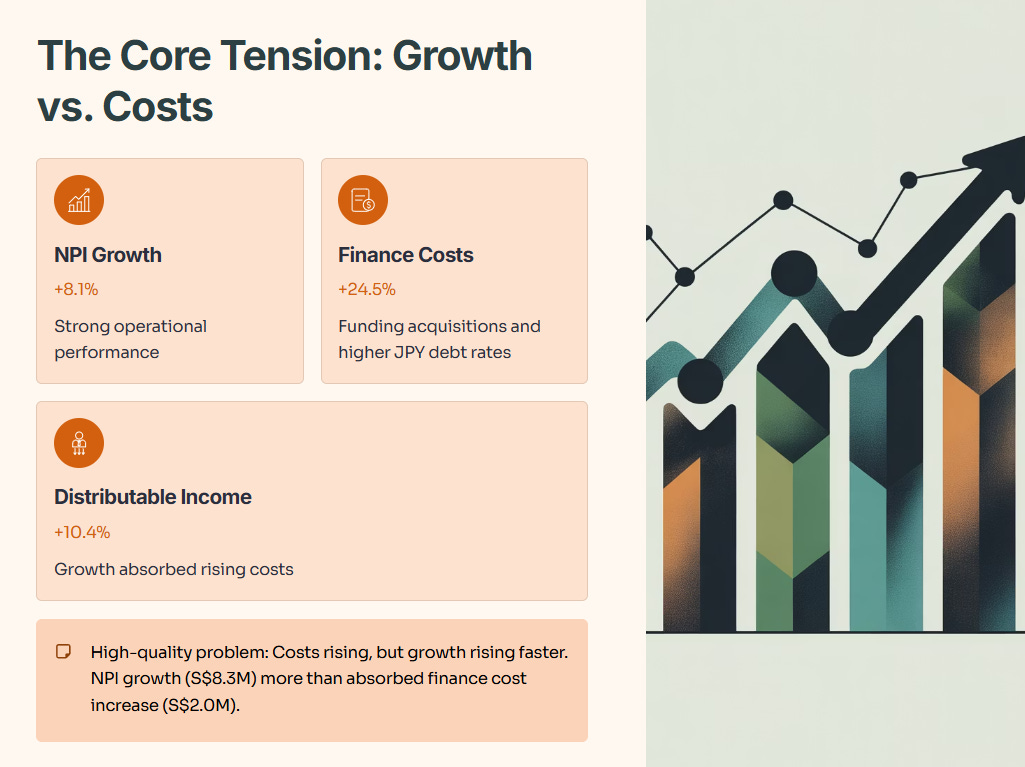
This is the core tension of the quarter. NPI growth (+8.1%) was robust, but Finance Costs spiked by 24.5%. This was due to funding the 2024 acquisitions and higher interest on JPY debt.
Why It Matters:
The 24.5% jump in finance costs is the new bogeyman. However, the business is growing faster. The NPI growth (S$8.3m) more than absorbed the rise in finance costs (S$2.0m). This strength allowed the Distributable Income to grow by a very strong 10.4%.
Iggy’s Take: This is a high-quality problem to have. Yes, costs are rising, but growth is rising faster. The fact that Distributable Income grew 10.4% shows they can easily handle the new debt costs. The 2.3% DPU growth is the final, positive result.
[Slide 10: Consolidated Statements of Financial Position]
What the Slide Says:
What It Means:
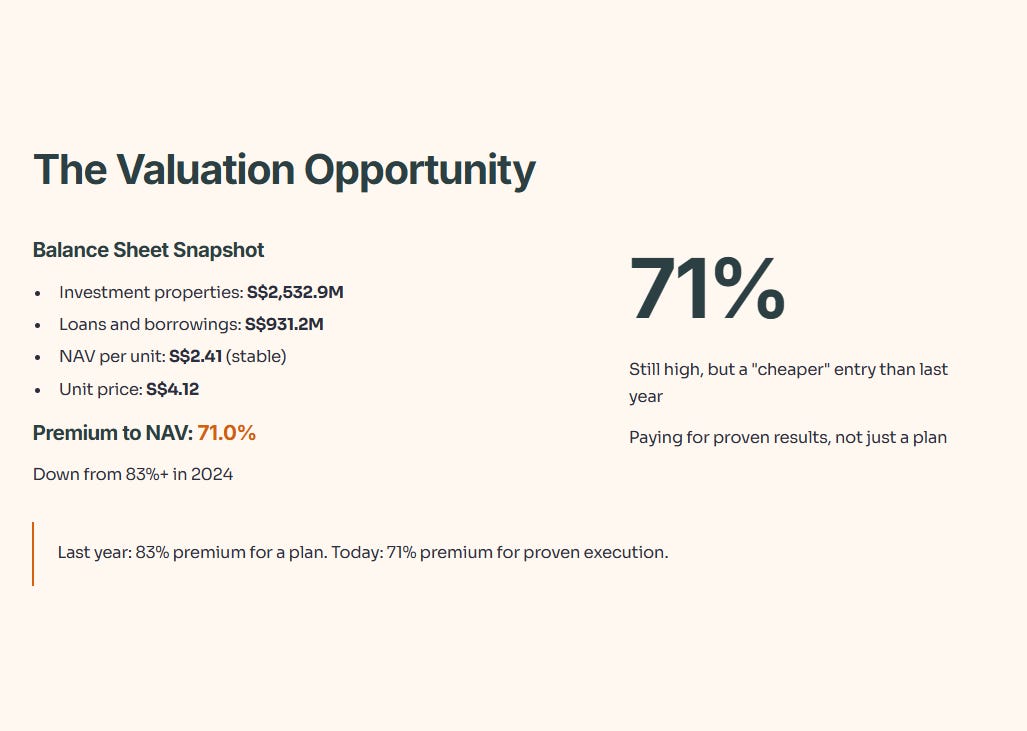
The asset base grew to S$2.53bn as the new acquisitions came online. NAV per unit held steady at S$2.41.
The crucial number: The unit price is S$4.12, representing a 71.0% premium to NAV.
Why It Matters:
The valuation is no longer at the “crazy” 80%+ levels we saw in 2024. A 71% premium is still very high, but it’s a “cheaper” entry point than last year, especially now that the growth story is proven.
Iggy’s Take: This is the opportunity. The market cooled off, but the business executed. Last year, you were paying an 83% premium for a plan. Today, you’re paying a 71% premium for a proven result. This is a much better deal.
[Slide 11: Un-interrupted Recurring DPU Growth Since IPO]
What the Slide Says:
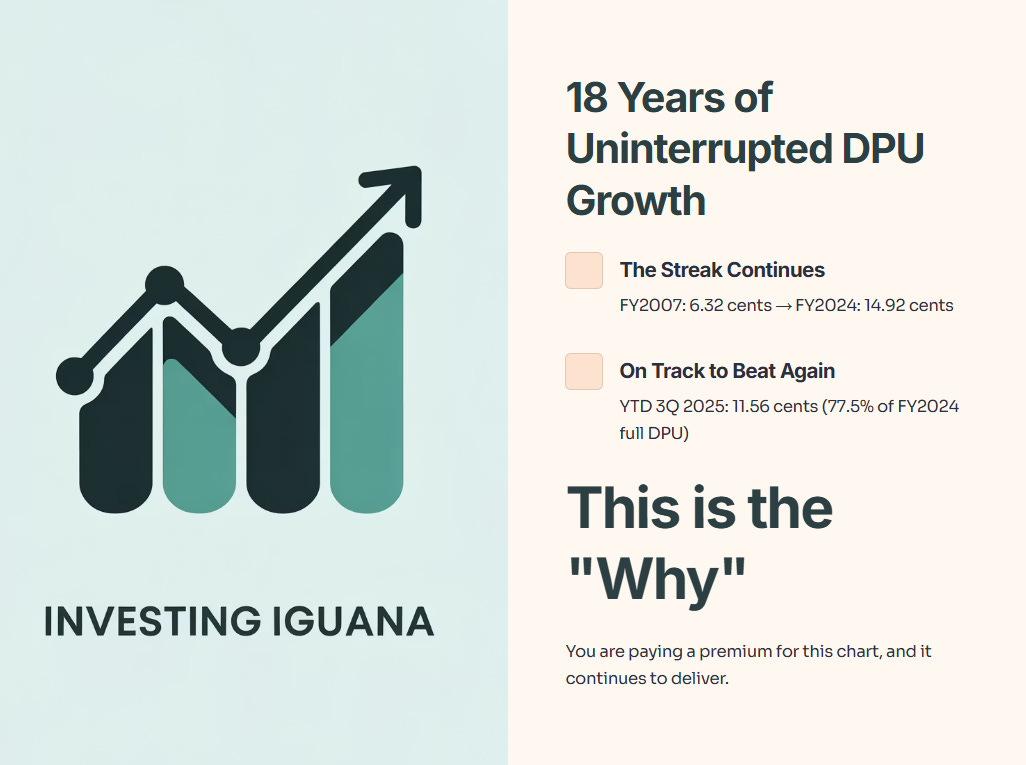
The beautiful chart continues. 18 years of uninterrupted DPU growth, from 6.32 cents in FY2007 to 14.92 cents in FY2024. The YTD 3Q 2025 DPU of 11.56 cents is 77.5% of last year’s full DPU, meaning they are on track to beat it again.
Iggy’s Take: This is the single most important slide. This is the “why.” The streak is alive and well. You are paying a premium for this chart, and it continues to deliver.
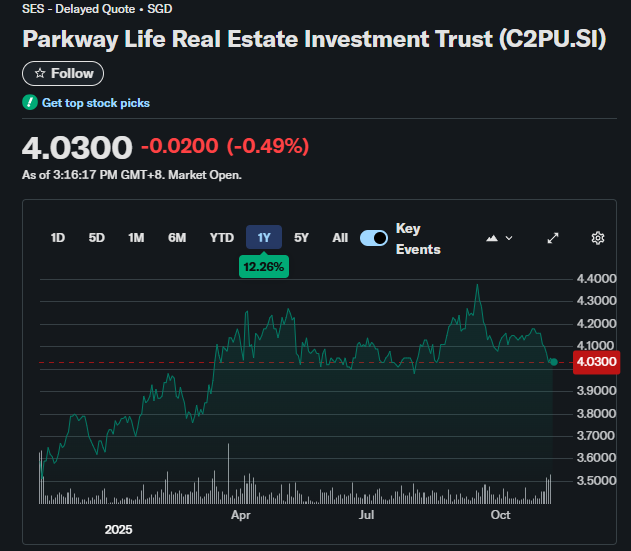
[Slide 12: Unit Price Relative Performance]
What the Slide Says:
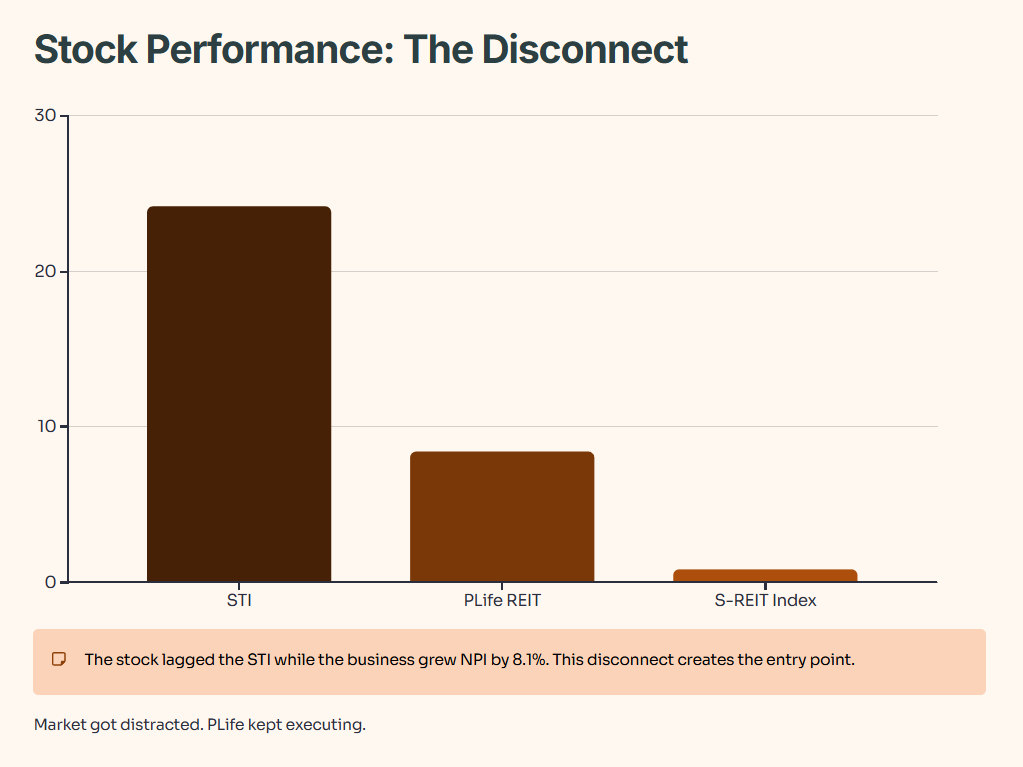
In the past year (Sep 2024 - Sep 2025), PLife REIT’s unit price grew 8.42%. This soundly beat the S-REIT Index (+0.81%) but dramatically lagged the STI’s +24.17% rally.
Why It Matters:
The stock took a breather. While the broader Singapore market (likely banks) rallied, PLife just plodded along, even as its own business was growing.
Iggy’s Take: This is perfect. The stock lagging the STI while the business grew NPI by 8.1% is exactly the disconnect that creates a good entry point. The market got distracted, while PLife kept executing.
[Slide 13: Strong Total Return Since IPO]
What the Slide Says:
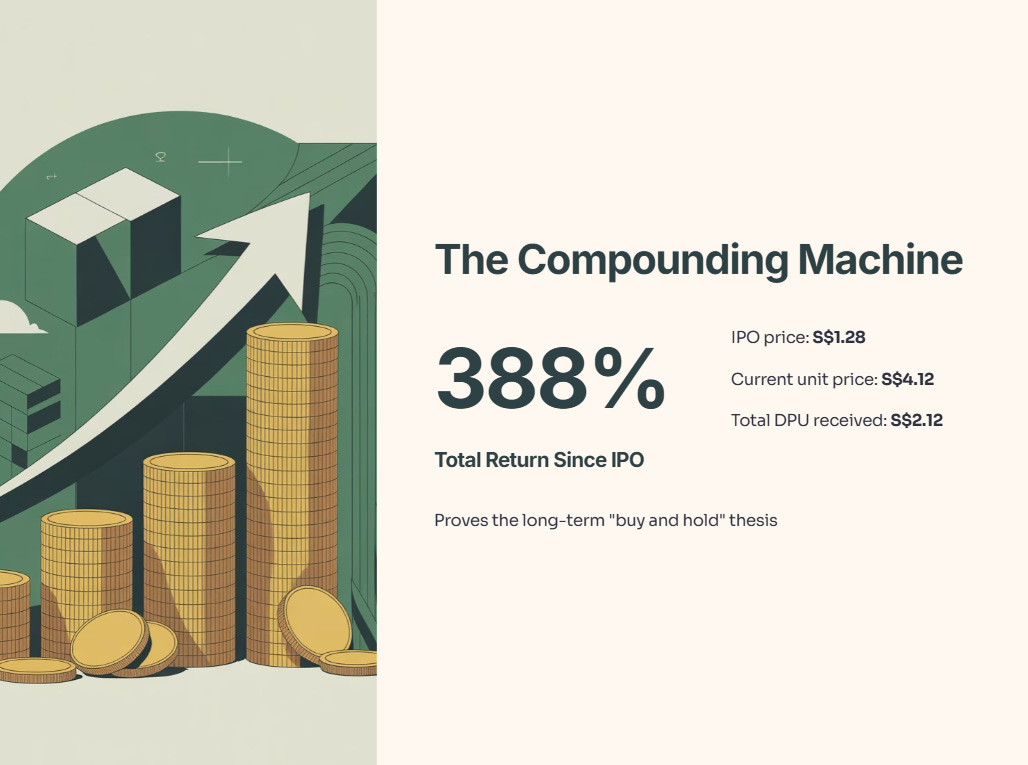
Total return since IPO is now 388%. An IPO price of S$1.28 has become S$4.12 in unit price, plus S$2.12 in total DPU received.
Iggy’s Take: The compounding machine continues to work. This proves the long-term “buy and hold” thesis.
[Slide 14: Property Portfolio (Divider)]
A divider slide. Let’s look at the assets.
[Slide 15: PLife REIT Portfolio]
What the Slide Says:
The portfolio is now 74 properties (up from 64) worth S$2.46 billion. The WALE (Weighted Average Lease Expiry) is 14.68 years.
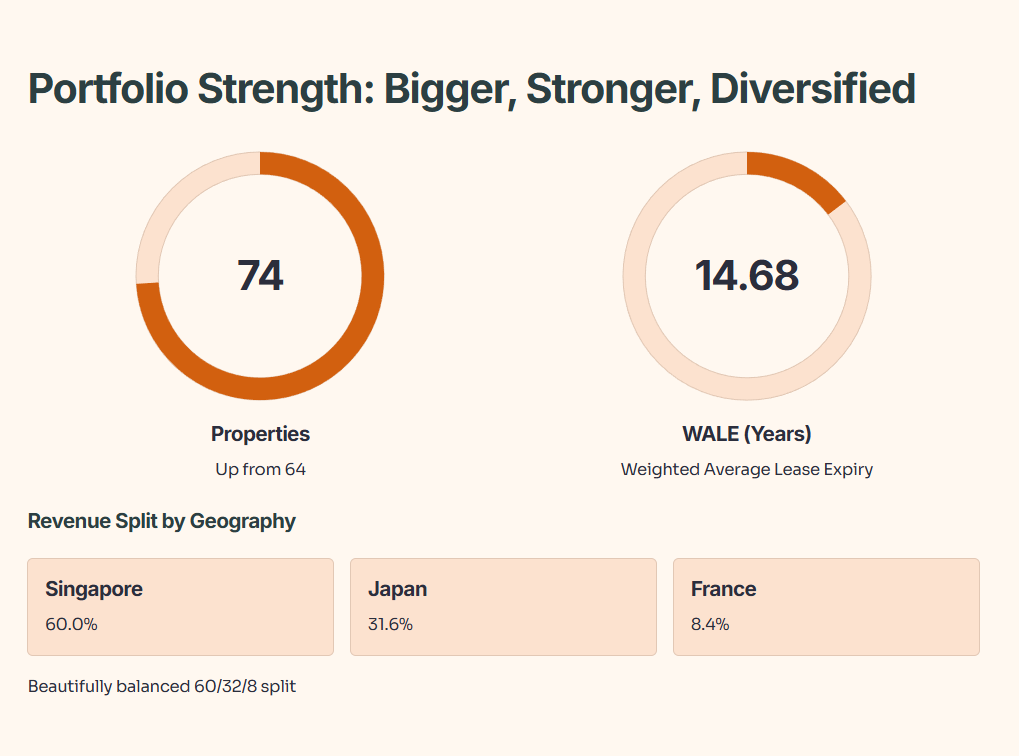
The new geographic split by gross revenue is:
Singapore: 60.0%
Japan: 31.6%
France: 8.4%
Why It Matters:
The portfolio is bigger, stronger, and more diversified. The WALE of 14.68 years is slightly down from last year (~15.8) but is still massively long-term. The 60/32/8 revenue split is beautifully balanced.
[Slide 16: PLife REIT Portfolio - Diversification]
What the Slide Says:
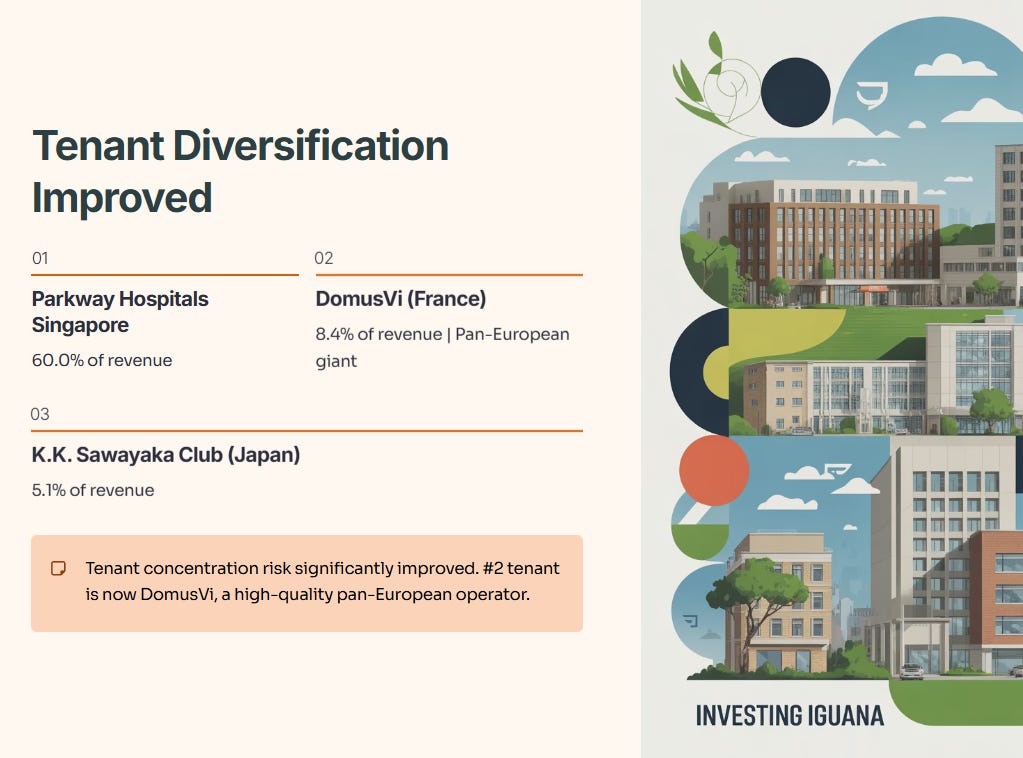
This slide breaks down the tenant base.
Top Tenant: Parkway Hospitals Singapore (60.0%)
New #2 Tenant: DomusVi (France) (8.4%)
New #3 Tenant: K.K. Sawayaka Club (Japan) (5.1%)
Iggy’s Take: This is a huge positive. The tenant concentration risk has improved. The #2 tenant is no longer a small Japanese operator but DomusVi, a pan-European giant. This is a high-quality, diversified income stream.
[Slides 17-18: Singapore Portfolio & Tenant]
[Slide 17: Singapore Portfolio]
[Slide 18: Operated by Master Lessee]
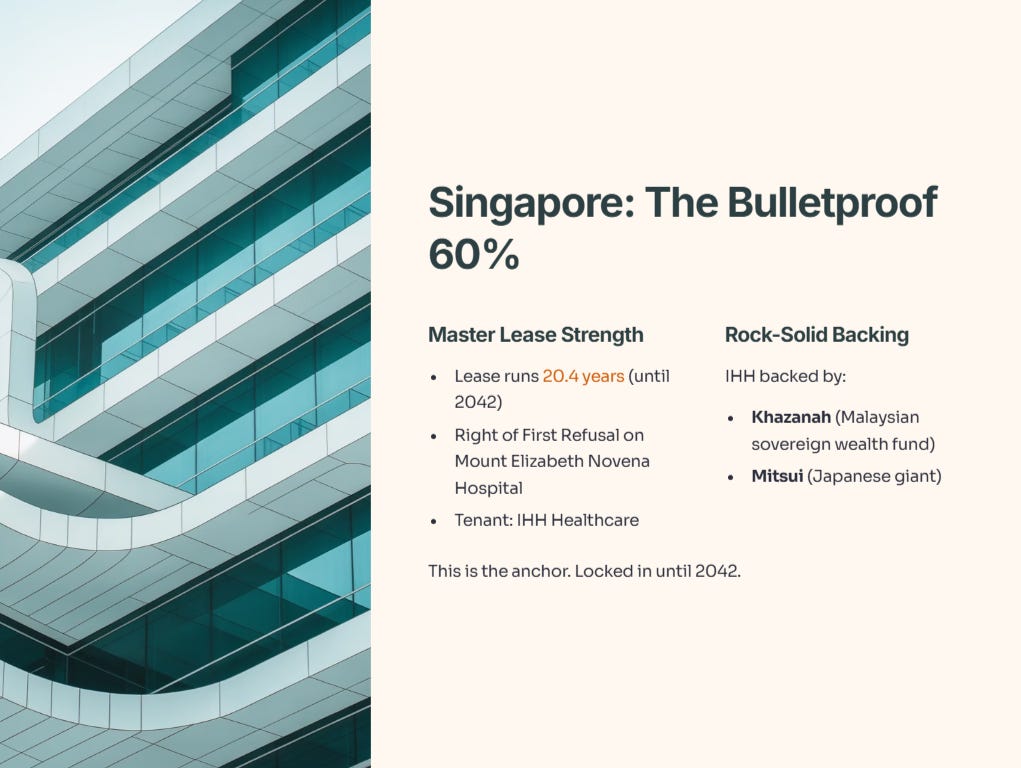
These slides reconfirm the strength of the Singapore assets. The key takeaways are:
The master lease runs for 20.4 years (until 2042).
PLife has a Right of First Refusal (ROFR) on the high-quality Mount Elizabeth Novena Hospital.
The tenant, IHH, is backed by Malaysian sovereign wealth fund Khazanah and Japanese giant Mitsui.
Iggy’s Take: This is the “bulletproof” 60% of the portfolio. The tenant is rock-solid. The lease is locked in until 2042. This is the anchor.
[Slide 19: Singapore Portfolio - The Rent Jump]
What the Slide Says:
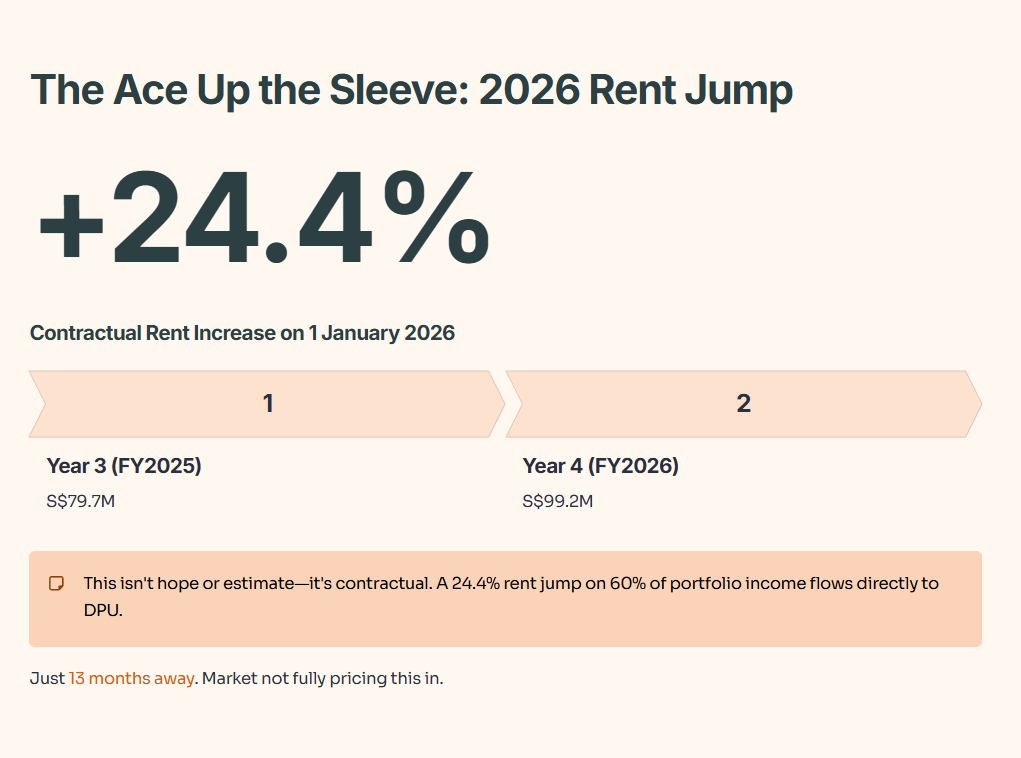
This is the “ace up the sleeve” slide, and it’s even more important now. It shows the actual and estimated rent for the Singapore hospitals.
Actual Year 3 (FY2025): S$79.7 million
Estimated Year 4 (FY2026): S$99.2 million
This is a contractual 24.4% rent increase that hits on 1 January 2026—just over a year from now.
Why It Matters:
This is the single biggest, most visible catalyst for the REIT. This isn’t a hope or an estimate. It’s contractual. A 24.4% rent jump on 60% of the portfolio’s income is going to flow directly to the bottom line and result in a significant DPU jump in 2026.
Iggy’s Take: We are now one year away from this massive, baked-in DPU boost. The market is still not fully pricing this in, as shown by the stock lagging the STI. This catalyst alone is a strong reason to buy.
[Slides 20-24: Japan & France Portfolios]
[Slide 20: Japan Portfolio]
[Slide 21: Japan - Key Tenants]
[Slide 22: France Portfolio]
[Slide 23: Forging a... Partnership (DomusVi)]
[Slide 24: Strategic Foray... (France Acq. Details)]
These slides detail the other 40% of the portfolio.
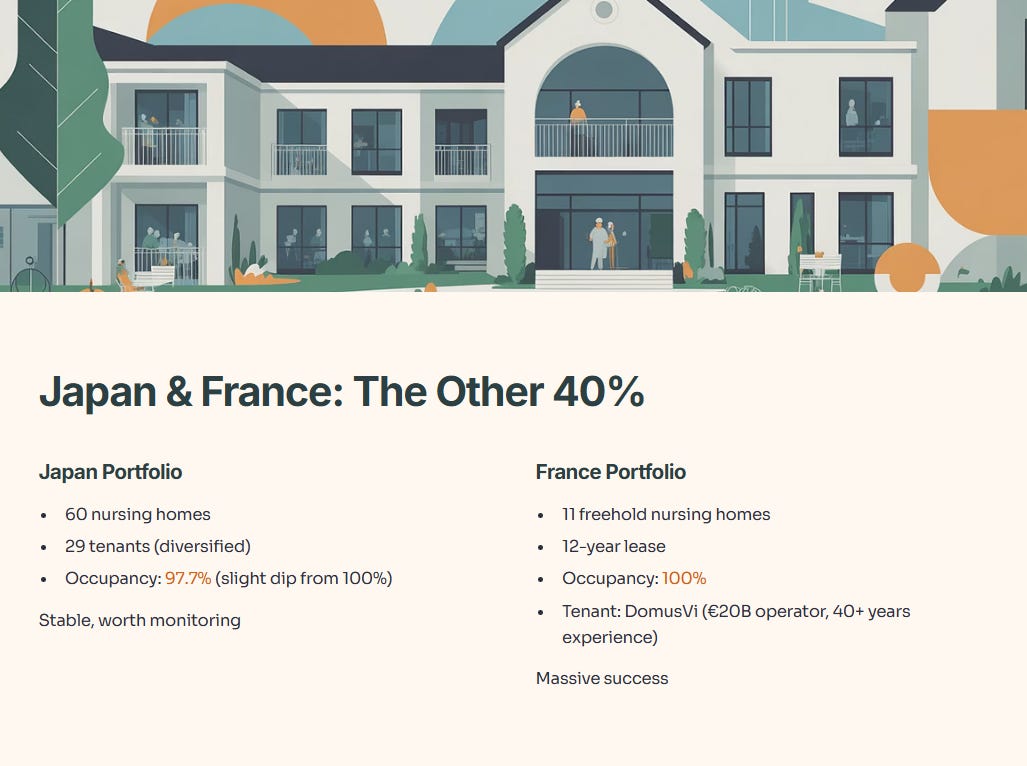
Japan: 60 high-quality nursing homes. The portfolio is diversified across 29 tenants. One new risk: occupancy has dipped slightly from 100% to 97.7%, which is worth monitoring but not alarming.
France: The new pillar. 11 freehold nursing homes, 100% occupied on a 12-year lease. The tenant, DomusVi, is a S$20bn pan-European behemoth with 40+ years of experience.
Iggy’s Take: The Japan portfolio is stable. The France portfolio is a massive success. They didn’t just buy assets; they partnered with a top-tier operator, locking in 100% occupancy for 12 years. This de-risks the growth story significantly.
[Slides 25-33: Strategy, Capital & Appendix]
[Slide 26: PLife REIT’s Growth Strategy]
[Slide 28: Multi-Pronged Growth Strategy]
[Slide 30: Capital & Financial Management Strategy]
[Slide 31: Debt Maturity Profile]
[Slide 32: Debt Headroom]
[Slide 33: Appendix (Divider)]
I’ll consolidate these as they confirm the “fortress” narrative.
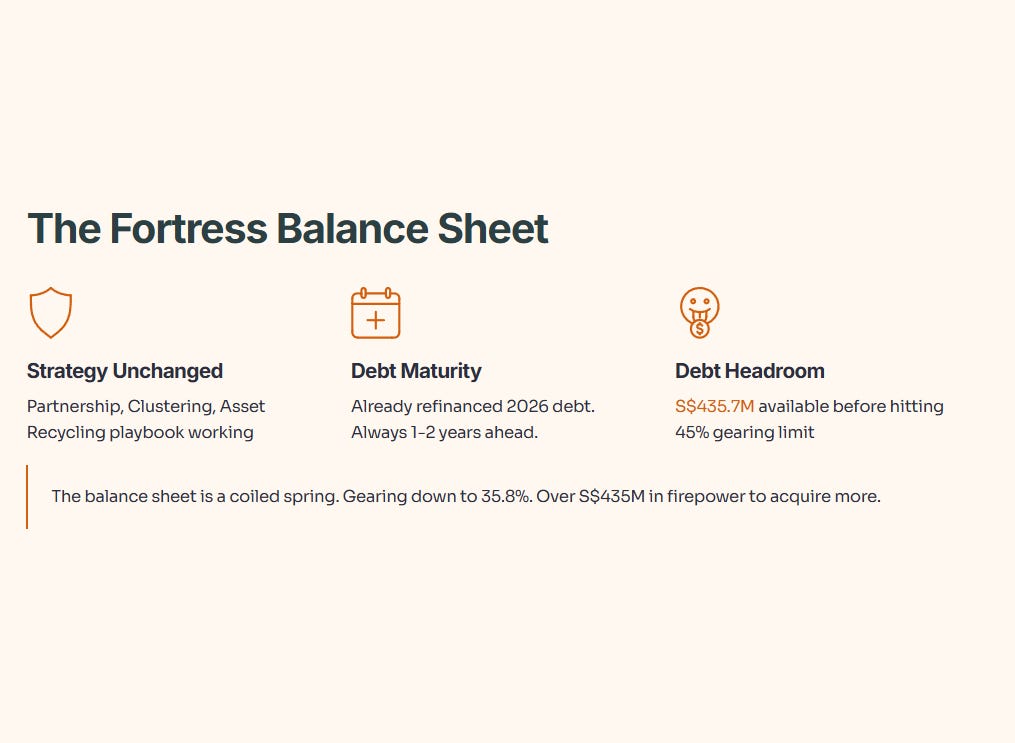
Strategy: The playbook (Partnership, Clustering, Asset Recycling) is unchanged because it’s working.
Debt Maturity: They’ve already refinanced a big chunk of 2026’s debt. They are always 1-2 years ahead.
Debt Headroom: Gearing is down to 35.8%. This gives them S$435.7 million in debt headroom before hitting the 45% limit.
Iggy’s Take: The balance sheet is a coiled spring. Gearing is low, and they have over S$435m in firepower to go shopping again.
Investor Guidance & Iggy’s Assessment
Let’s pull this all together. The story from 2024 to 2025 has improved dramatically.
