




RHB Says BUY on This 8.8% Yielder. The Balance Sheet Tells a Different Story.
Stoneweg Europe Stapled Trust clears the income bar with room to spare. Three separate balance sheet gates say otherwise.
RHB slapped a BUY rating on this REIT and a €1.90 price target, citing a clean pivot into logistics and data centres. Everyone reading the headline yield number is nodding along. The balance sheet underneath tells a very different story.

If you’re chasing the near-9% yield here purely for the income, I want you to see what’s propping it up before you commit fresh capital. If you’re already holding this one from an earlier entry, the picture looks different, and I’ll get to that. Either way, an analyst calling BUY doesn’t mean every gate in my own screen agrees, and today three of them don’t.

RHB Says BUY on This 8.8% Yielder. The Balance Sheet Tells a Different Story.
The Analyst’s Case
Iggy’s Forensic Screen
The Dividend Trajectory
The Forensic Gap
What To Watch Next
Closing
The Analyst’s Case
RHB Research maintained its BUY call on Stoneweg Europe Stapled Trust (SGX:SET) on 20 August 2026, retaining an unchanged price target of €1.90.
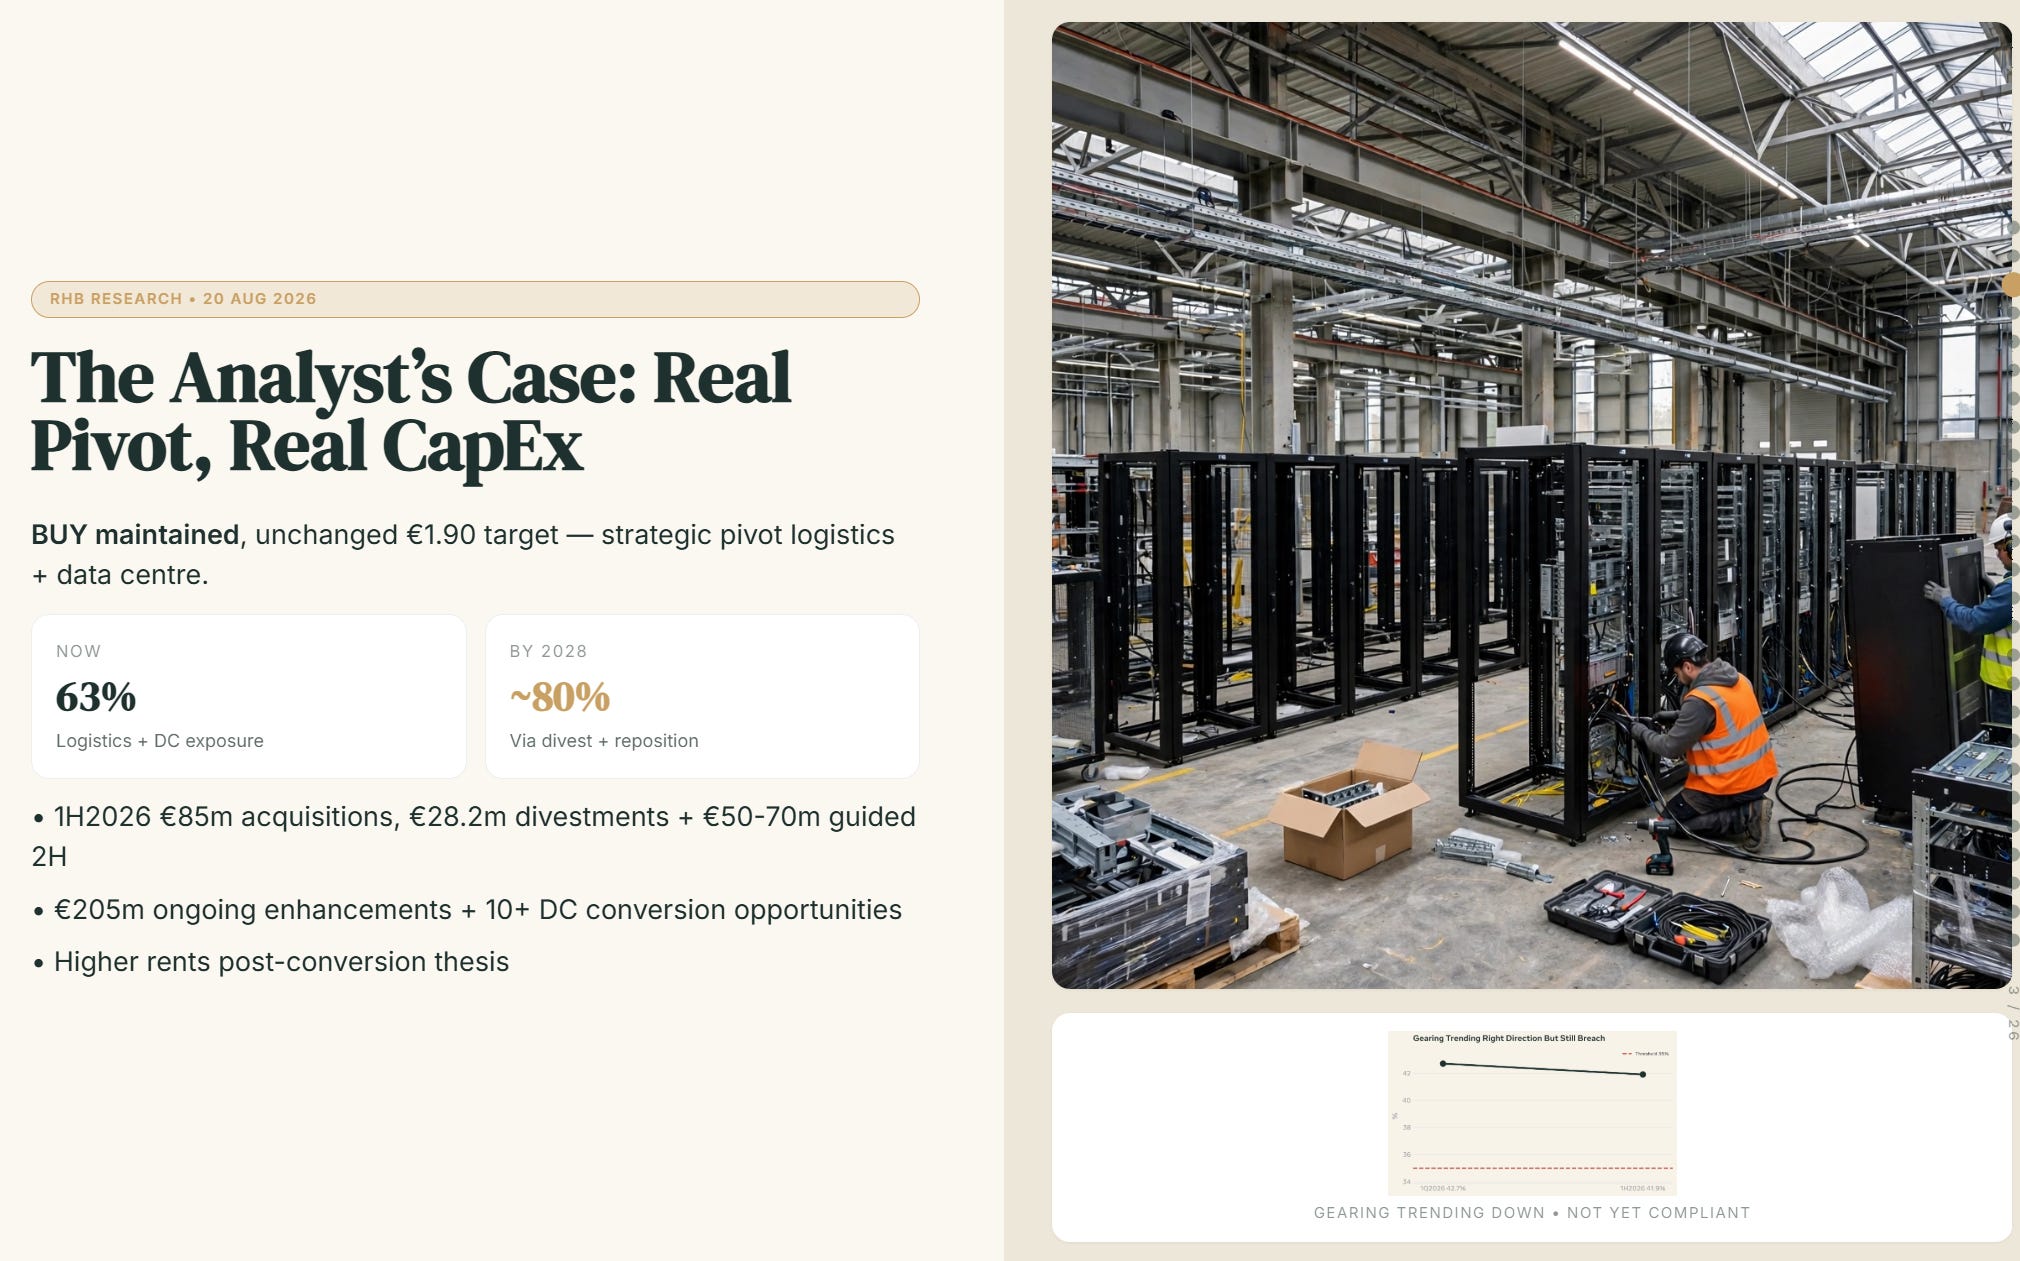
The call rests on a genuine strategic pivot. The trust’s logistics and data centre weighting currently sits around 63% of the portfolio, and management has guided toward roughly 80% by 2028, through a mix of divestments, repositioning, and acquisitions. Over 1H2026 the trust completed €85 million in acquisitions and €28.2 million in divestments, with a further €50 million to €70 million in divestments guided for 2H2026.

RHB also points to €205 million in ongoing asset enhancement initiatives and more than 10 identified opportunities to convert existing assets into data centres, a category commanding materially higher rents than the office and light industrial space it would replace.

The other piece of RHB’s thesis is internalisation. The trust is in talks with sponsor SWI Group across three areas: management arrangement changes, fee incentive restructuring, and potential internalisation of the manager itself, ahead of the master property and portfolio management agreement’s November 2027 renewal date. RHB views a resulting transaction as likely accretive to both DPU and NAV, with an announcement possible by the fourth quarter of 2026, subject to unitholder approval.
THE LOAD-BEARING ASSUMPTION: RHB’s case depends on the transformation executing on schedule, the data centre conversions materialising at attractive yields, and the internalisation talks landing favourably for minority unitholders, all while the balance sheet carries the strain of getting there. Nothing in RHB’s excerpt addresses whether the REIT can absorb that strain under my own thresholds in the meantime. That’s the gap this screen exists to check.
Iggy’s Forensic Screen
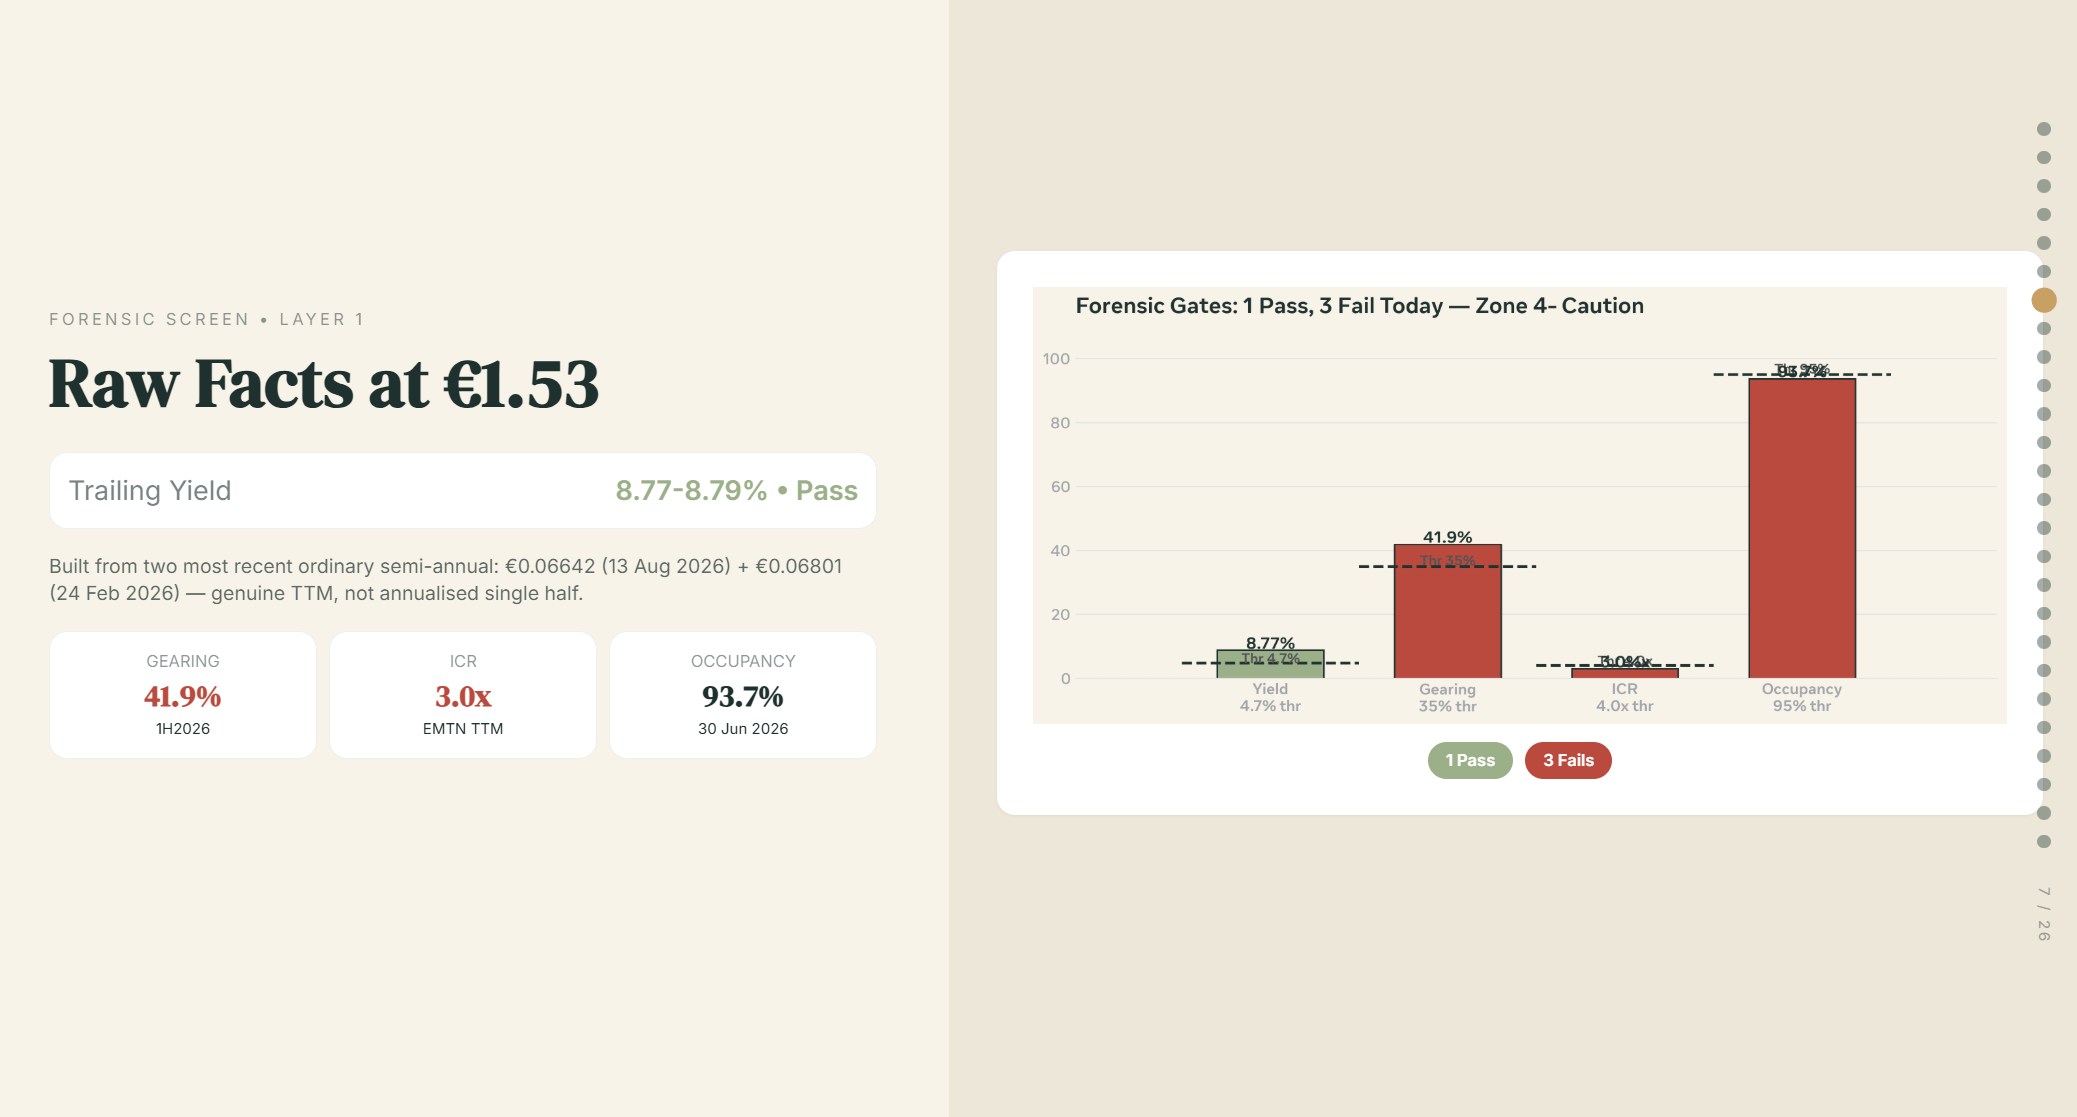
Layer 1, Raw Fact. At €1.53 (26 Aug 2026), trailing yield sits at 8.77% to 8.79% depending on rounding, built from the two most recent ordinary semi-annual distributions (€0.06642 declared 13 Aug 2026, €0.06801 declared 24 Feb 2026), a genuine trailing-twelve-month calculation rather than an annualised single half. Gearing, per the manager’s own 1H2026 disclosure, is 41.9%. Interest coverage, on the manager’s reported EMTN programme methodology, is 3.0x trailing twelve months. Occupancy is 93.7% as at 30 June 2026.
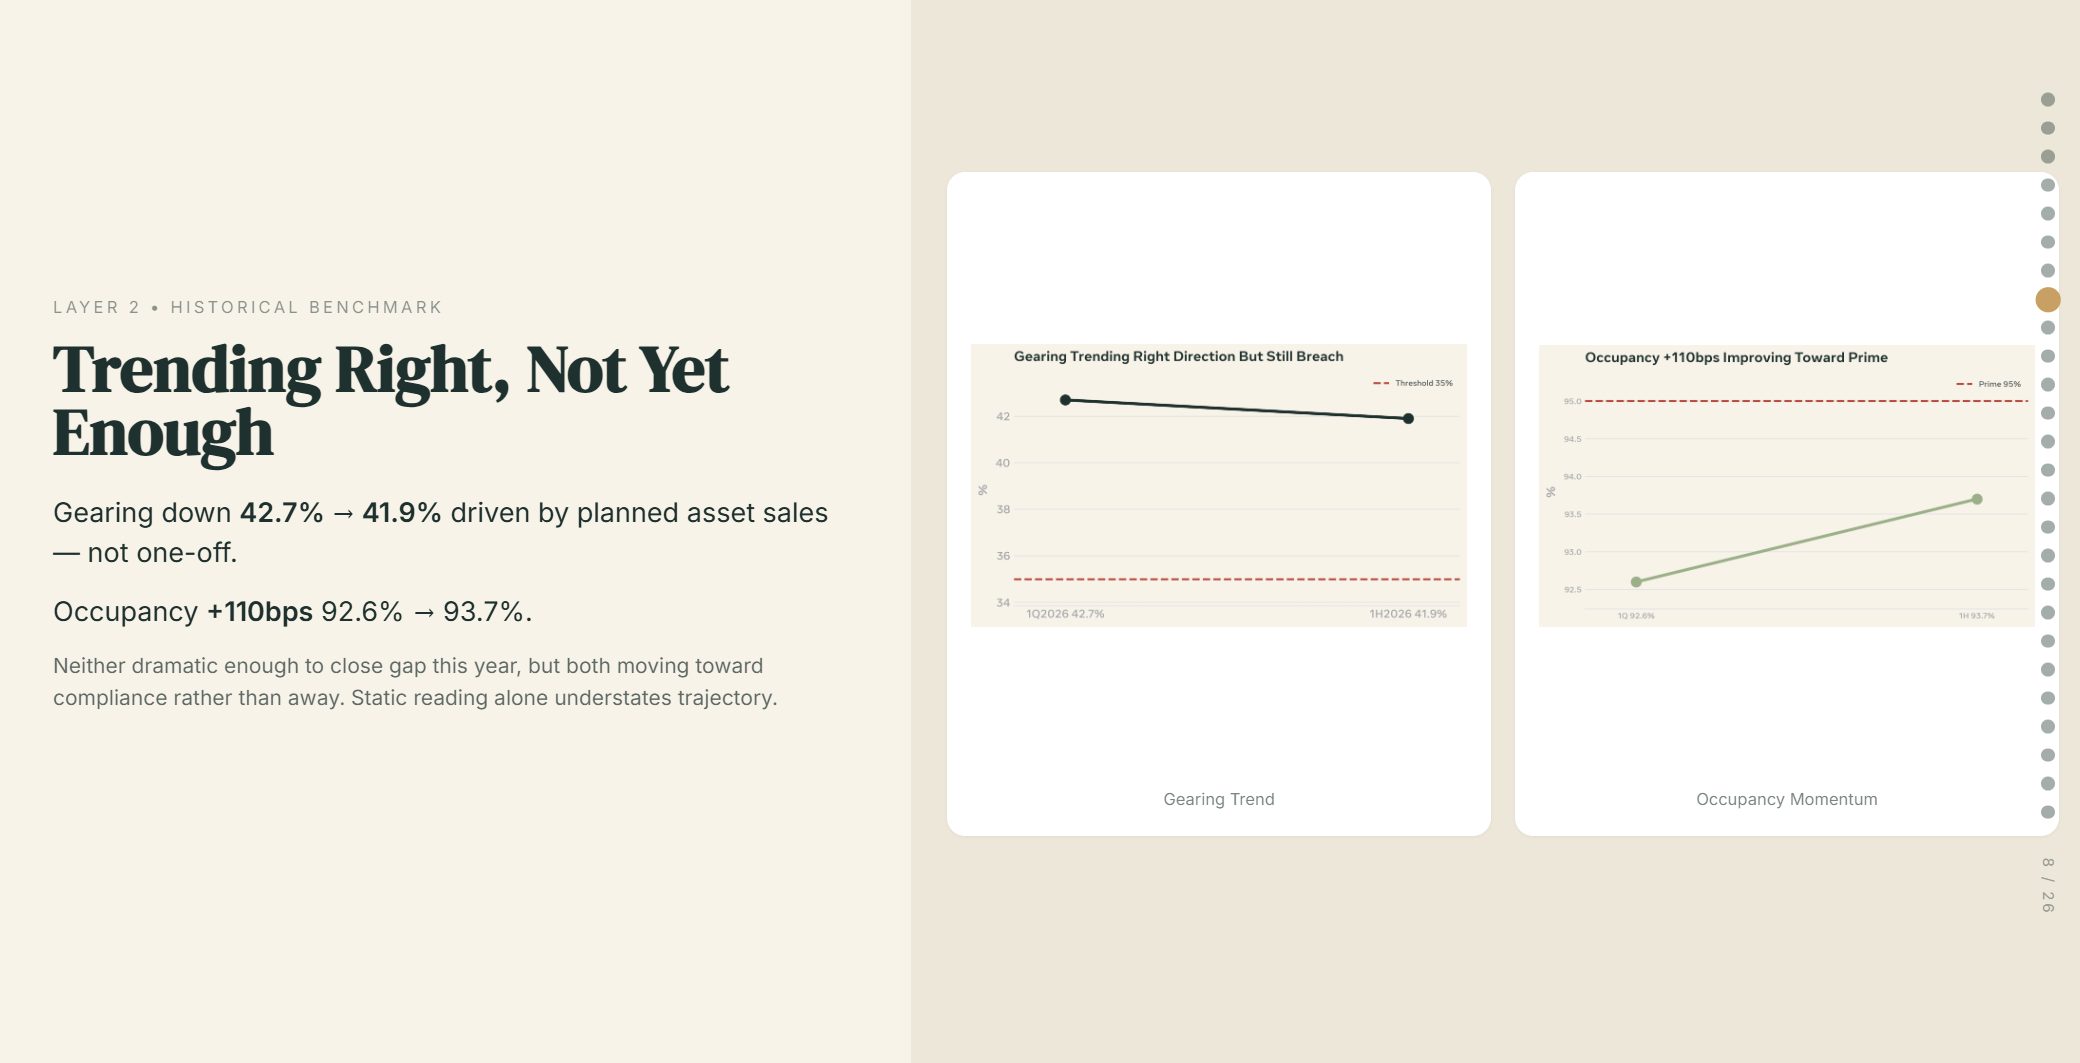
Layer 2, Historical Benchmark. Gearing is trending the right direction, down from 42.7% at 1Q2026 to 41.9% at 1H2026, driven by planned asset sales rather than a one-off. Occupancy improved 110 basis points over the same window, from 92.6% to 93.7%. Neither trend is dramatic enough to close the gap to the relevant threshold this year, but both are moving toward compliance rather than away from it, worth stating plainly since a static reading alone would understate the trajectory.
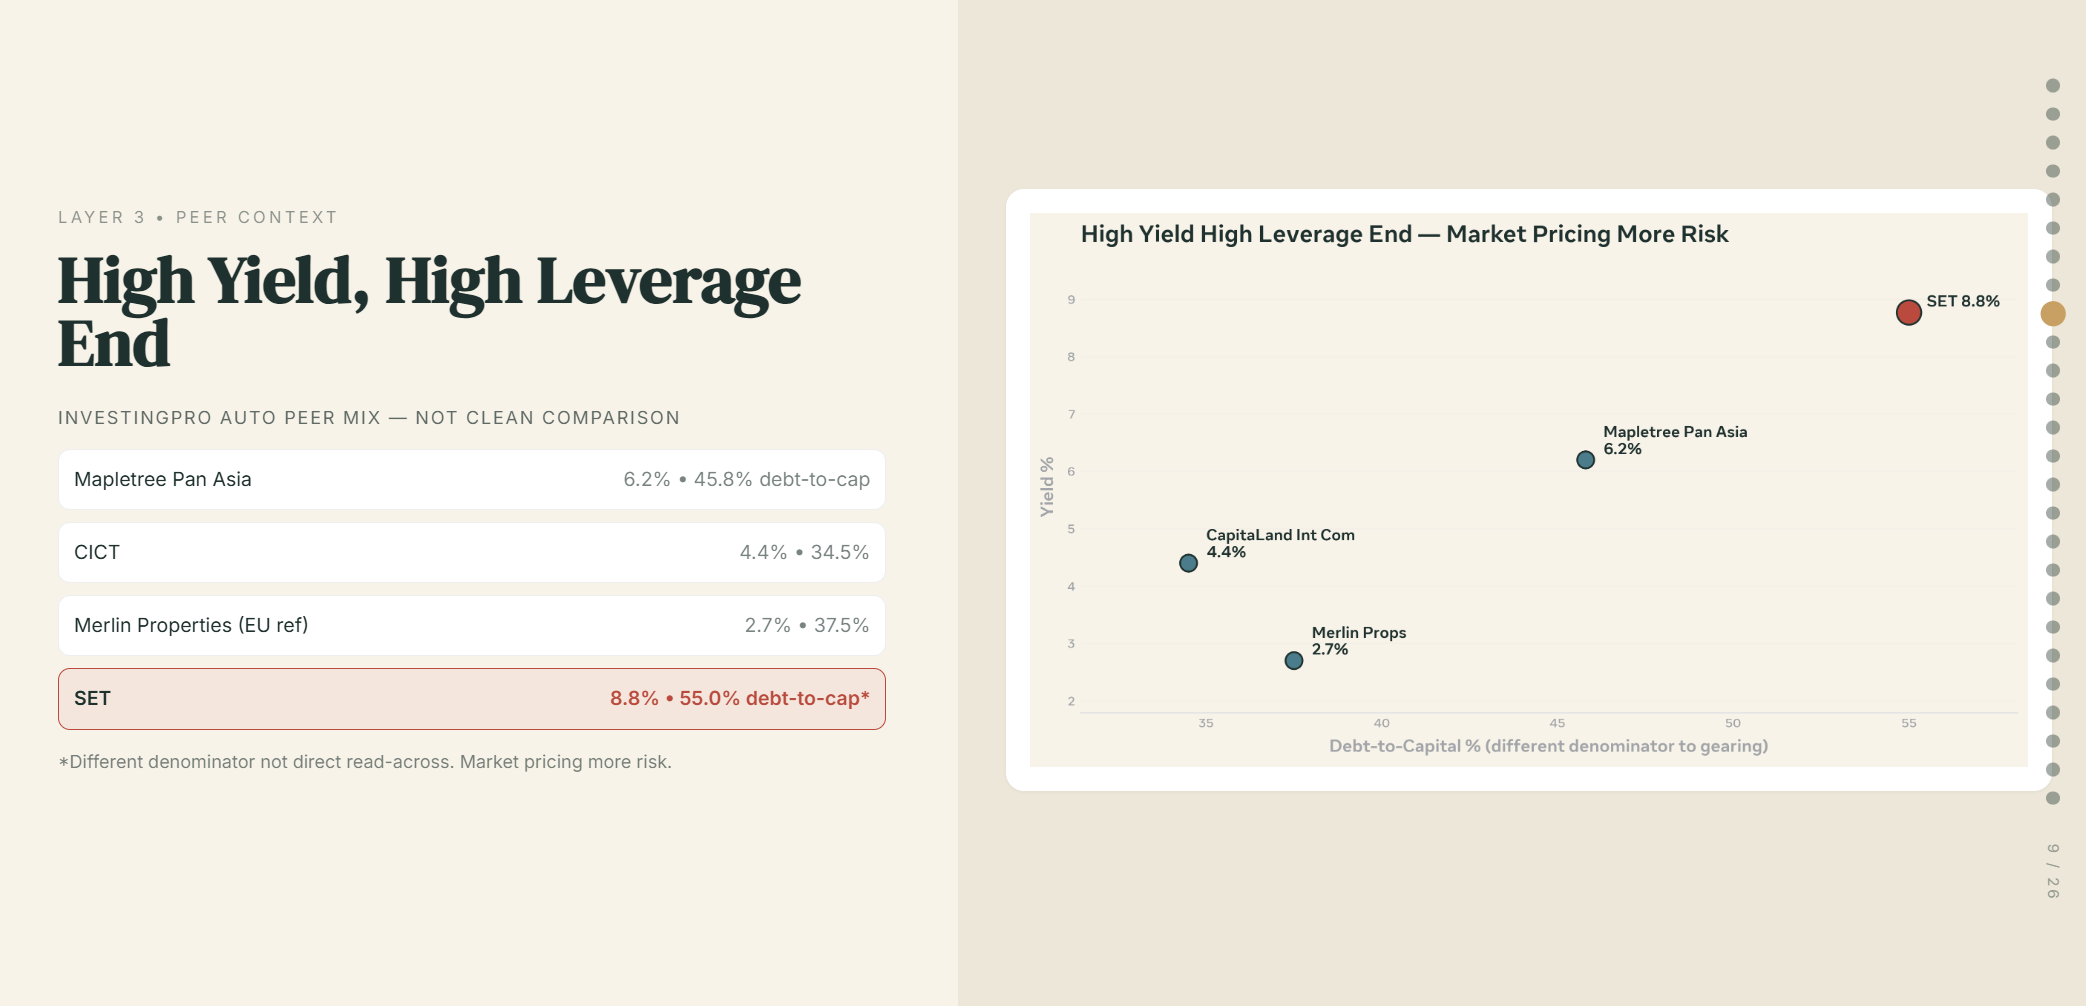
Layer 3, Peer Context. InvestingPro’s auto-selected peer set mixes Singapore-listed and pure European names, not a clean comparison, but it’s what’s available: Mapletree Pan Asia Commercial Trust yields 6.2% on 45.8% debt-to-capital, CapitaLand Integrated Commercial Trust yields 4.4% on 34.5%, Merlin Properties (the closer European property reference) yields 2.7% on 37.5%. SET’s 8.8% yield against 55.0% debt-to-capital (a different denominator to gearing, so not a direct read-across) sits at the high-yield, high-leverage end of that set. The market is pricing meaningfully more risk into this name than into its nearest comparables.
Some of that gap is structural rather than purely company-specific. Stoneweg Europe Stapled Trust sits outside MAS’s own REIT leverage framework, since its assets and debt are euro-denominated and its aggregate leverage is benchmarked against a European regulatory regime, not the Singapore rules its S-REIT peers answer to. It also trades in a thinner secondary market than a large-cap S-REIT, and the euro exposure adds a currency variable none of its Singapore-dollar peers carry.
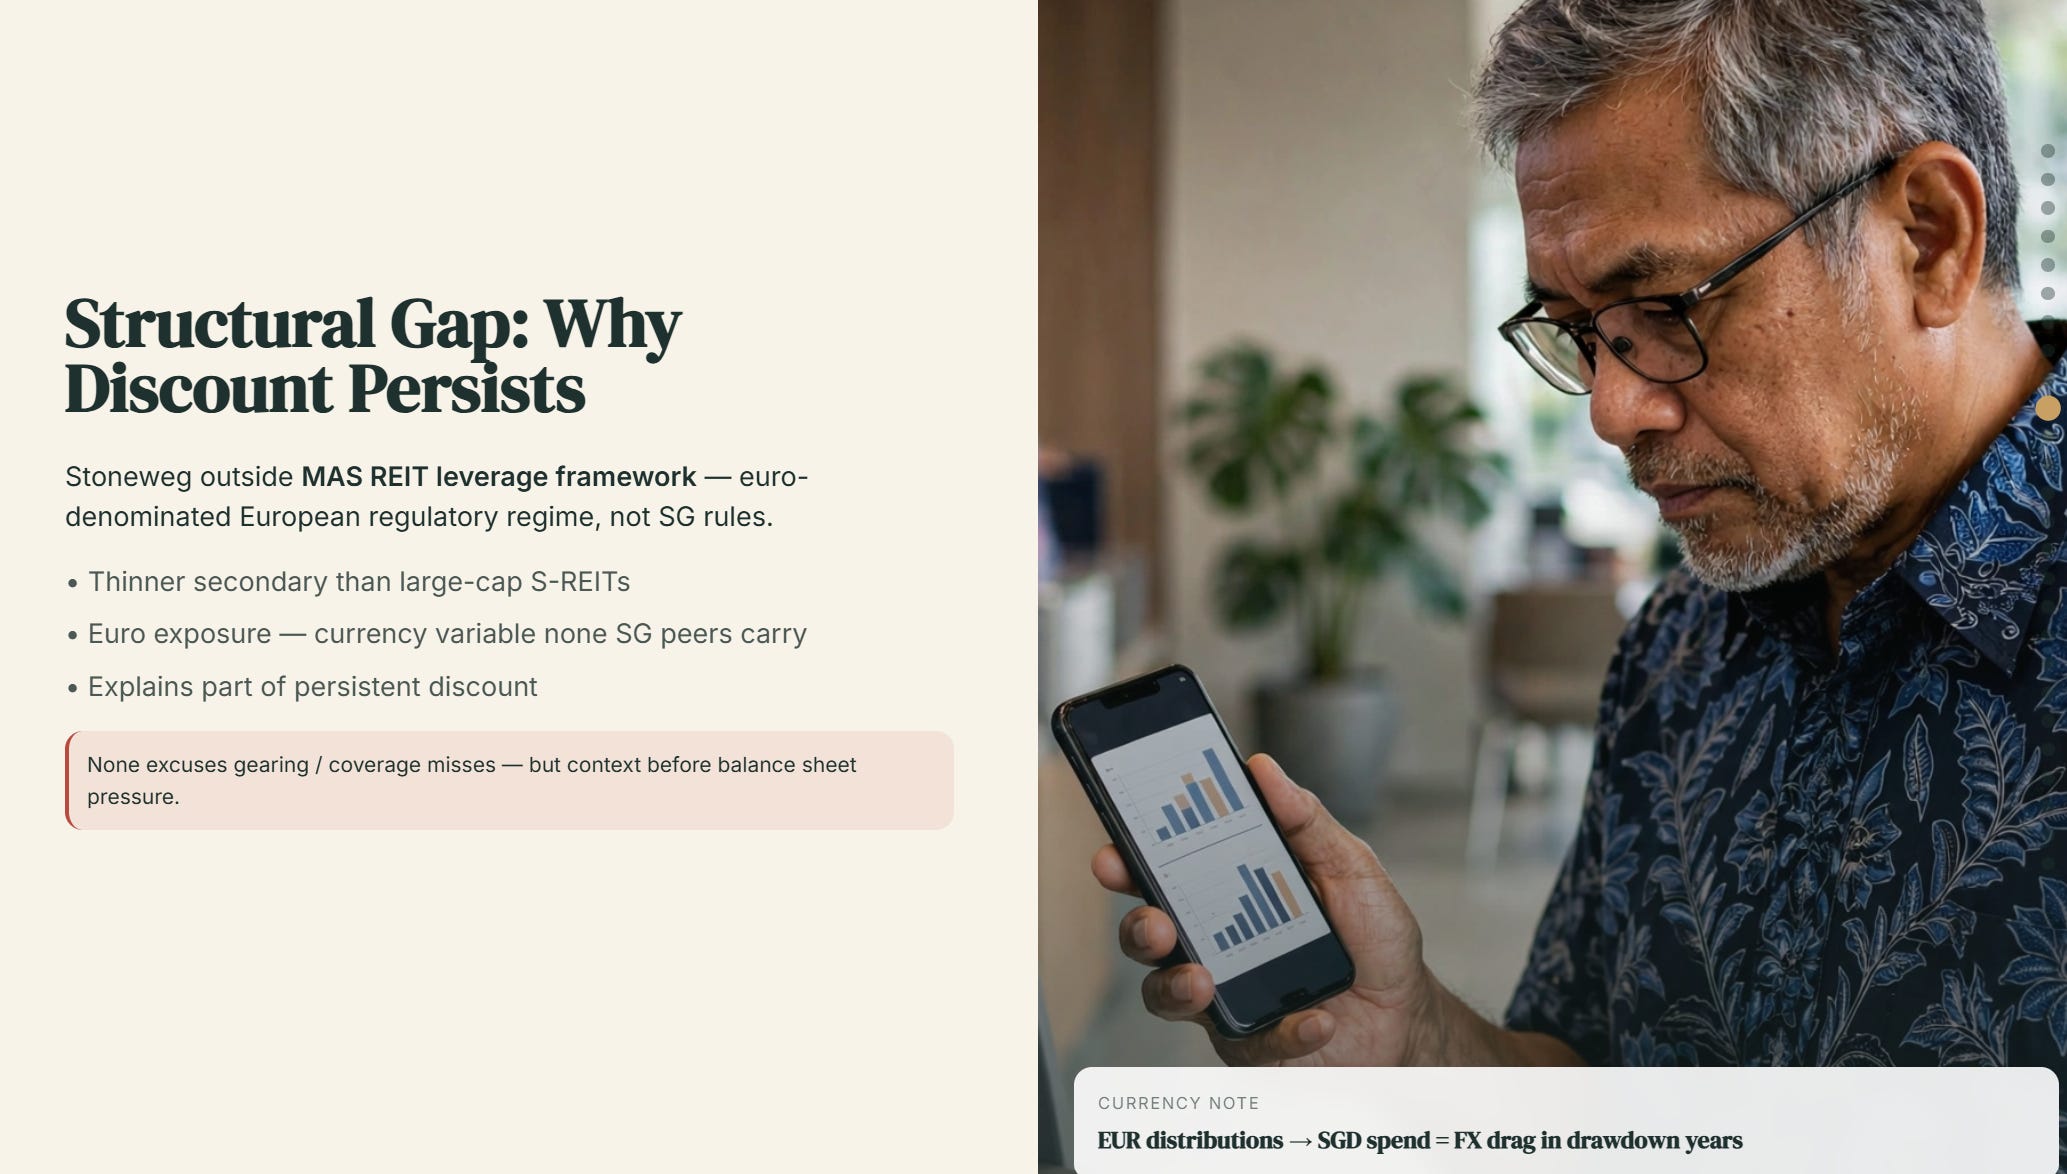
None of that excuses the gearing or coverage misses against my own thresholds, but it explains part of why the market has priced this name at a persistent discount to its S-REIT comparables even before this year’s balance sheet pressure showed up.
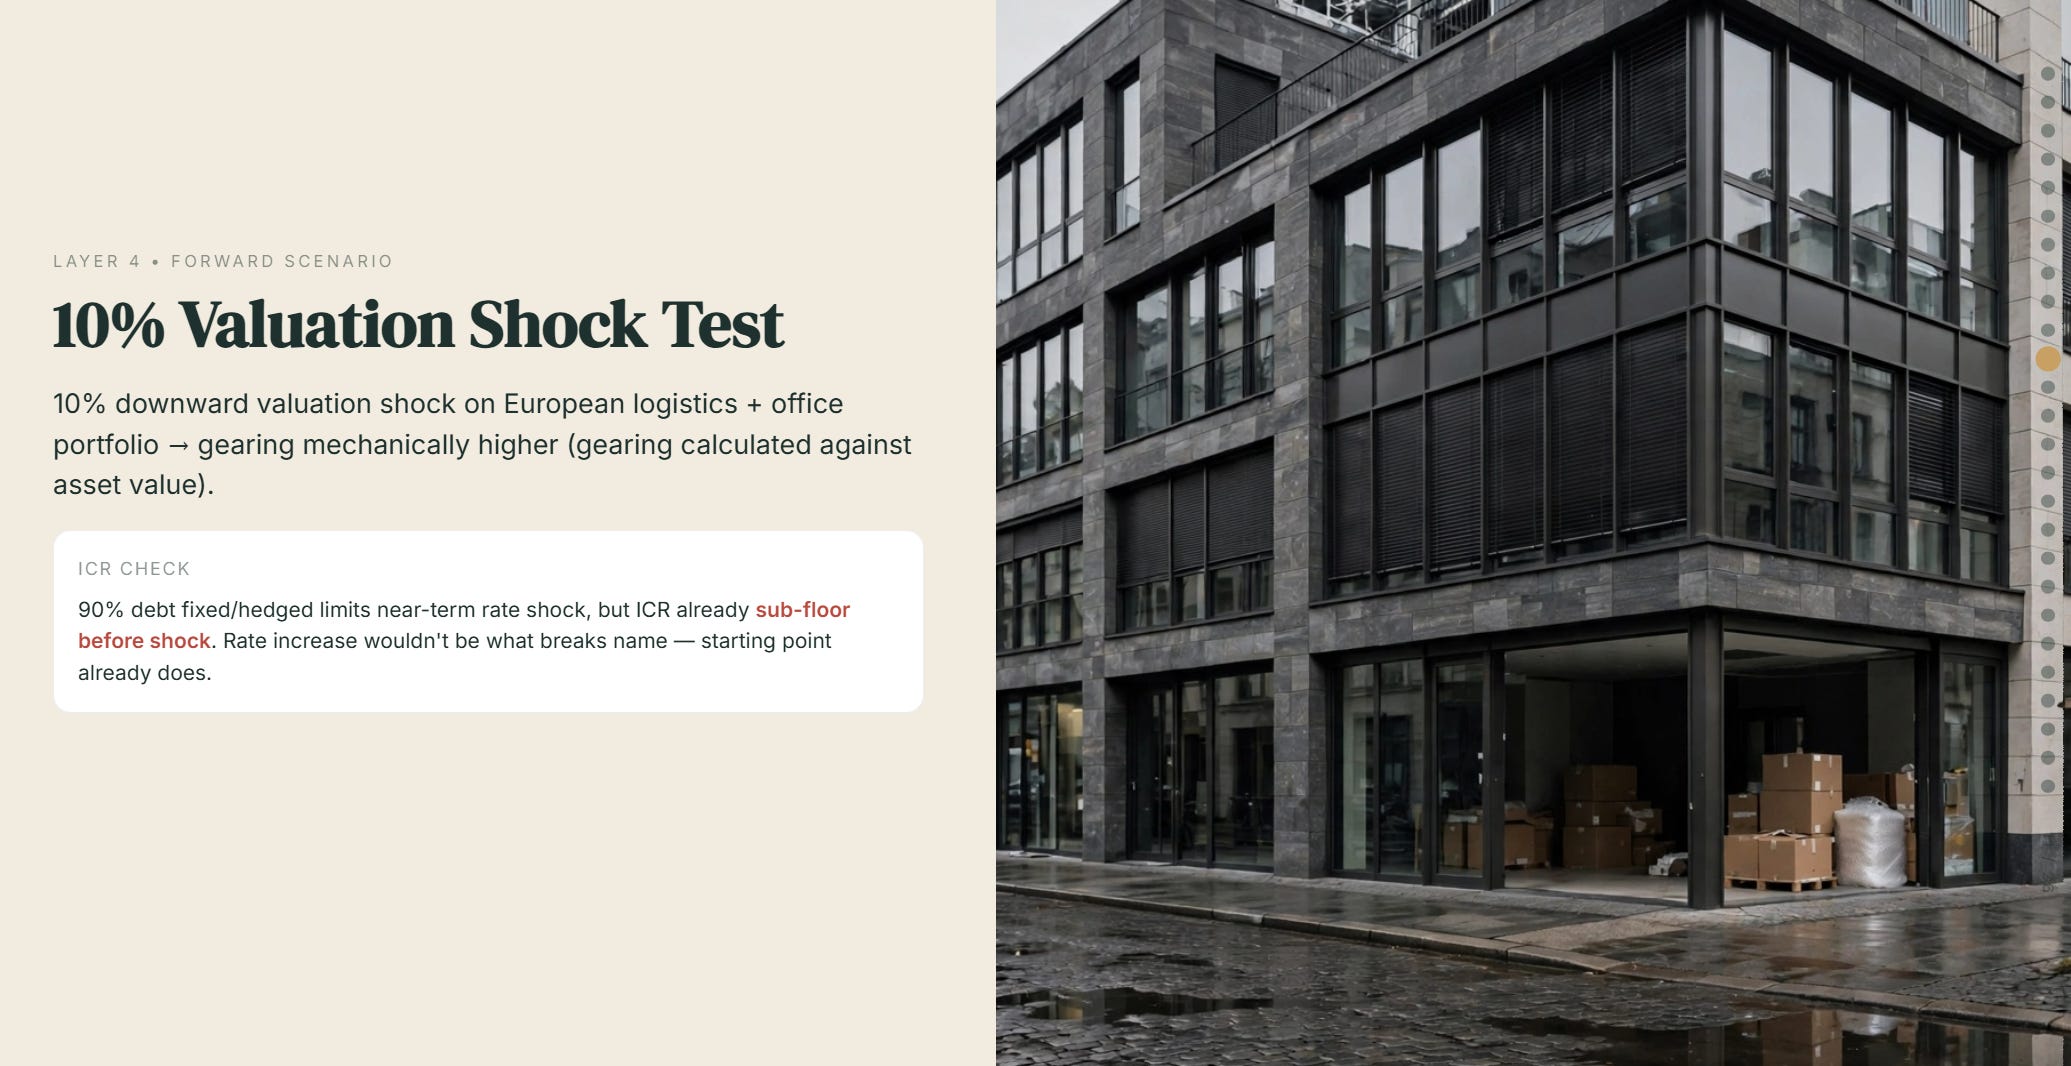
Layer 4, Forward Scenario. A 10% downward valuation shock to the European logistics and office portfolio would mechanically push aggregate leverage higher, since gearing is calculated against asset value, widening rather than narrowing the gearing breach. On the coverage side, 90% of the trust’s debt is fixed or hedged, which limits near-term sensitivity to a rate shock, but the ICR is already sub-floor before any shock is applied. A rate increase wouldn’t be what breaks this name. The starting point already does.

Layer 5, Wallet Impact. For a Singapore investor in their 50s or 60s using this yield to supplement retirement income, the near-9% headline is genuinely attractive against the 6-month T-bill at 1.56% (as at 13 Aug 2026) or even CPF SA at 4.0%. But that spread is compensation for real balance sheet risk, not a free lunch. A REIT carrying 42% gearing and sub-4x interest coverage has less room to absorb a bad year than one that clears every gate, and that matters more the closer you are to actually drawing down this income rather than reinvesting it.
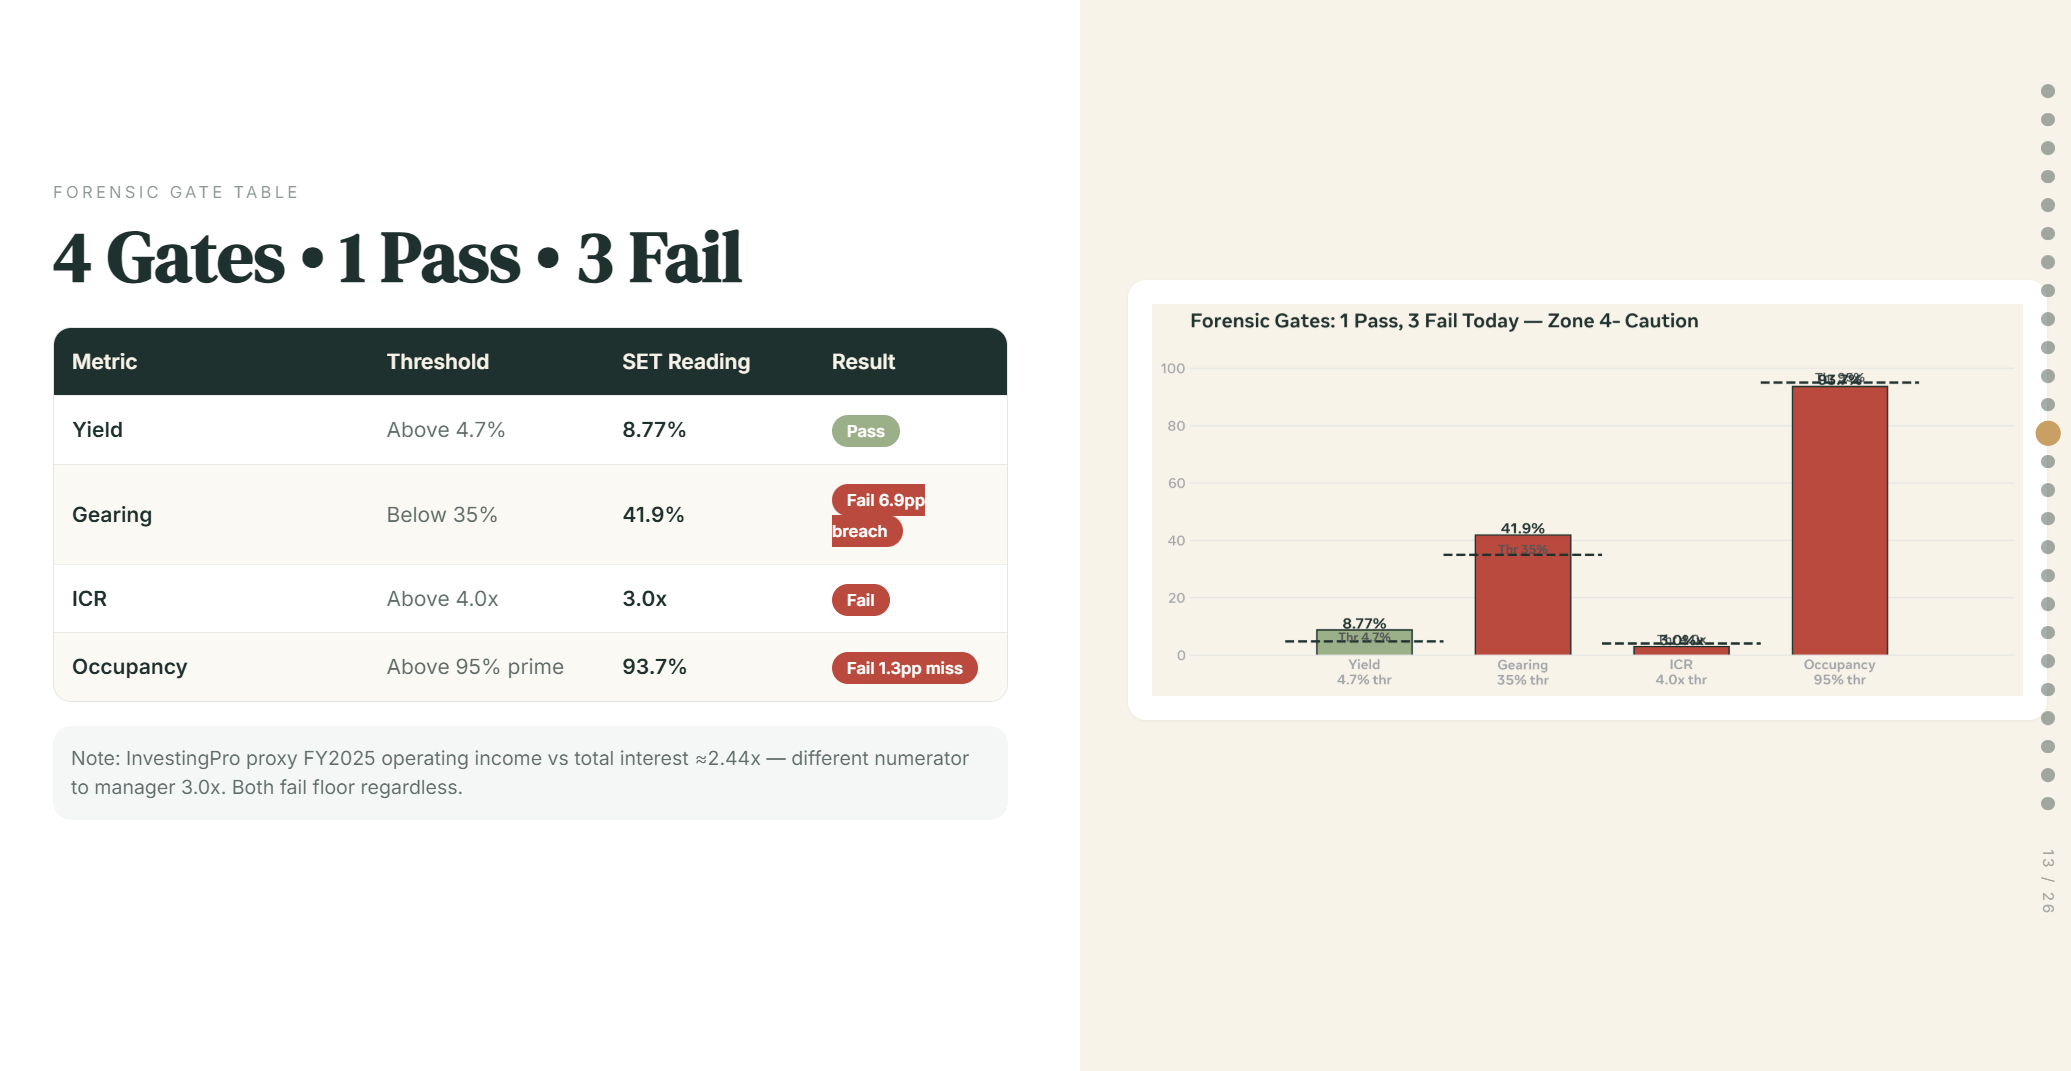
Note on the ICR figure: a separate InvestingPro-derived proxy using FY2025 operating income against total interest expense produces approximately 2.44x. This isn’t an issuer-reported figure and uses a different numerator to the manager’s own 3.0x, so the two shouldn’t be treated as interchangeable. Both fail the floor regardless, so the gate call doesn’t turn on resolving this, but a formal ruling on which methodology this Ledger treats as governing for SET would be worth making before this name recurs in future coverage.
Distributions have risen for two consecutive halves, but one component of that income stream is not organic NPI from the existing portfolio, and that distinction matters more for fresh capital than the headline DPS suggests.
