



S$10,000, Three Dividend Stocks, Three Different Yields: Which One Is Real? 🦖
How to Separate Ordinary Dividends From One-Offs: What OCBC, Sheng Siong and CapitaLand Investment Paid Over the Last 12 Months
A dividend yield is a claim about next year, calculated from last year’s payments. Before you rely on it, you need to know which of those payments will arrive again.
Smart Investor published a S$10,000 illustration on 22 September 2026, built on OCBC, Sheng Siong and CapitaLand Investment with a blended trailing yield of about 3.4%, and I read it twice. If you already own one of these, you want to know whether the income is safe, and if you have cash waiting, you want to know whether the yield on the screen is the yield you would actually collect. The post is a fair starting point, so I am using it as the worked example, and I am not suggesting any allocation. What I want to test is a question that applies to any dividend list: which of these yields would still be there next year?
The S$10,000 Illustration, as Published
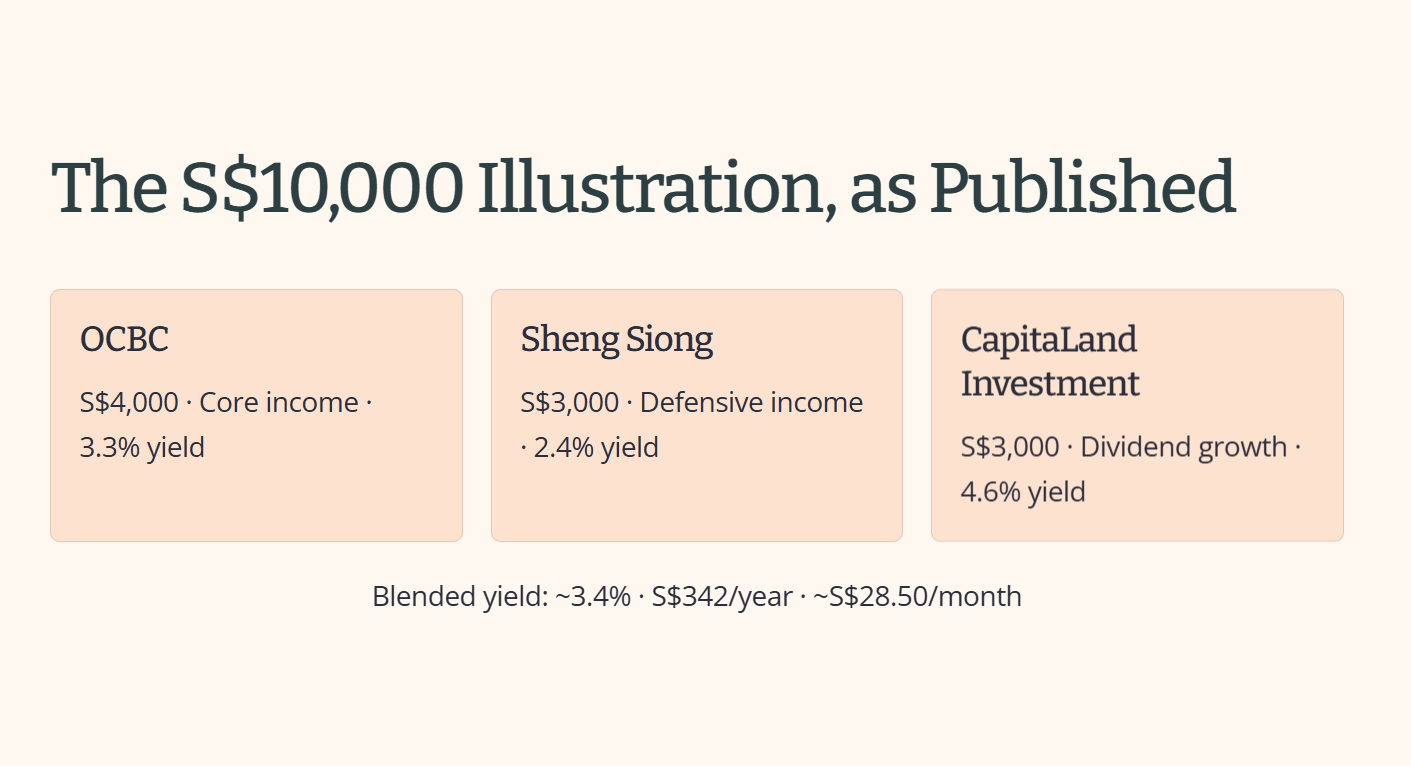
The post splits the S10,000intoS4,000 in OCBC, S3,000inShengSiongandS3,000 in CapitaLand Investment, and gives each a role: core income, defensive income and dividend growth. Its trailing 12-month yields are 3.3%, 2.4% and 4.6%, which it adds up to about 3.4%, or S342ayear,roughlyS28.50 a month. The post marks these as indicative figures for illustration only, and I treat them the same way. The split and the yields are the post’s, not mine, and nothing in this piece is a view on how anyone should divide their own money.
The post also does something many yield articles skip: it flags that OCBC’s S$0.99 for FY2025 included a S$0.16 special dividend, and it warns that a very high yield can be a red flag. Both are fair points. They are also where the next question begins, because noting that a special exists is different from asking what the yield looks like without it.
One housekeeping note. The post’s prices are as at 21 September. The figures I work out later in this piece use delayed quotes from the 2 October 2026 session, so part of any gap between its yields and mine is simply the date.
One Number, Three Different Stories
A blended 3.4% looks like one number. Underneath it sit three different sources of cash, and they do not behave the same way. Each of the three stocks answers the questions below differently from the other two, and which one answers what is the whole point of this piece.

The S$10,000 Illustration, as Published
One Number, Three Different Stories
The Three Questions Behind Any Dividend Yield
The Window Is Already Open
Putting the Three Questions to the Three Yields
OCBC: One Payment in the Window Changes the Yield
CapitaLand Investment: The Payment Is Clean and Has Not Moved
Sheng Siong: Small, Regular and Rising
What the Three Yields Add Up To
Legacy Holders vs. Fresh Capital
Iggy’s Elite Read
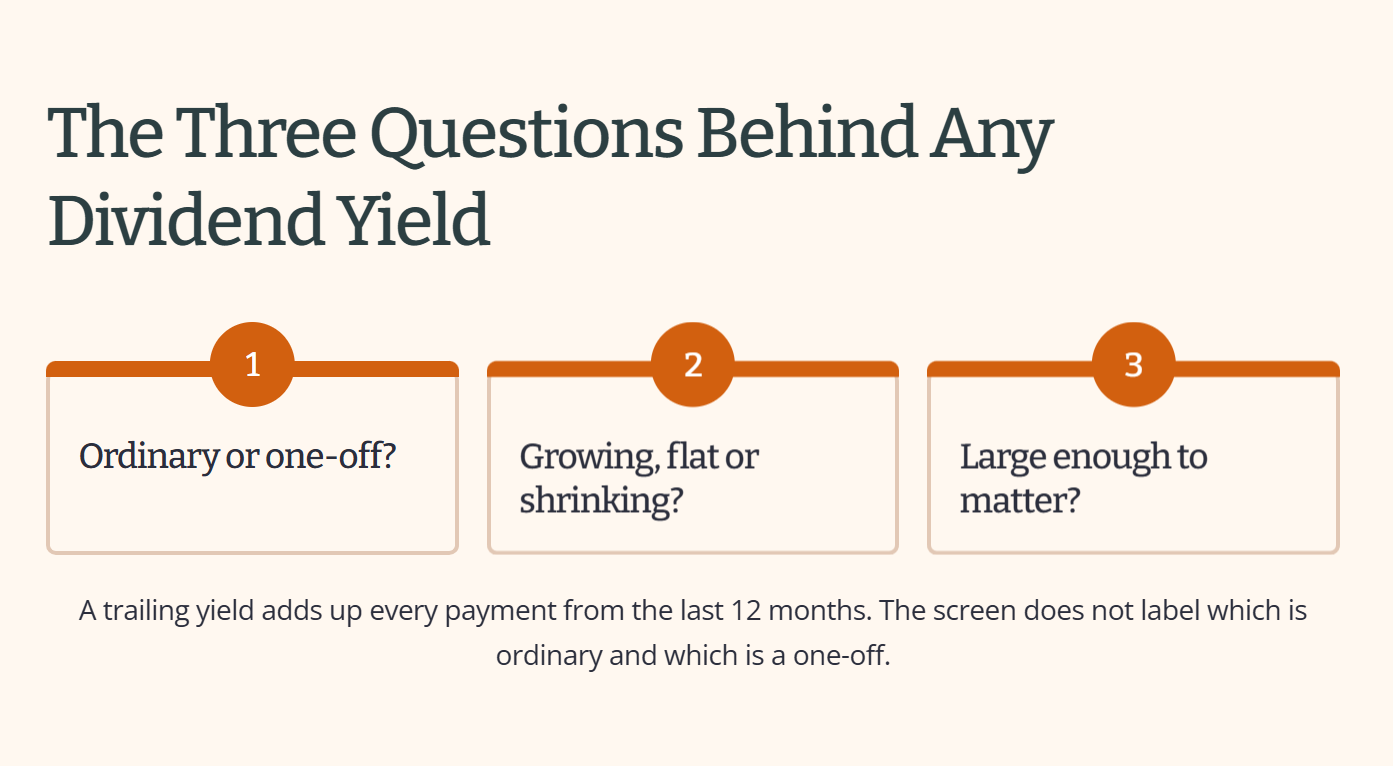
The Three Questions Behind Any Dividend Yield
That is the post on its own terms. Here is the test I run on any yield before it counts in my screen.
A dividend yield is a claim about next year, calculated from last year’s payments. Before you rely on it, you need to know which of those payments will arrive again.
Smart Investor published a S$10,000 illustration on 22 September 2026, built on OCBC, Sheng Siong and CapitaLand Investment with a blended trailing yield of about 3.4%, and I read it twice. If you already own one of these, you want to know whether the income is safe, and if you have cash waiting, you want to know whether the yield on the screen is the yield you would actually collect. The post is a fair starting point, so I am using it as the worked example, and I am not suggesting any allocation. What I want to test is a question that applies to any dividend list: which of these yields would still be there next year?
The S$10,000 Illustration, as Published
The portfolio divides S$10,000 into S$4,000 in OCBC, S$3,000 in Sheng Siong and S$3,000 in CapitaLand Investment. Each holding has a distinct role: core income, defensive income and dividend growth. Using trailing 12-month yields of 3.3%, 2.4% and 4.6%, the blended yield works out to about 3.4%, or roughly S$342 a year and S$28.50 a month. These are illustrative figures, and I treat them that way. The allocation and yields belong to the post, not to me, and none of this is advice on how anyone should allocate their own money.
The post also does something many yield-focused articles omit. It notes that OCBC’s S$0.99 dividend for FY2025 included a S$0.16 special dividend, and it cautions that an unusually high yield can be a red flag. Both points are fair. But they open the next question: recognising that a special dividend exists is not the same as asking what the yield would look like without it.
One housekeeping note. The post’s prices are as at 21 September. The figures I work out later in this piece use delayed quotes from the 2 October 2026 session, so part of any gap between its yields and mine is simply the date.
One Number, Three Different Stories
A blended 3.4% looks like one number. Underneath it sit three different sources of cash, and they do not behave the same way. Each of the three stocks answers the questions below differently from the other two, and which one answers what is the whole point of this piece.
The Three Questions Behind Any Dividend Yield
That is the post on its own terms. Here is the test I run on any yield before it counts in my screen.
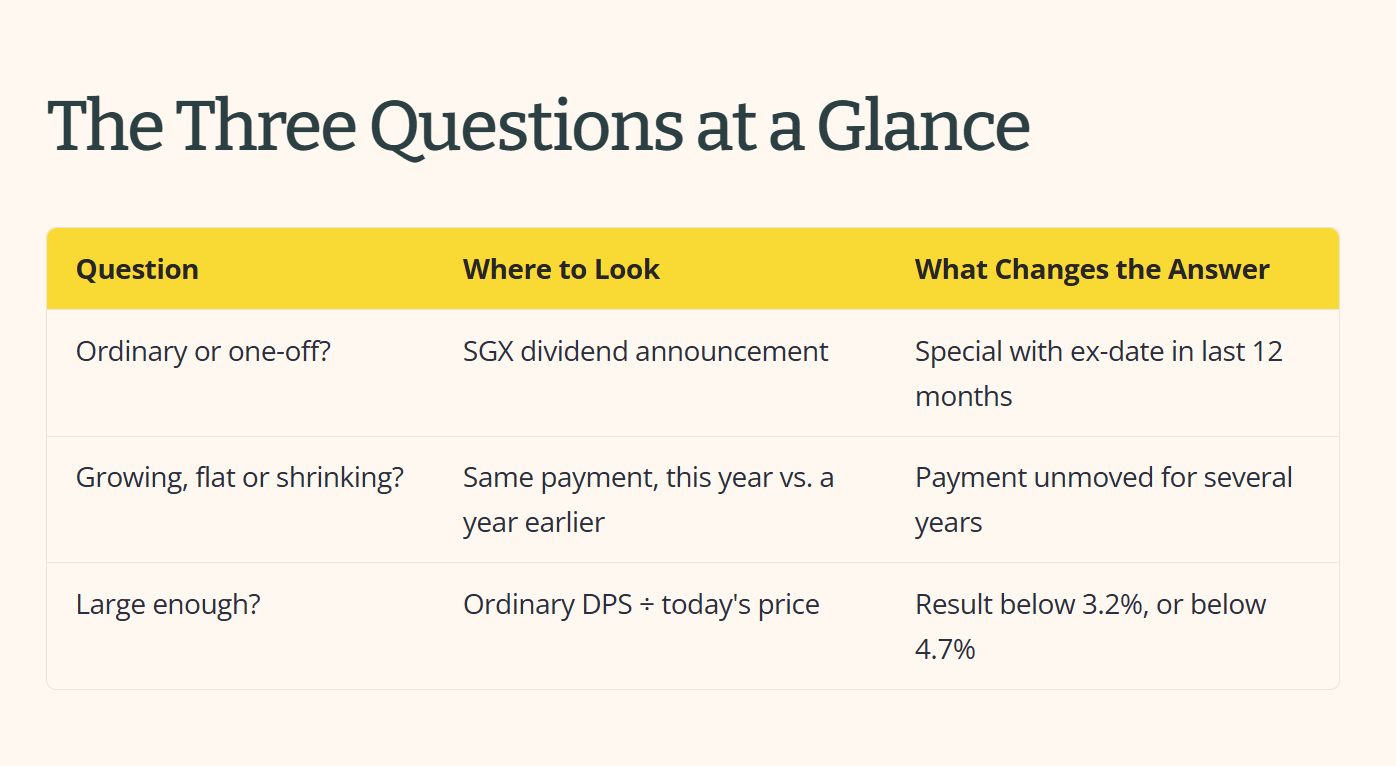
Is the payment ordinary, or a one-off?
Picture a kopitiam stall owner who sold his old chicken rice cooker for a good price and counted the cash as monthly income. The money was real, but he cannot count on selling a cooker every month. An ordinary dividend is the monthly takings. A special dividend is the cooker sale.
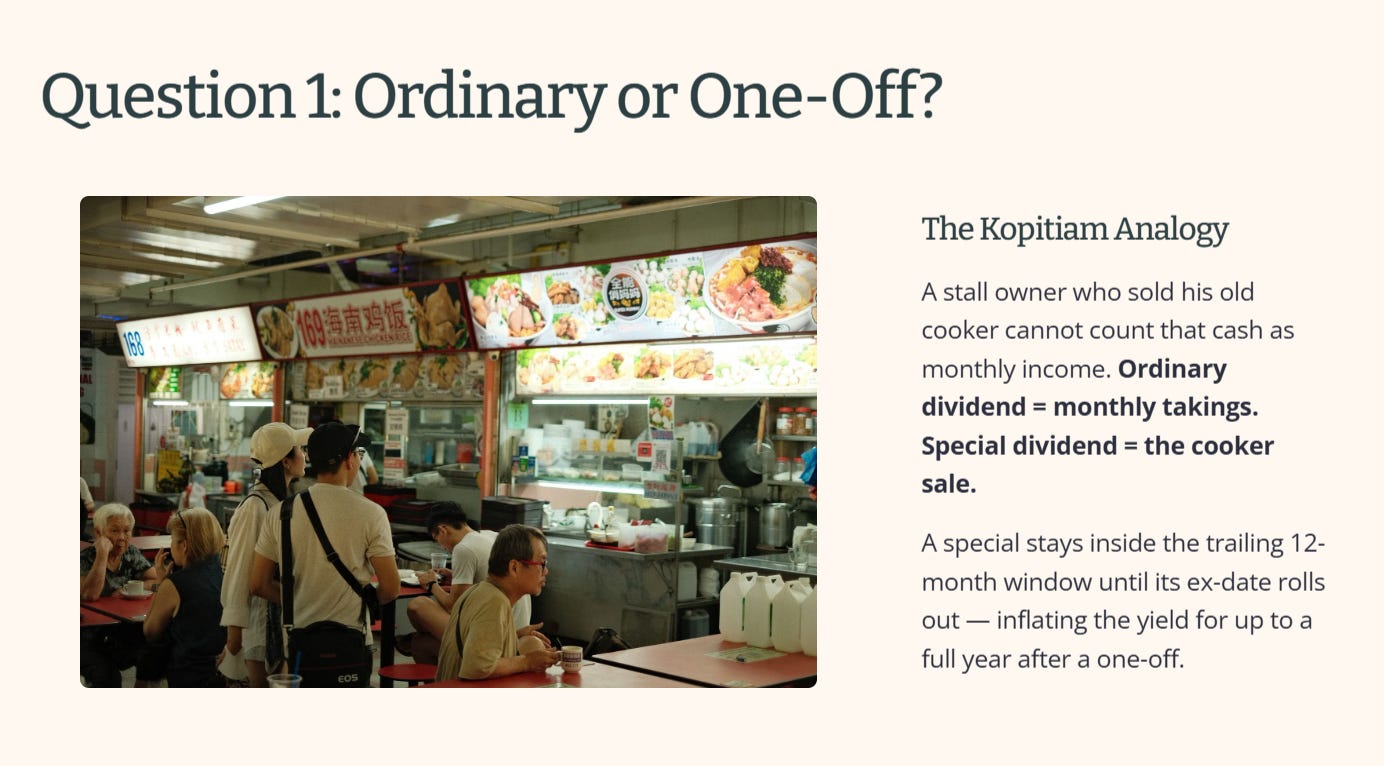
A trailing yield adds up every payment from the last 12 months and divides the total by today’s share price. Both kinds of payment go into that sum, and the screen does not label which is which. A special dividend also stays inside the window until its payment date rolls out of the 12 months, so the yield can stay inflated for a full year after a one-off, even if the company has said nothing about repeating it. My governing yield leaves specials out for exactly that reason.
Is the payment growing, flat or shrinking?
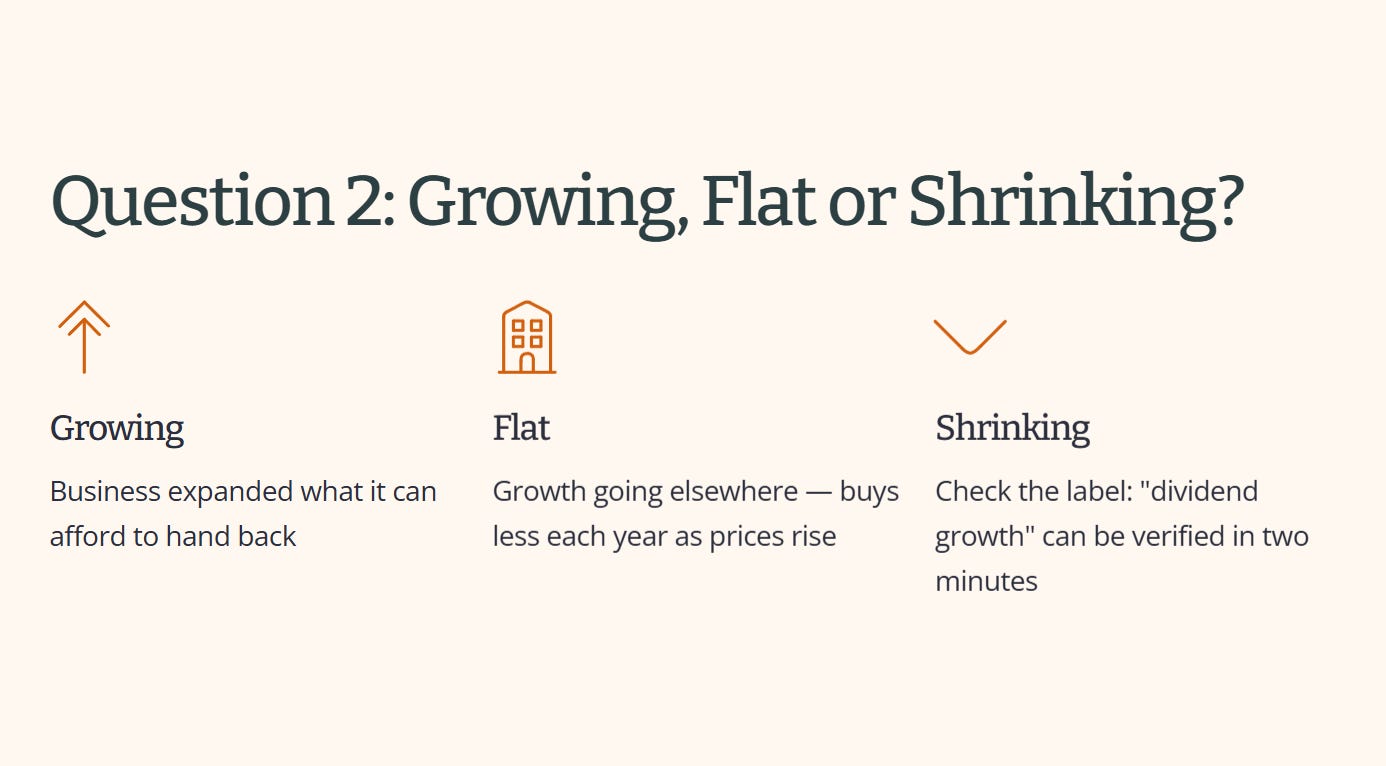
A payment that has grown tells you the business expanded what it can afford to hand back. A payment that has not moved tells you the business is putting its growth somewhere else. Neither is wrong, but they are different claims, and a label such as “dividend growth” can be checked in two minutes: compare this year’s payments with the same payments a year earlier.
The consequence matters more than the label. A flat payment buys a little less each year if prices keep rising, whatever the yield says on day one.
Is the yield large enough to matter?
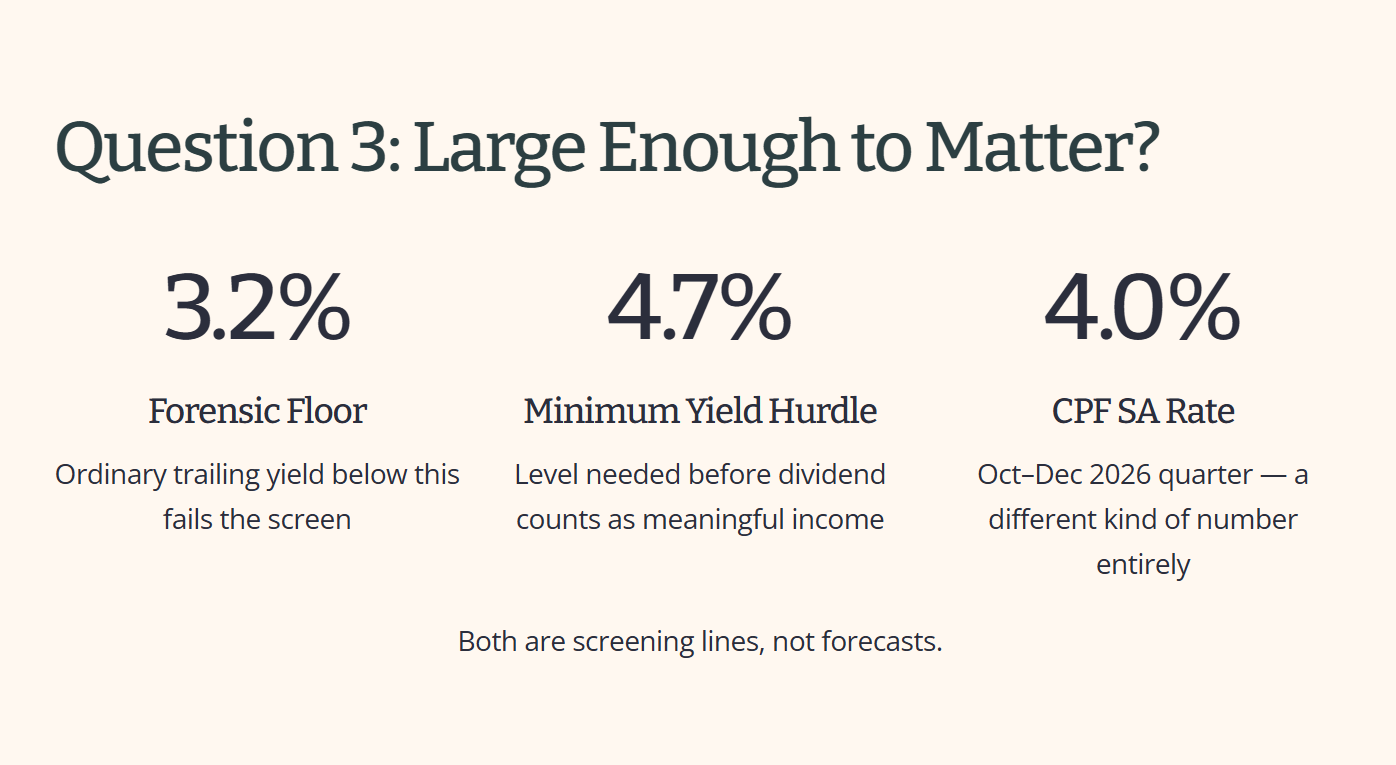
Every yield has to clear a line before it counts in my screen. The Forensic Floor is 3.2%, and an ordinary trailing yield below it fails the screen. The Minimum Yield Hurdle is 4.7%, the level I want a dividend to reach before I treat it as meaningful income for the risk of owning the shares.
Both are screening lines, not forecasts, and neither says what a particular S$10,000 would earn if it were placed somewhere else. CPF SA’s 4.0% rate for the October to December 2026 quarter is a government-set rate with its own rules, so it is a different kind of number from a dividend yield, which is an announced payout that can change.
💡 Insight Callout
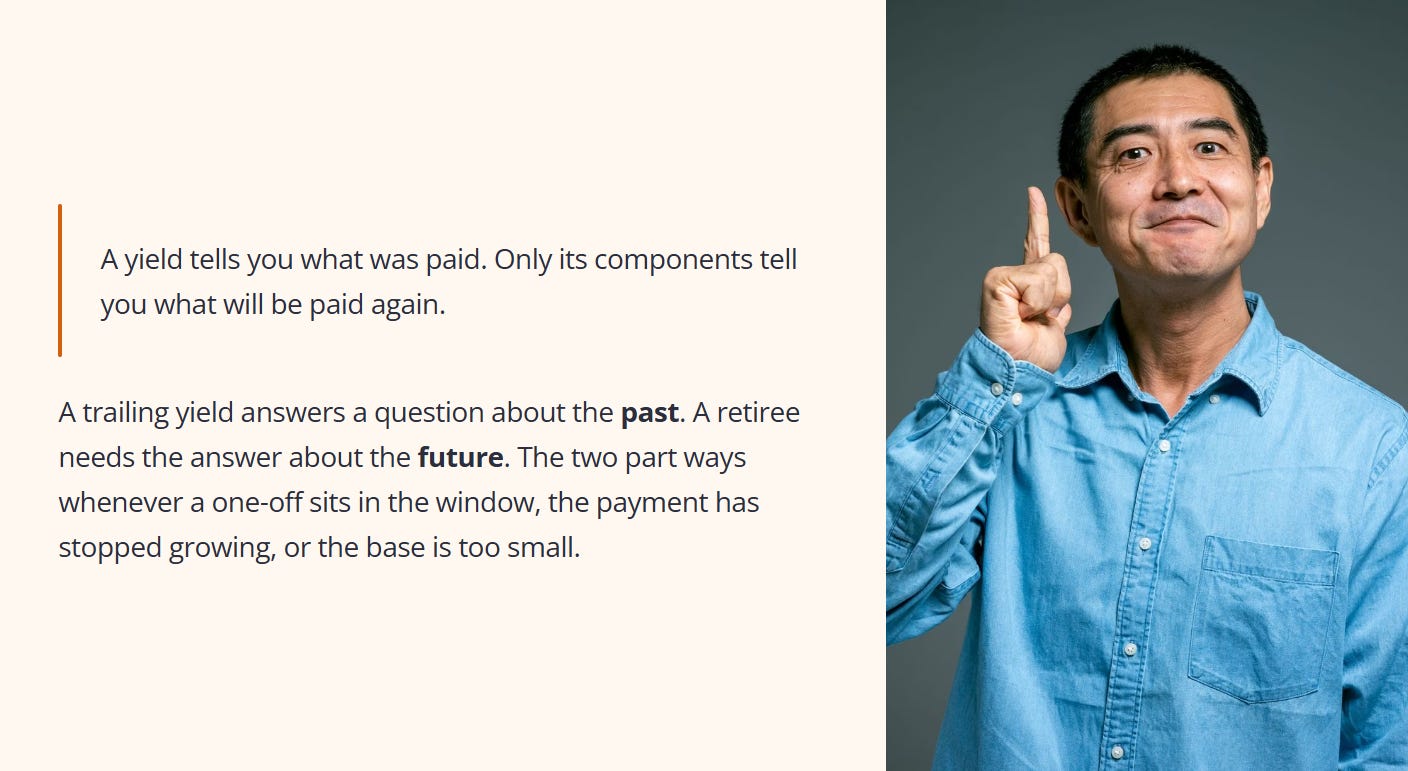
A trailing yield answers a question about the past: how much cash came out in the last 12 months? A retiree needs the answer to a question about the future: how much of that cash will come out again? The two answers part ways whenever a one-off payment sits in the window, whenever the payment has stopped growing, or whenever the base is too small to carry the income. Most yield screens run none of these checks, which is why the number on the page and the number in the bank can differ. A yield tells you what was paid. Only its components tell you what will be paid again.
The three questions are simple to state. Putting them to OCBC, Sheng Siong and CapitaLand Investment gives three different answers, and one of them changes a figure the post reports.
The Window Is Already Open
What Free Subscribers See Is the Headline. What Members See Is the Reason.
Every piece I publish gives free subscribers the zone number and the label the moment it goes live. What they don’t get is the reasoning behind it, the soft flag breakdown, the exact margin that triggered the call, the trajectory that would change it. That gap between the verdict and the reasoning isn’t something you can wait out. It’s the actual content, and it stays behind the paywall permanently, not for a week, not until the next piece bumps it down the feed.
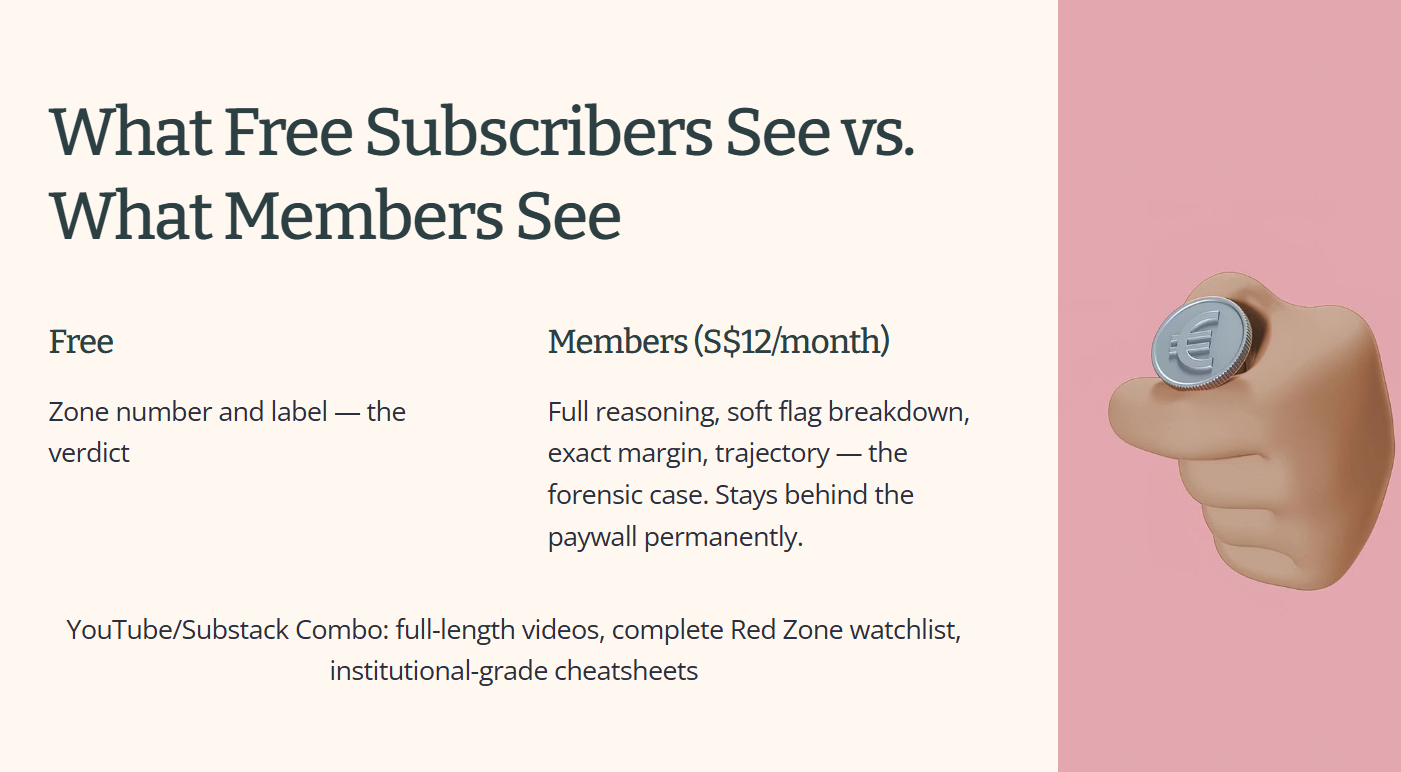
YouTube/Substack Combo members get the complete breakdown the moment it publishes: full-length videos, the complete Red Zone watchlist, and institutional-grade cheatsheets, not a summary of the verdict, the actual forensic case for it.
For S$12/month, you’re not paying to read this sooner. You’re paying to stop reading headlines and start reading the case.
🔒 What’s Next
OCBC’s 3.3% is a real number, and my 3.2% Forensic Floor is a real threshold. The next section shows where the two land once one payment is taken out of the trailing 12 months.
