



Institutional research houses love orderbook pipelines because future promises look great in a discounted cash flow model. But retail investors live on cash in hand, not pipeline projections. When DBS reiterates a S$3.00 price target on Seatrium based on a S$32 billion order pipeline, they are asking you to fund an operational turnaround while accepting a dividend yield that fails every basic retirement hurdle in Singapore.

Section 1 — The Analyst’s Case
Section 2 — Iggy’s Forensic Screen
Financial Health Checklist
Section 3 — The Dividend Trajectory
Section 4 — The Forensic Gap
🟠 Iggy’s Insight Box 1
Section 5 — What To Watch Next
🟠 Iggy’s Insight Box 2
Closing — The Forensic Stance
Warm Entry Beat

It is easy to get caught up in the headlines when a marine engineering giant turns a S$373 million 1H26 profit. We all want Singapore’s industrial champions to rebuild their strength, especially after years of restructuring and debt consolidation. But when I look at Seatrium through the lens of a CPF or SRS portfolio that needs reliable distribution, the balance sheet tells a far more nuanced story than the broker headlines suggest.
Section 1 — The Analyst’s Case
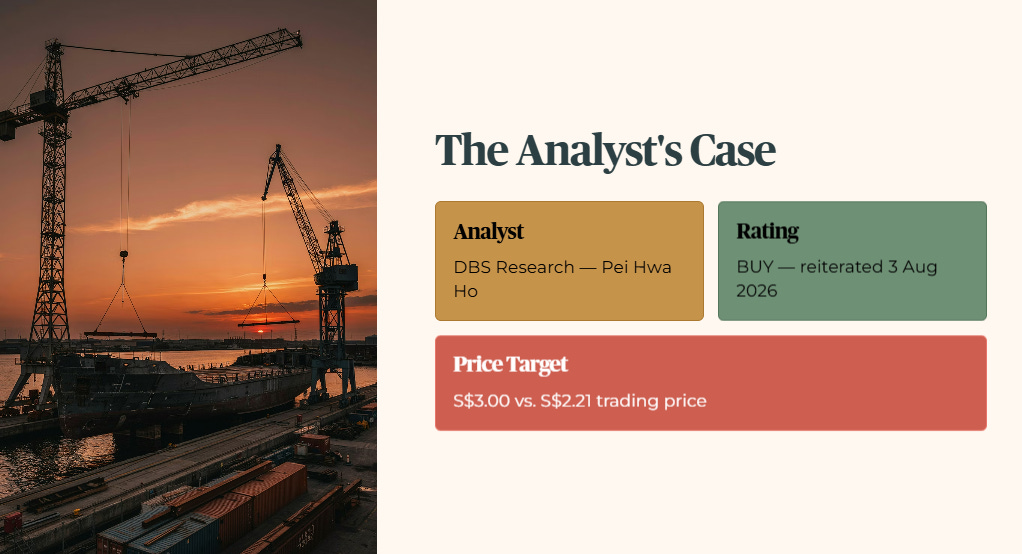
DBS Research analyst Pei Hwa Ho reiterated a BUY rating on Seatrium Limited (SGX: 5E2) on 3 August 2026, maintaining a price target of S$3.00 against a trading price of S$2.21.
The institutional thesis rests on three main pillars:
Margin Expansion Trajectory: DBS projects gross margins expanding from 8.9% in 1H26 (up 0.7 percentage points year-on-year) toward management’s long-term target of approximately 15% by FY28. This path is expected to be supported by over S$50 million in annualised cost savings from non-core asset sales, including the AmFELS yard in Texas, Guanabara Navegação PSV assets in Brazil, and 17 tugboats in Singapore.
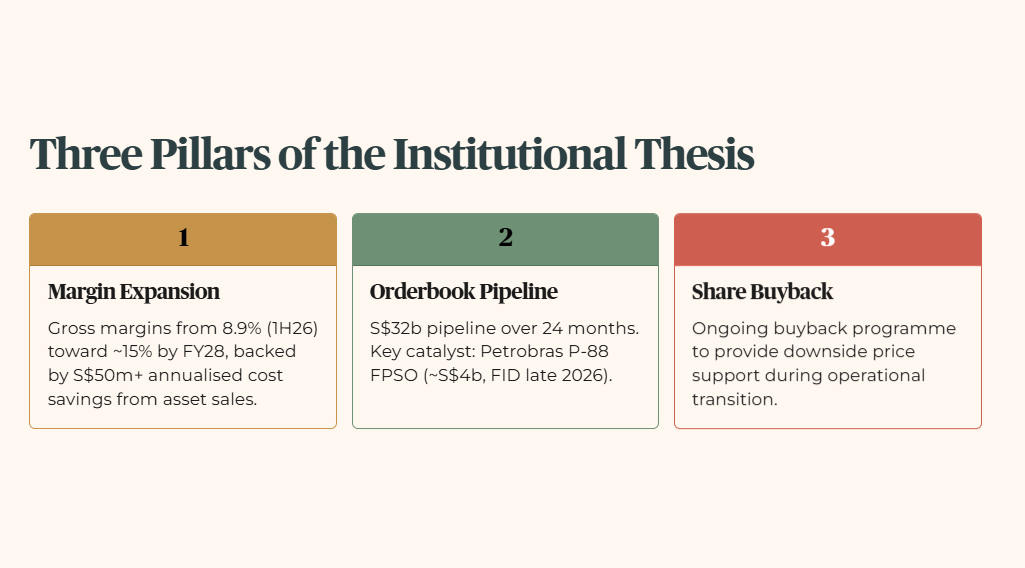
Orderbook Replenishment Pipeline: Despite net orderbook declining from S$17.8 billion at end-2025 to S$13.3 billion at 1H26, DBS emphasizes a S$32 billion pipeline over the next 24 months. Key near-term catalysts include Petrobras’ Albacora P-88 FPSO tender (approximately S$4 billion contract value, FID expected late 2026), alongside FSRU conversions and offshore wind platforms.
Share Buyback Support: DBS highlights that Seatrium’s ongoing share buyback programme will provide downside support to the equity price during the operational transition.
THE LOAD-BEARING ASSUMPTION: DBS assumes Seatrium will successfully convert its S$32 billion potential pipeline into high-margin EPC contract wins rapidly enough to prevent a revenue cliff beyond 2026, while maintaining gross margin expansion toward 15%.
Section 2 — Iggy’s Forensic Screen
Applying our five-layer forensic audit using verified 1H26 financial data reveals significant structural divergence between institutional growth expectations and retail yield requirements.
1. Dividend Yield and Distribution Floor
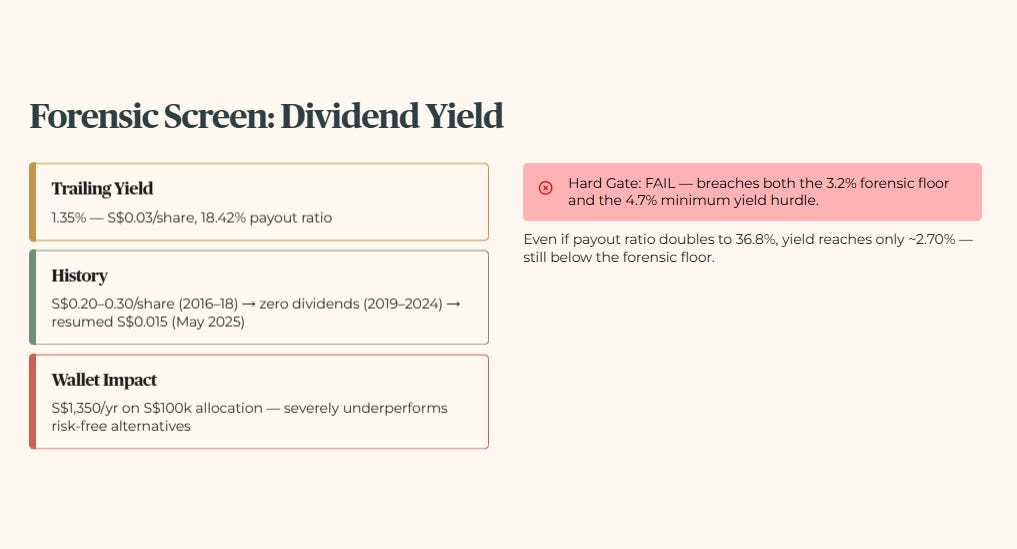
Layer 1 (Raw Fact): Trailing dividend yield sits at 1.35% (annualised payout S$0.03 per share, 18.42% payout ratio).
Layer 2 (Historical Benchmark): Paid S$0.20 to S$0.30 per share from 2016 to 2018, followed by a six-year gap with zero dividends from 2019 to 2024 during restructuring. Distributions resumed at S$0.015 in May 2025 and S$0.03 in May 2026.
Layer 3 (Peer Context): Not applicable, industrial turnaround yard, peer metrics unsupplied.
Layer 4 (Forward Scenario): Even if the payout ratio doubles to 36.8%, the yield would sit at roughly 2.70%. That is still below our forensic floor.
Layer 5 (Wallet Impact): For a 55-year-old Singaporean investor, a 1.35% yield generates S$1,350 annually on a S$100,000 allocation. That severely underperforms passive risk-free alternatives.
Hard Gate Result: FAIL. Breaches both the 3.2% forensic floor and the 4.7% minimum yield hurdle. On its own, this is sufficient for a structural verdict.
2. Interest Coverage Ratio (ICR) Window Sensitivity
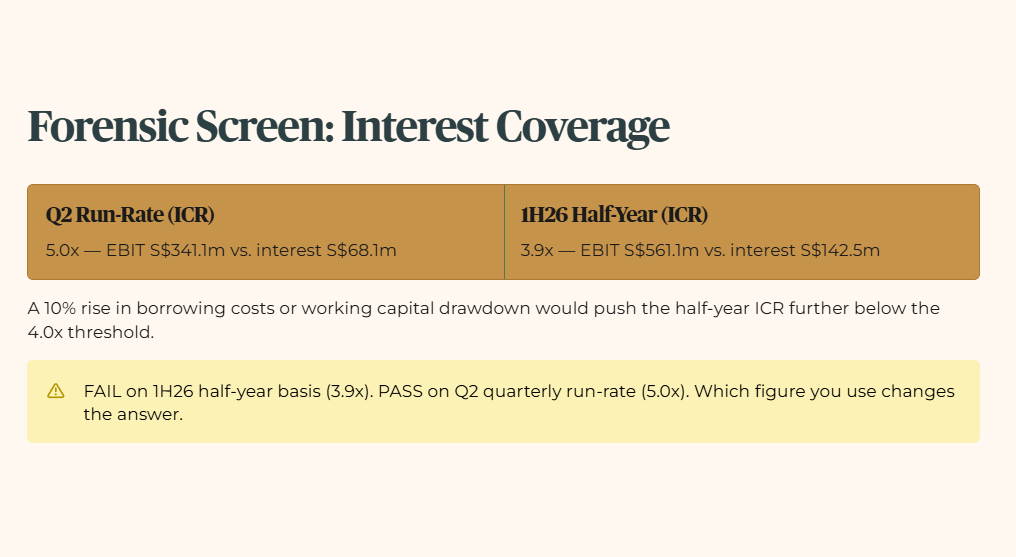
Layer 1 (Raw Fact): Quarterly ICR (Q2 ending 30 Jun 2026) is 5.0x, EBIT S$341.1 million against interest expense S$68.1 million. Half-year ICR (1H26, summing the two most recent quarters) is 3.9x, EBIT S$561.1 million against interest expense S$142.5 million.
Layer 2 (Historical Benchmark): 1H26 ICR shows marked improvement from distress-era negative earnings, but remains tight against debt service costs.
Layer 3 (Peer Context): Not applicable.
Layer 4 (Forward Scenario): A 10 percent rise in borrowing costs, or a temporary working capital drawdown, would push half-year ICR further below the 4.0x threshold.
Layer 5 (Wallet Impact): Operational debt service capability is improving on a quarterly run-rate basis, but the half-year window, the more comparable basis against a 1H26 results release, highlights why debt service room remains genuinely tight.
Hard Gate Result: FAIL on 1H26 half-year basis (3.9x versus the 4.0x floor). PASS on Q2 quarterly run-rate basis (5.0x). Which figure you use changes the answer, and that gap is itself worth sitting with.
3. Gearing Methodology Sensitivity
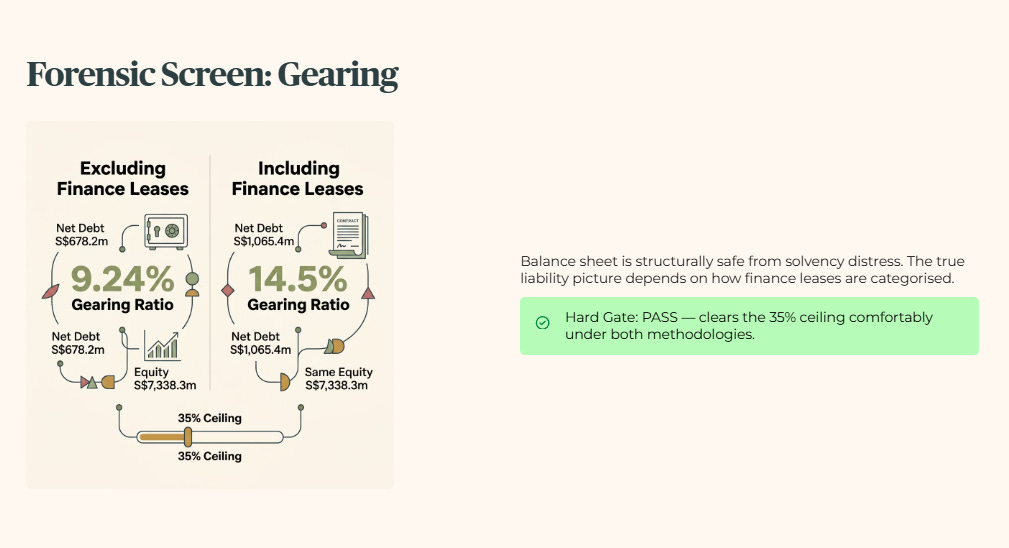
Layer 1 (Raw Fact): Net gearing excluding finance leases is 9.24 percent (net debt S$678.2 million against equity S$7,338.3 million). Net gearing including finance leases is 14.5 percent (net debt S$1,065.4 million against the same equity base).
Layer 2 (Historical Benchmark): Down from peak restructuring leverage following equity injections and non-core asset divestment proceeds.
Layer 3 (Peer Context): Not applicable.
Layer 4 (Forward Scenario): Even under a stress scenario adding S$500 million in working capital debt, gearing remains below 22 percent.
Layer 5 (Wallet Impact): The balance sheet is structurally safe from solvency distress, though the true liability picture depends entirely on how finance leases are categorised, and UOBKH’s “benign” framing rests on the narrower of the two readings.
Hard Gate Result: PASS. Clears the 35 percent ceiling comfortably under both methodologies.
The gating results above settle the yield, ICR, and gearing picture, the checklist that follows translates those thresholds into the zone system that decides where Seatrium sits on the retirement-income map.
