

Sembcorp: 25% Rally or “Blue Sky” Trap? (My Verdict) 🦖 EP1290
Why the “boring” utility trade might be the smartest growth play for your SRS portfolio.

If you are strictly an income investor, you likely view Sembcorp Industries (SCI) as a utility proxy—safe, steady, and perhaps a little dull. You hold it for stability, not excitement.
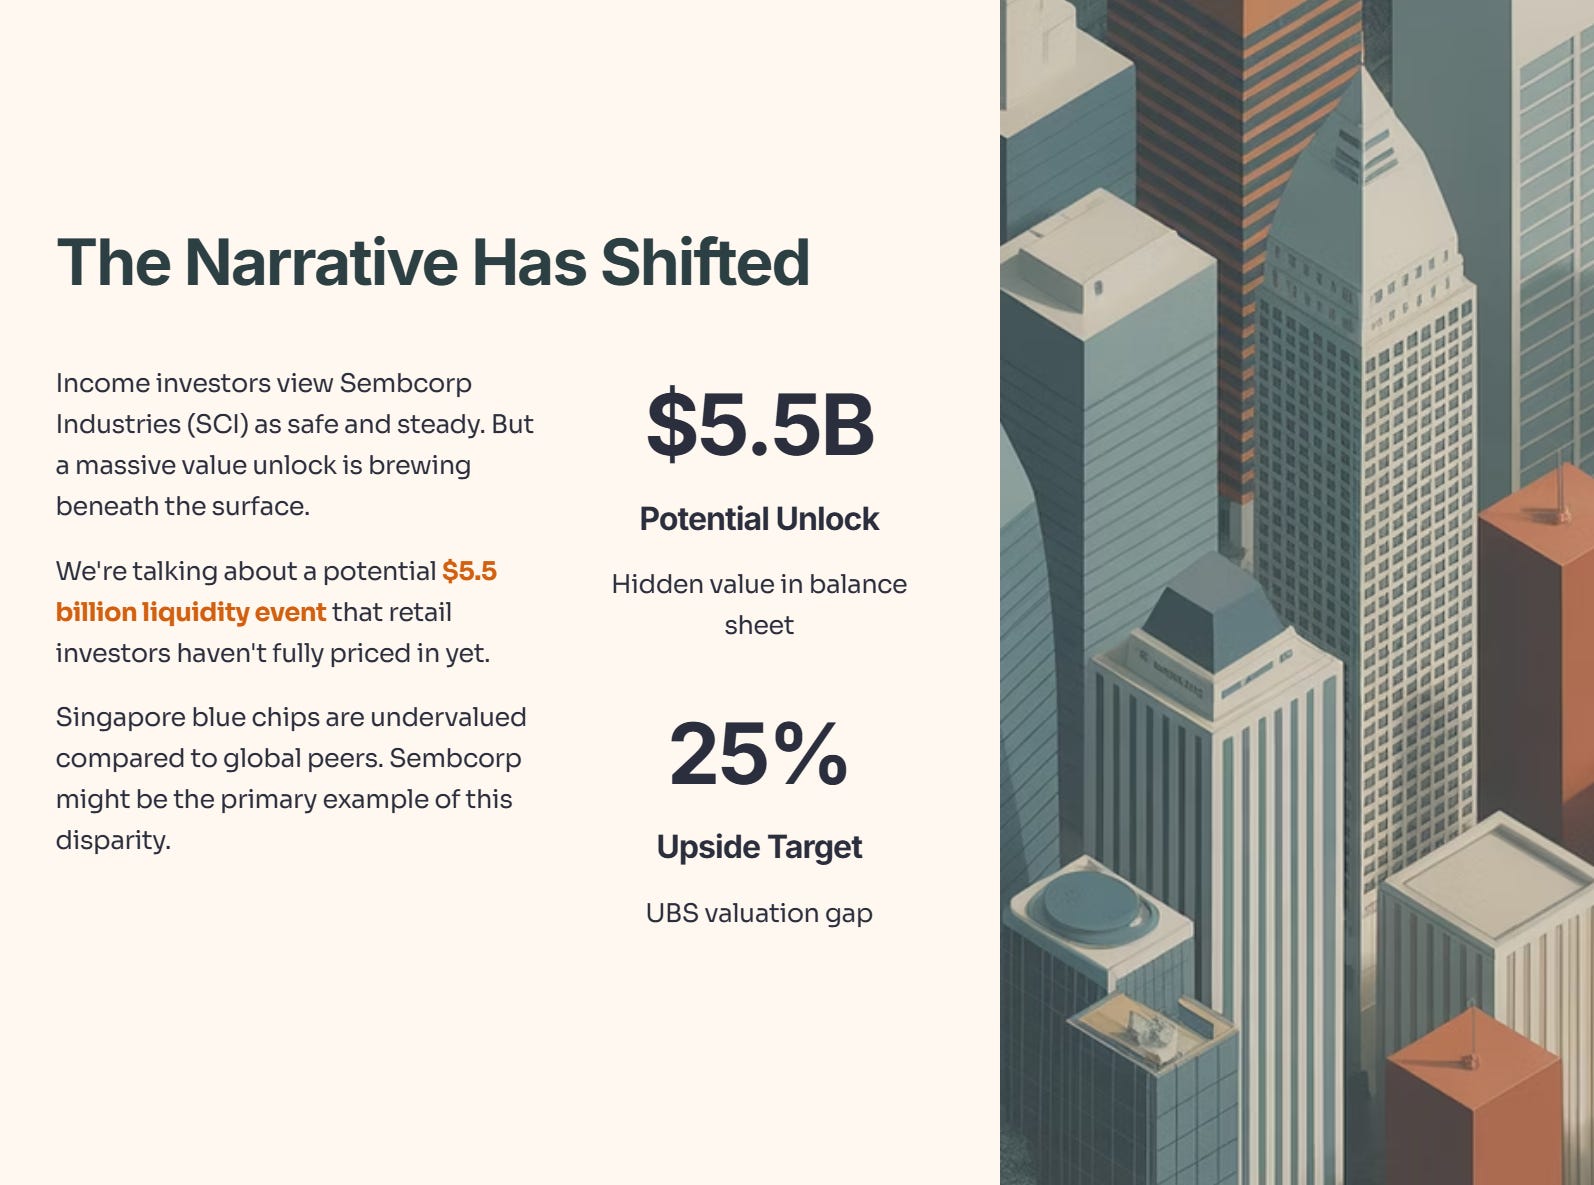
But recently, the narrative has shifted. While the broader Straits Times Index (STI) struggles for direction, a massive “value unlock” is brewing under the surface of Sembcorp’s balance sheet. We aren’t talking about a small dividend hike. We are talking about a potential $5.5 billion liquidity event that the average retail investor hasn’t fully priced in yet.
If you have been feeling like Singapore blue chips are undervalued compared to their global peers, you are right. And Sembcorp might be the primary example of this disparity.
In This Article:

• The Data: The $7.65 Price Target
• The Analysis: Unlocking the India “Goldmine”
• The Skeptic’s View: Is UBS Dreaming?
• Iggy’s Insights (The Alpha)
• The Verdict:
• Conclusion & Next Steps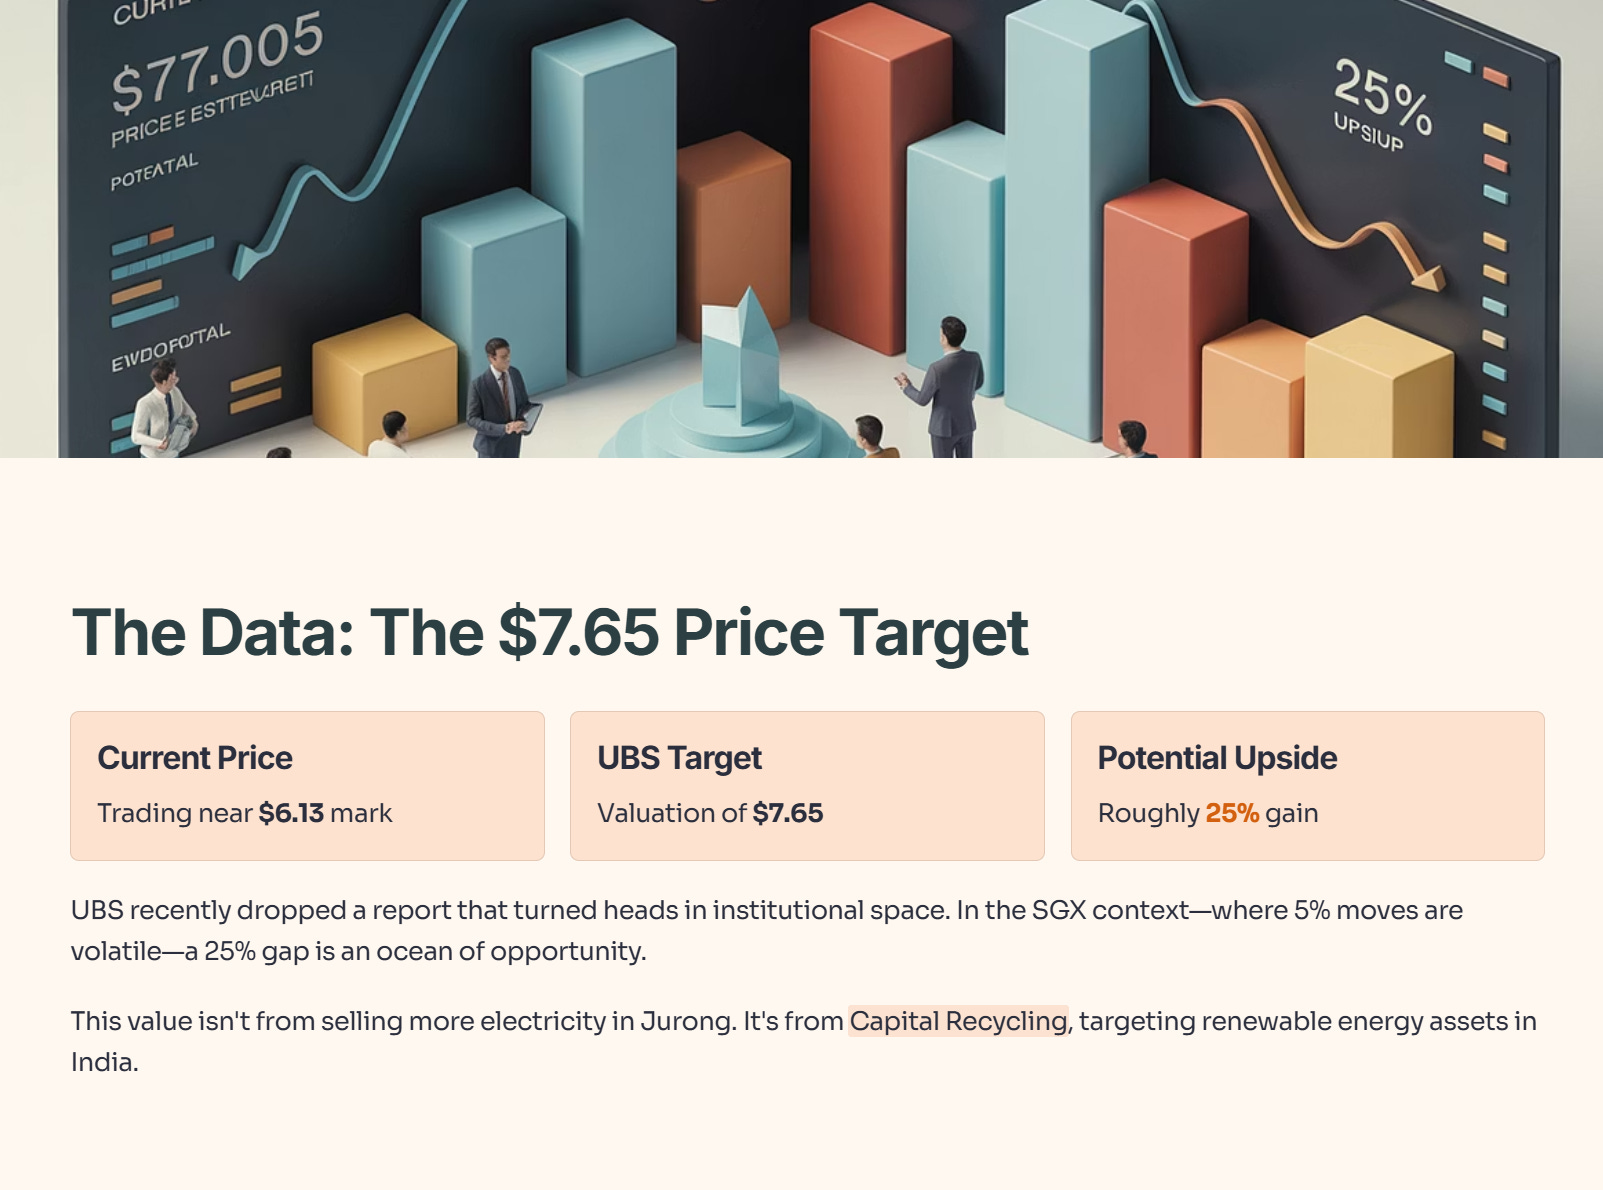
The Data: The $7.65 Price Target
UBS recently dropped a report that turned heads in the institutional space. They slapped a $7.65 valuation on Sembcorp Industries.
With the stock trading near the $6.13 mark, this implies a potential upside of roughly 25%. In the context of the SGX—where a 5% move is considered volatile—a 25% gap is an ocean of opportunity.
Where is this value coming from? It isn’t from selling more electricity in Jurong. It is coming from a strategy known as “Capital Recycling,” specifically targeting their renewable energy assets in India.
Table 1: The Valuation Gap
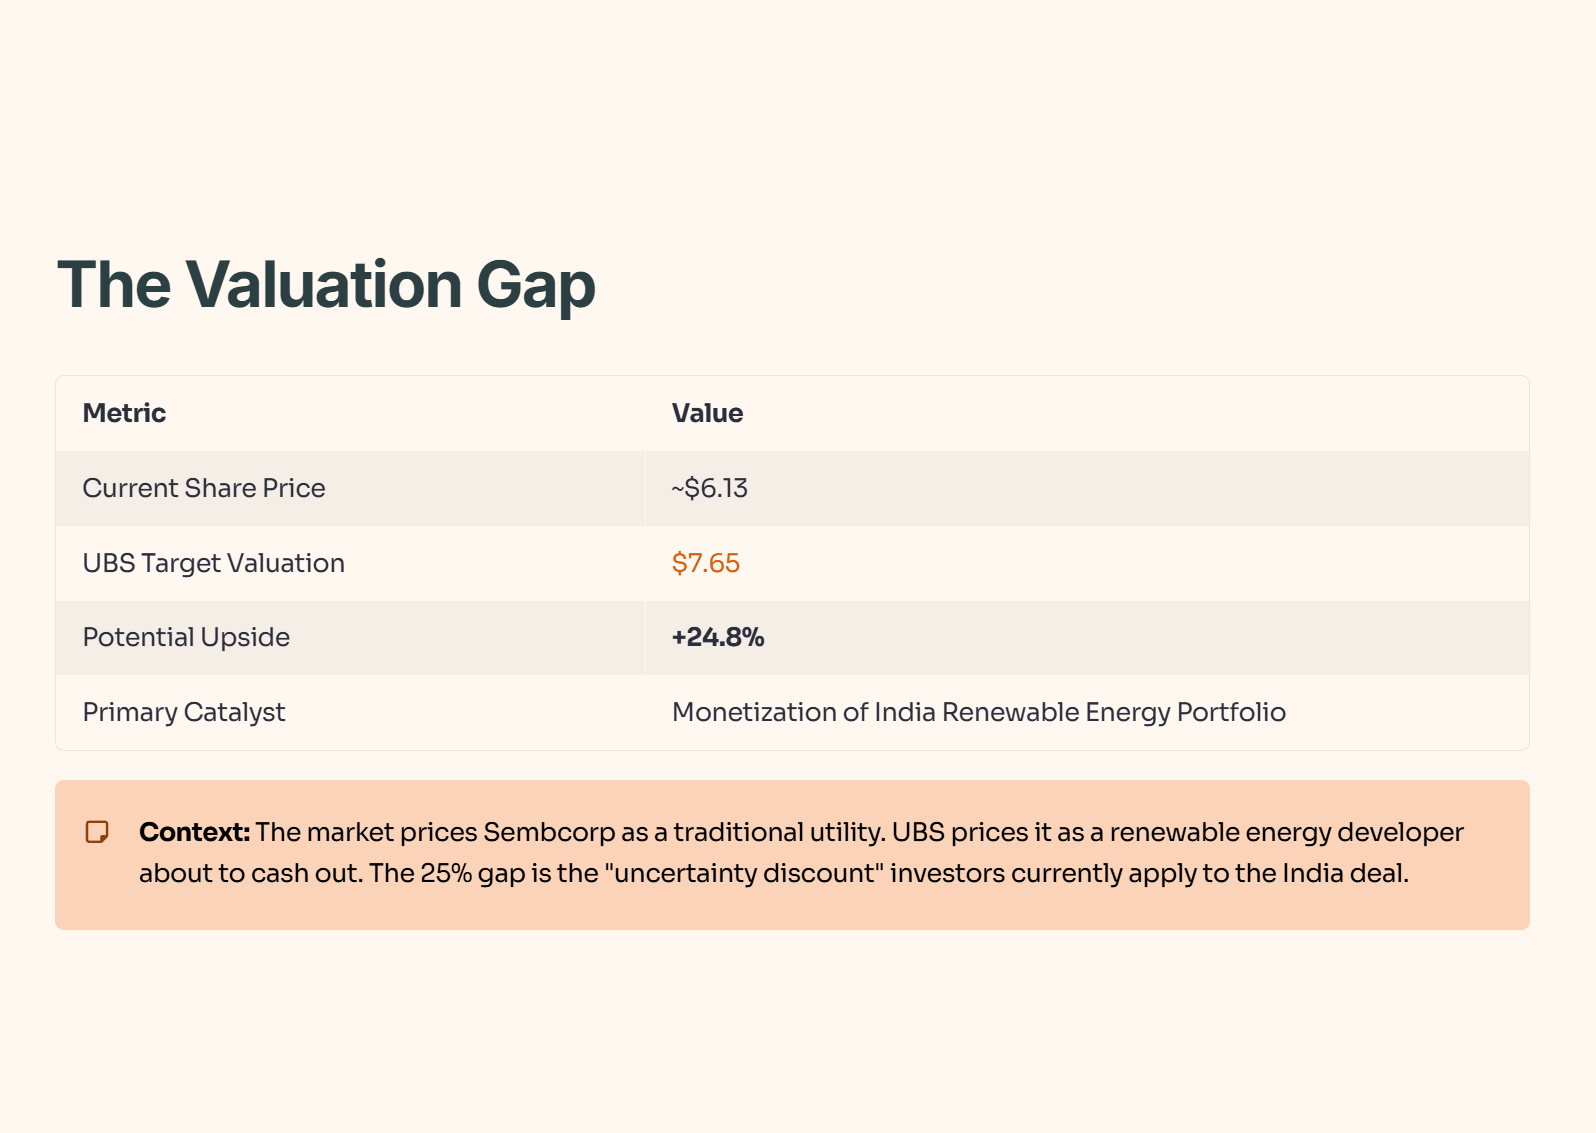
Context: The market is currently pricing Sembcorp as a traditional utility. UBS is pricing it as a renewable energy developer about to cash out. The 25% gap is the “uncertainty discount” investors are currently applying to the India deal.
The Analysis: Unlocking the India “Goldmine”
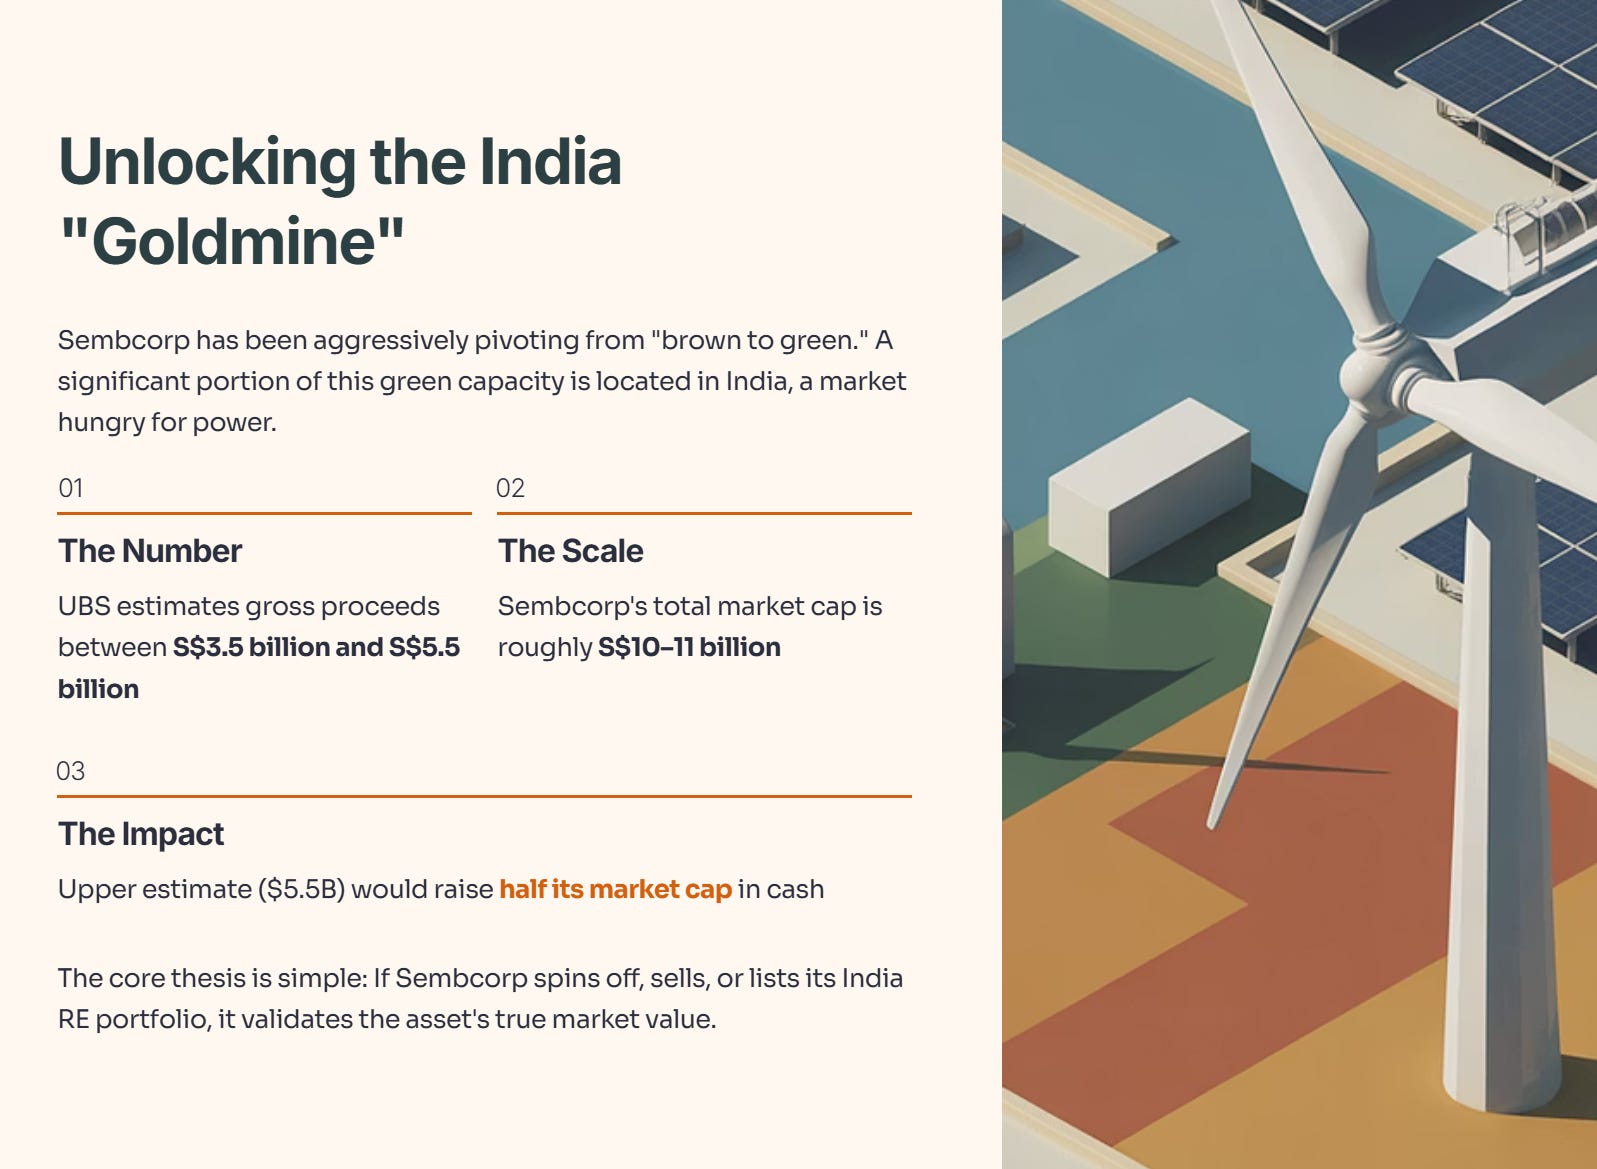
Sembcorp has been aggressively pivoting from “brown to green.” A significant portion of this green capacity is located in India, a market hungry for power.
The core thesis is simple: If Sembcorp spins off, sells, or lists its India Renewable Energy (RE) portfolio, it validates the asset’s true market value.
The Number: UBS estimates gross proceeds between S$3.5 billion and S$5.5 billion.
The Scale: Sembcorp’s total market cap is roughly S$10–11 billion.
The Impact: If the upper end of that estimate ($5.5B) is realized, Sembcorp would effectively be raising half its market cap in cash.
Table 2: The “Value Unlock” Scenarios
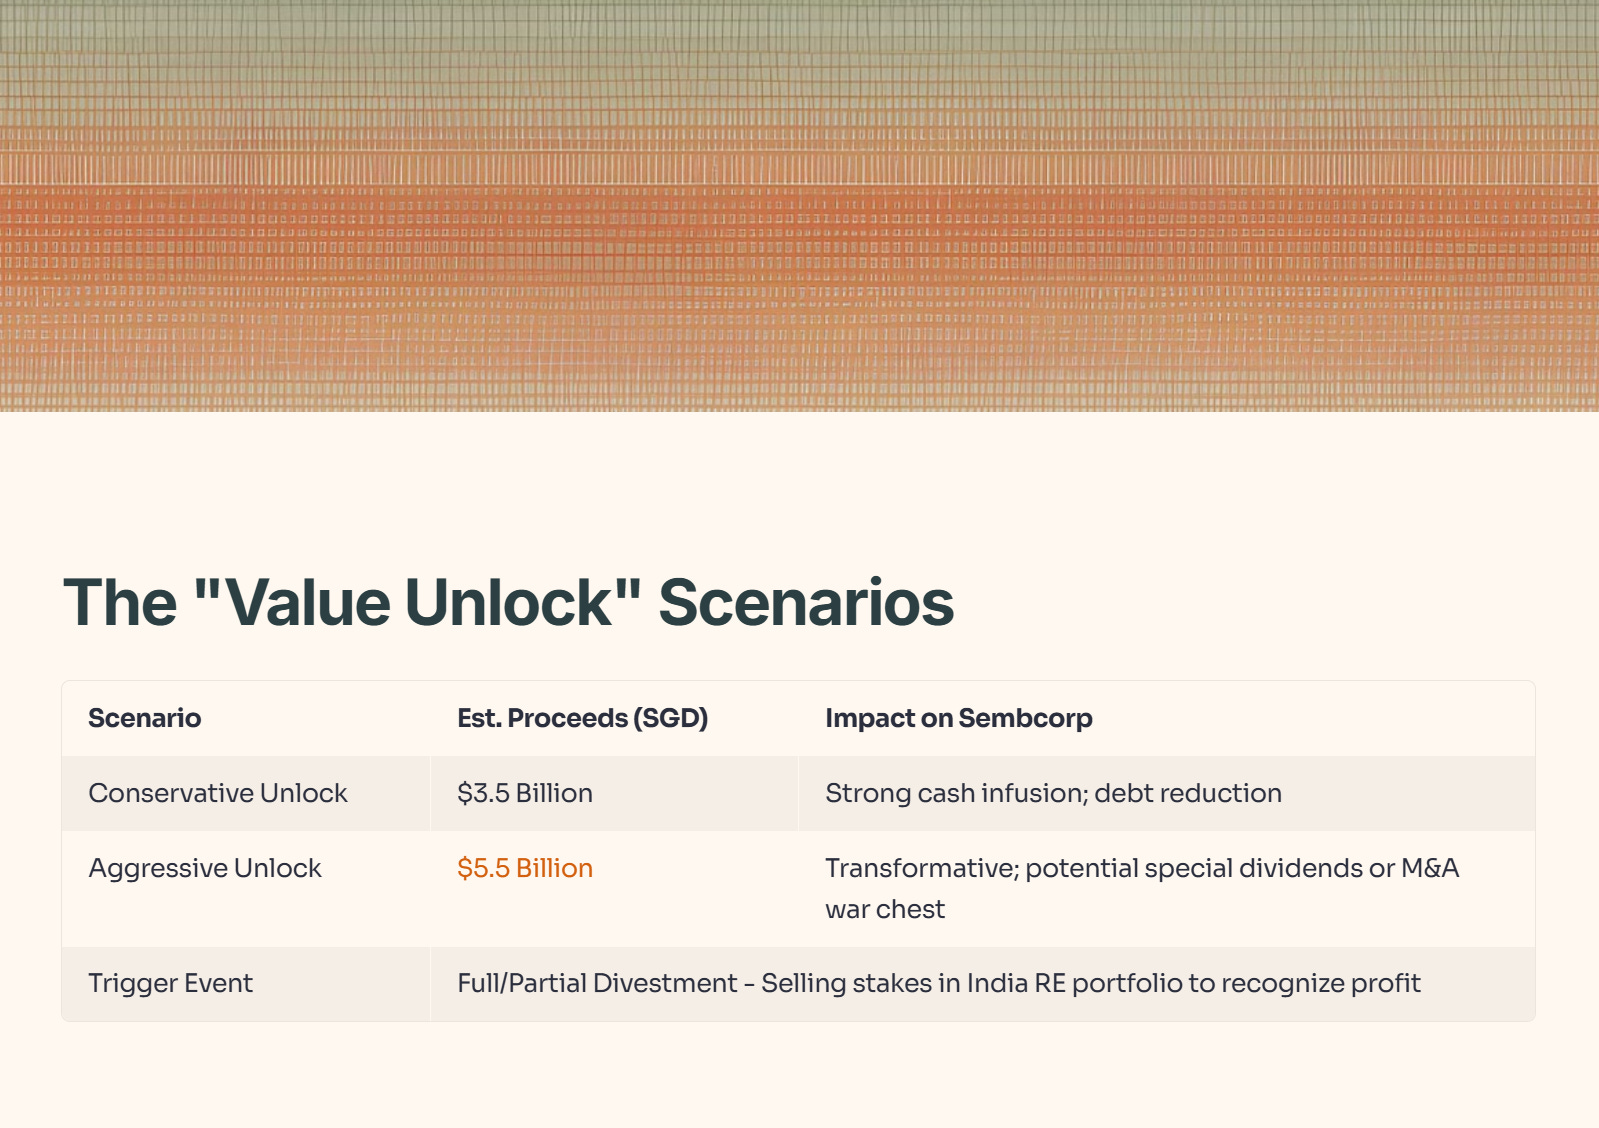
Context: This liquidity allows Sembcorp to operate a “Capital Recycling Machine.” They build assets, stabilize them, sell them at a premium to pension funds/insurers, and use the cash to build more assets (currently eyeing Australia and Thailand). It turns Sembcorp from a utility provider into an asset manager.
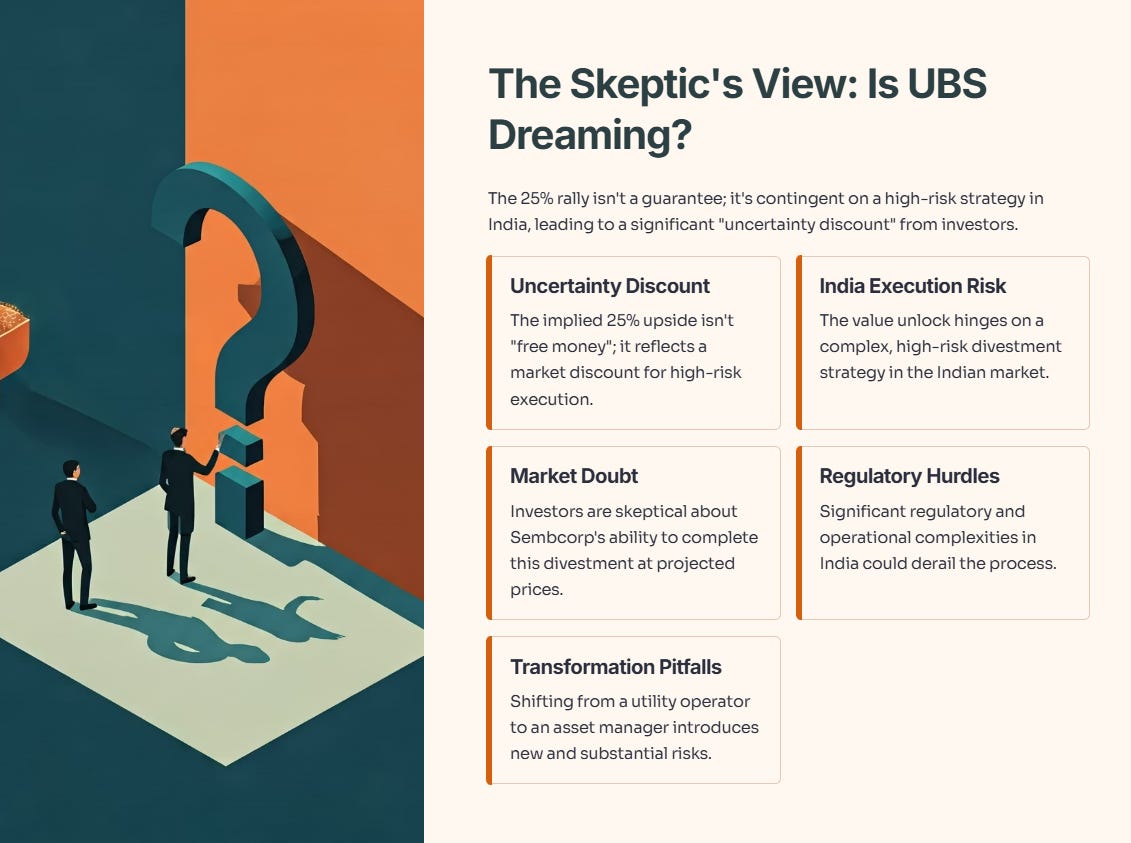
The Skeptic’s View: Is UBS Dreaming?
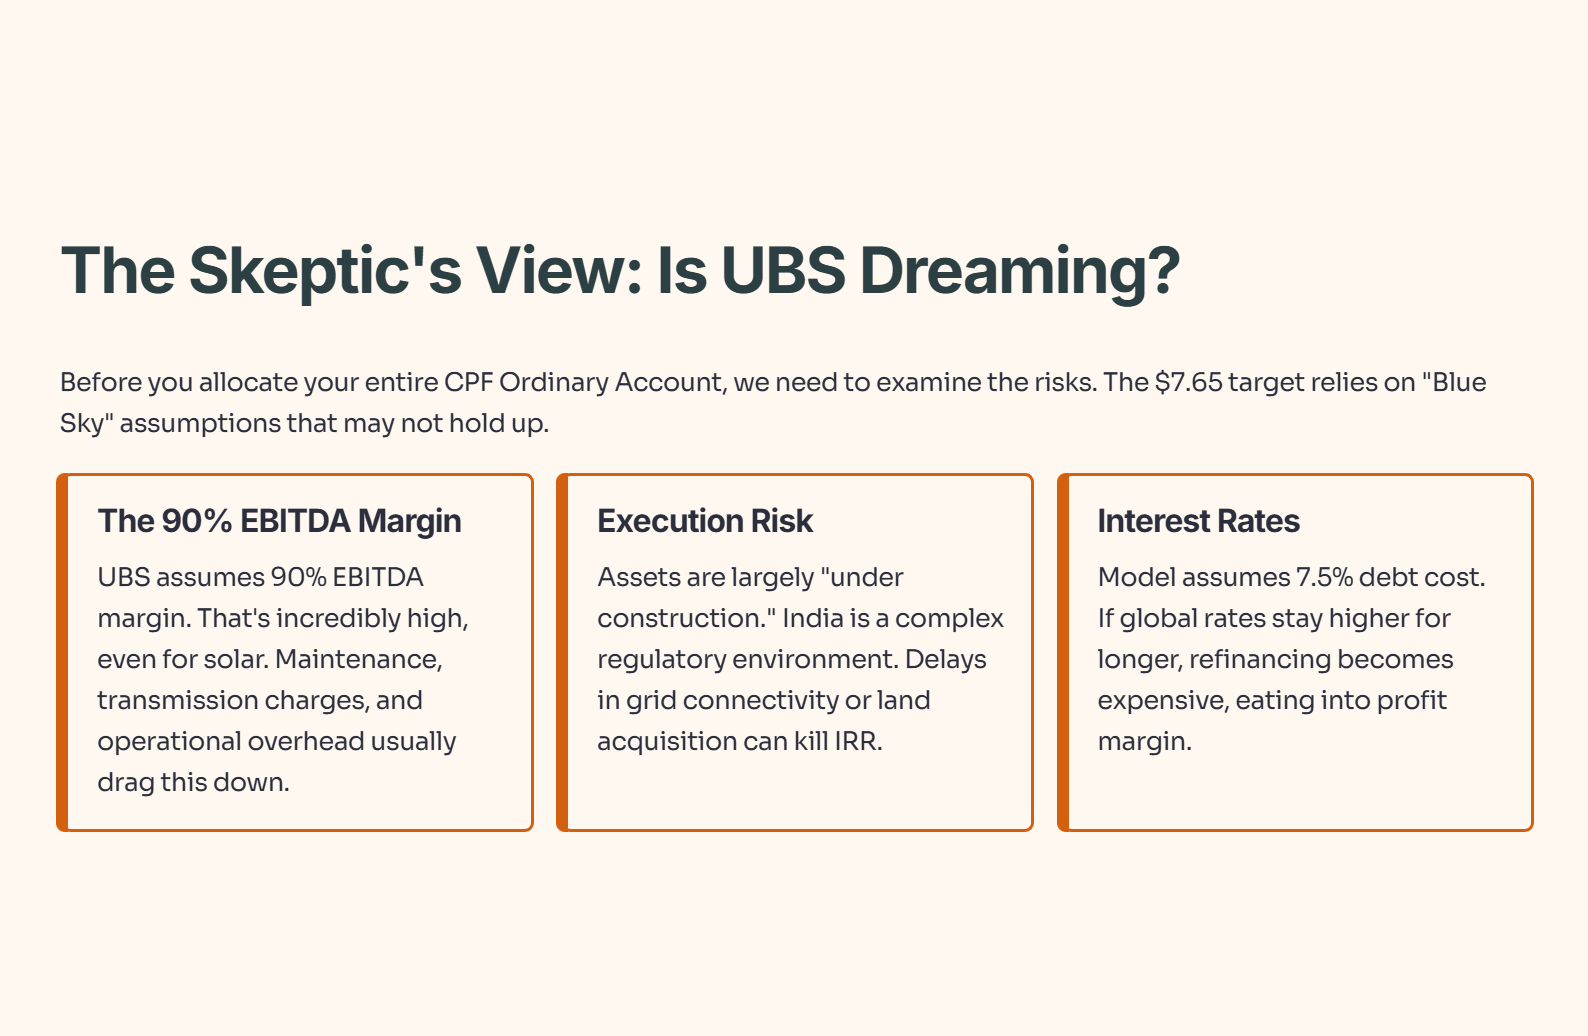
Before you allocate your entire CPF Ordinary Account into this, we need to look at the risks. The $7.65 target relies on “Blue Sky” assumptions that may not hold up in the real world.
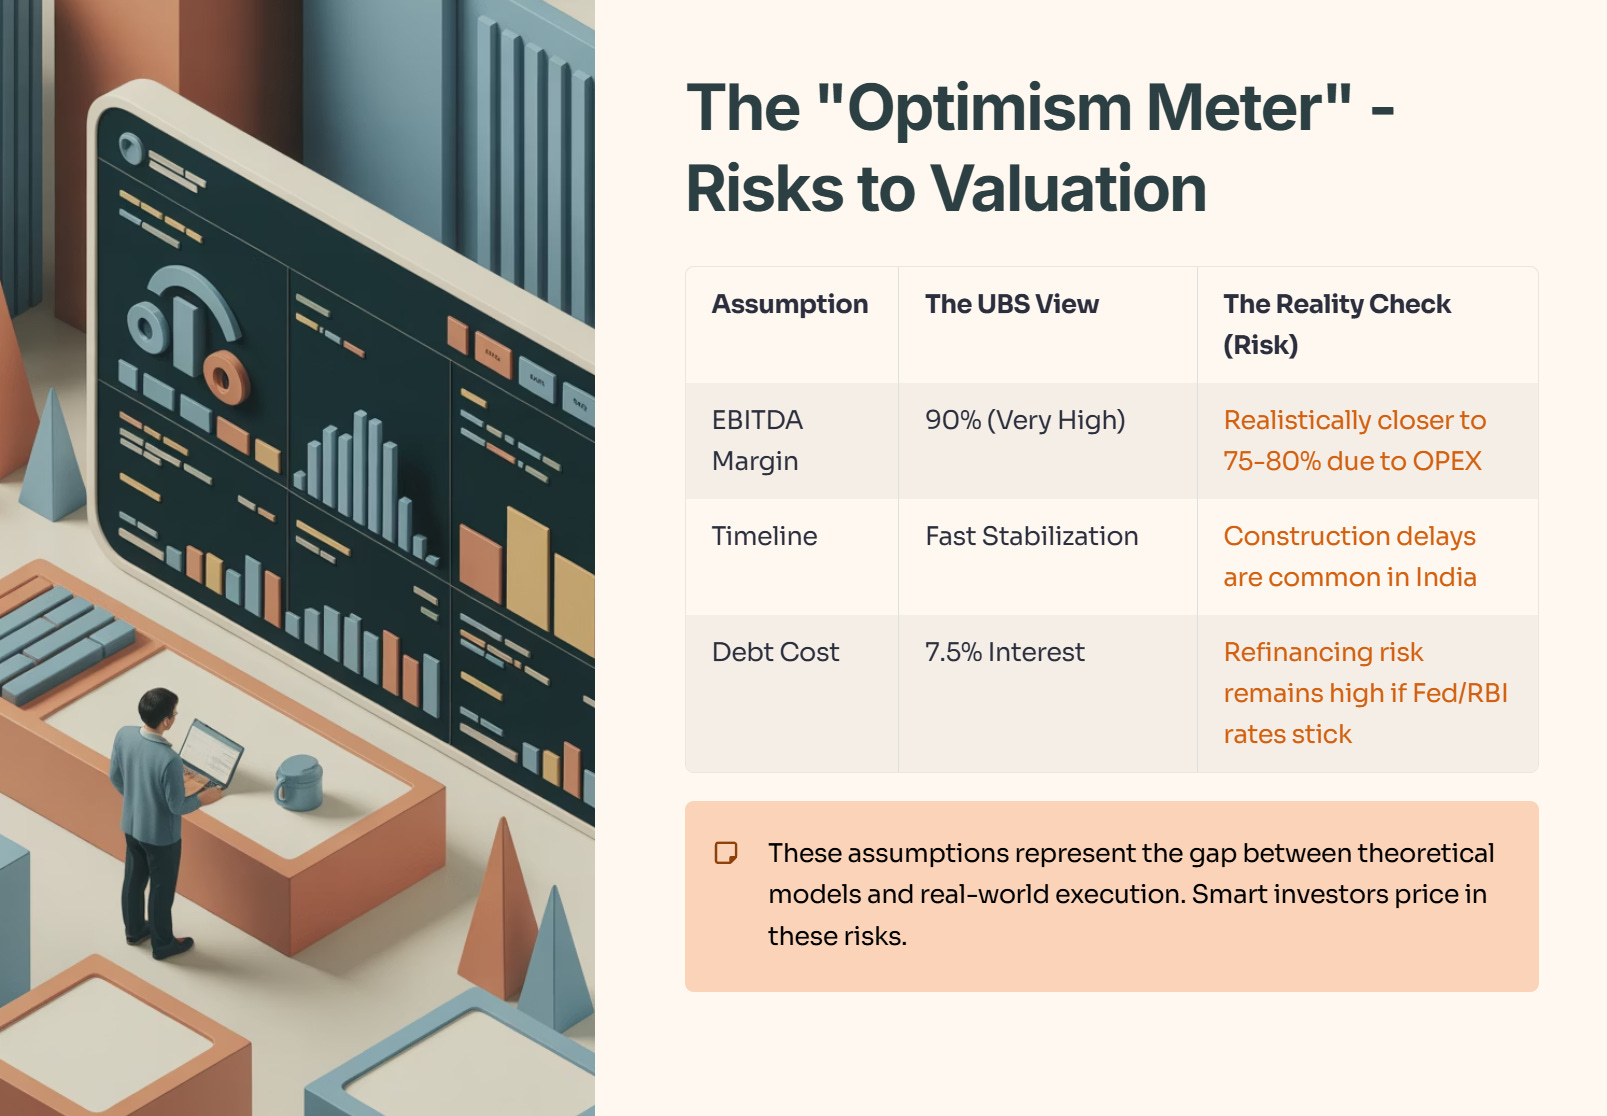
The 90% EBITDA Margin: UBS assumes these renewable projects will run at a 90% EBITDA margin. That is incredibly high, even for solar (where the sun is free). Maintenance, transmission charges, and operational overhead usually drag this down.
Execution Risk: These assets are largely “under construction.” India is a complex regulatory environment. Delays in grid connectivity or land acquisition can kill IRR (Internal Rate of Return).
Interest Rates: The model assumes a debt cost of 7.5%. If global rates stay higher for longer, refinancing these projects becomes expensive, eating into the profit margin.
Table 3: The “Optimism Meter” - Risks to the Valuation

Iggy’s Insights (The Alpha)
This is how I am viewing this trade for my personal portfolio and watchlist.
