



The Problem Nobody’s Talking About
You scan your holdings. The DPU looks steady. The yield is 6%. Feels safe, right?
Then the earnings hit.
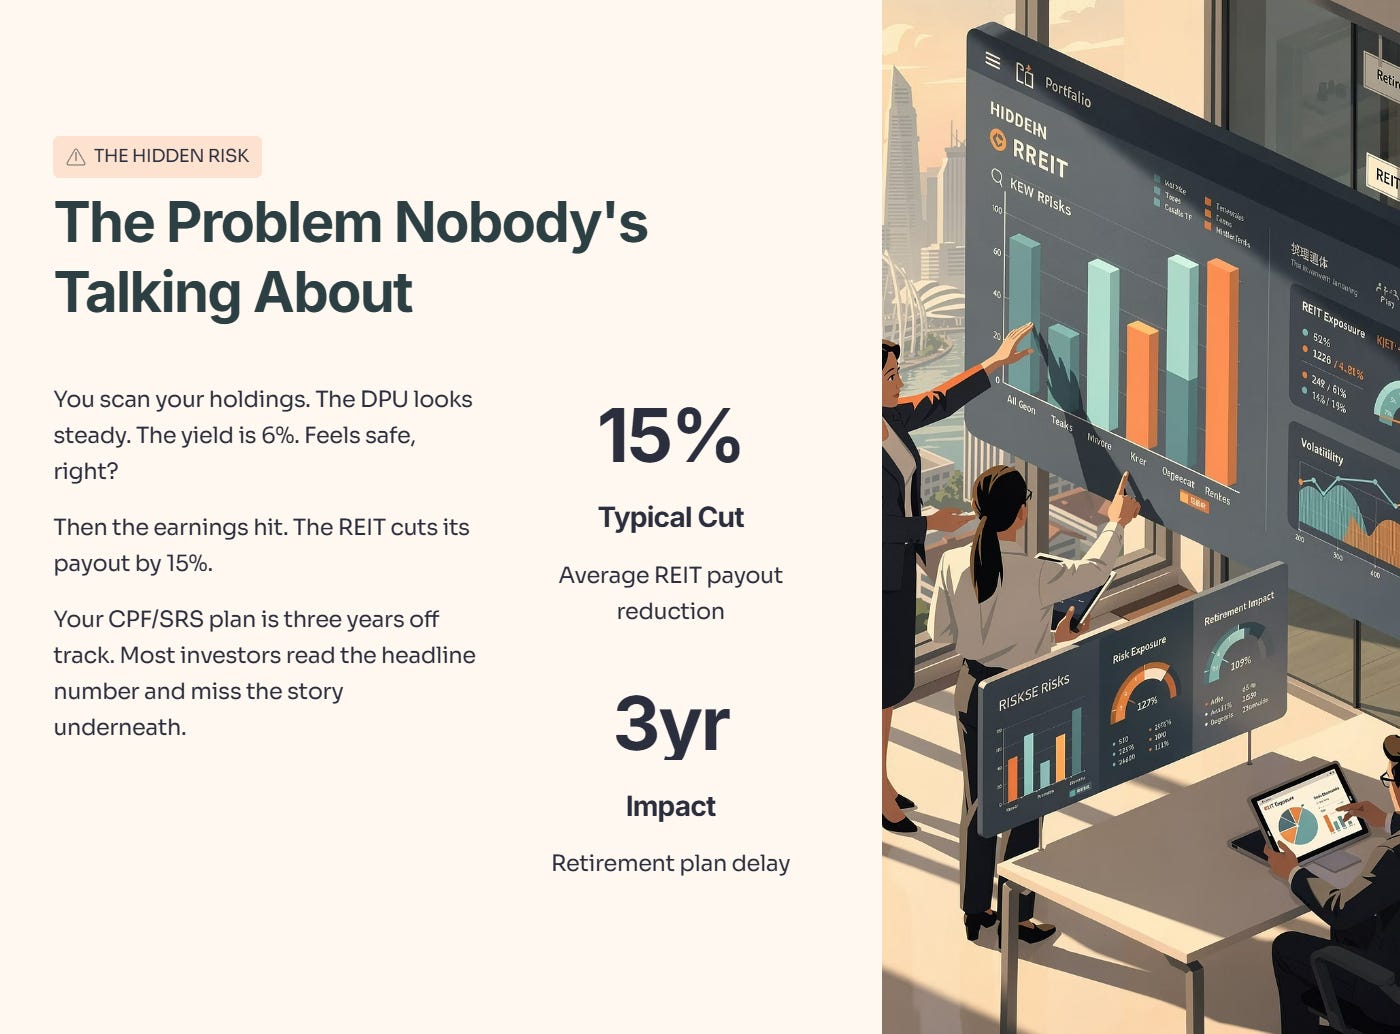
The REIT cuts its payout by 15%, or the bank guides lower on margins, and suddenly your CPF/SRS plan is three years off track. The issue is simple: most investors read the headline number (DPU or EPS) and miss the story underneath—whether that payout can actually survive the next rate cycle.
That’s why I’m not just giving you five companies to watch. I’m giving you the 4 metrics that kill dividends before they announce the cut. Apply this framework now, and you’ll front-run the market’s panic later.

In This Article:

[60-Day Earnings Window]
[REIT 4-KPI Safety Check]
[ESR-REIT (J91U)]
[Sasseur REIT (CRPU)]
[Singapore Banks: DBS, OCBC, UOB]
[ST Engineering (S63)]
[Pre-Results Action Checklist]
[The Edge You Have]
🦎 About Iggy the Investing Iguana
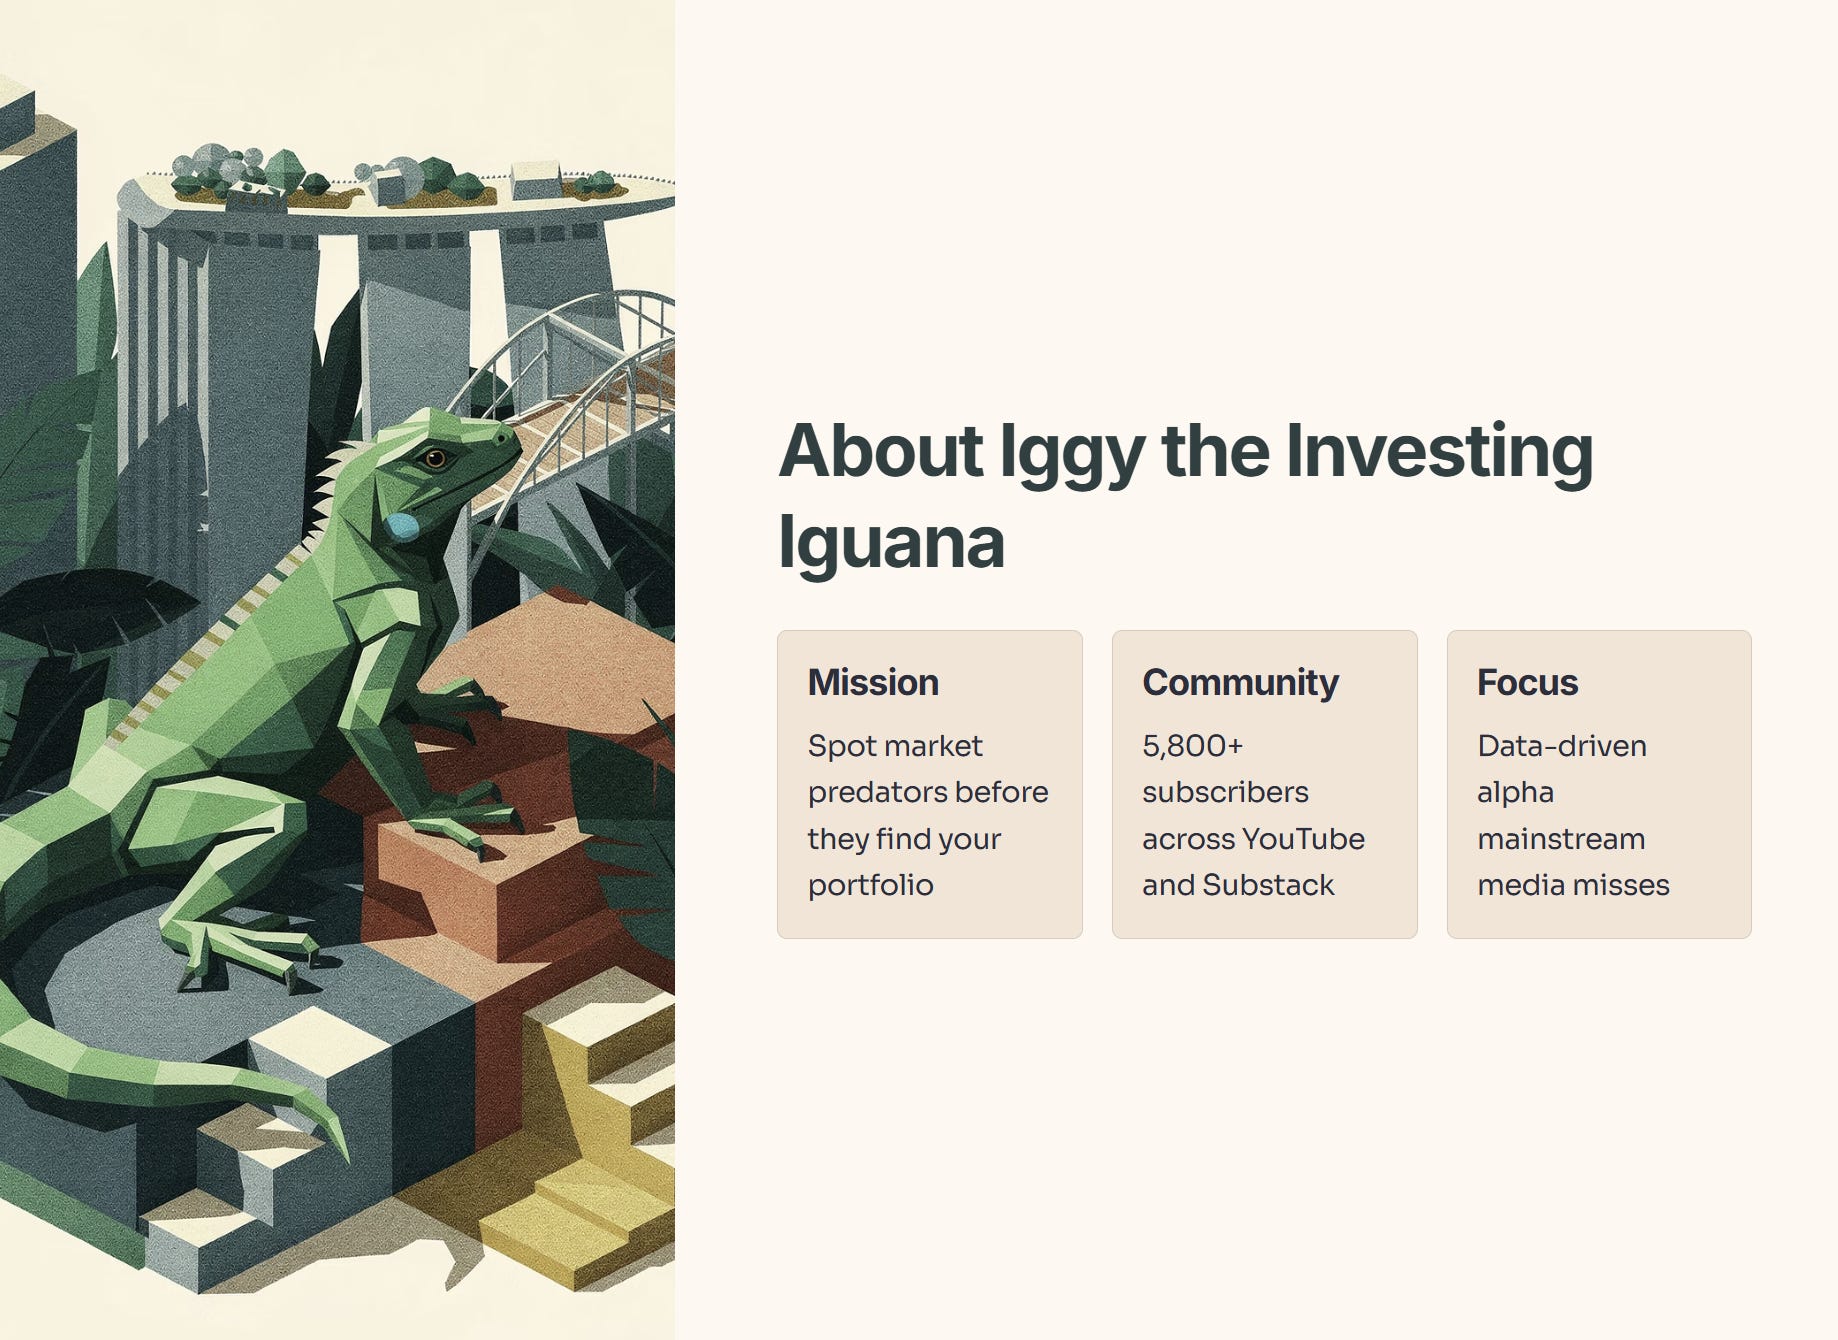
Welcome to the Iguana Pit! If you’re new here, I’m Iggy: your guide through the dense jungle of the Singapore markets. My mission is simple: to spot the predators before they spot your portfolio.
We are now 5,800+ subscribers strong across YouTube and Substack, focusing purely on the data-driven alpha that mainstream media misses.
🚀 Join the “Elite 150” Inner Circle
Real alpha is found behind the velvet rope. Stop following the herd and start following the data with our 150+ paid members.
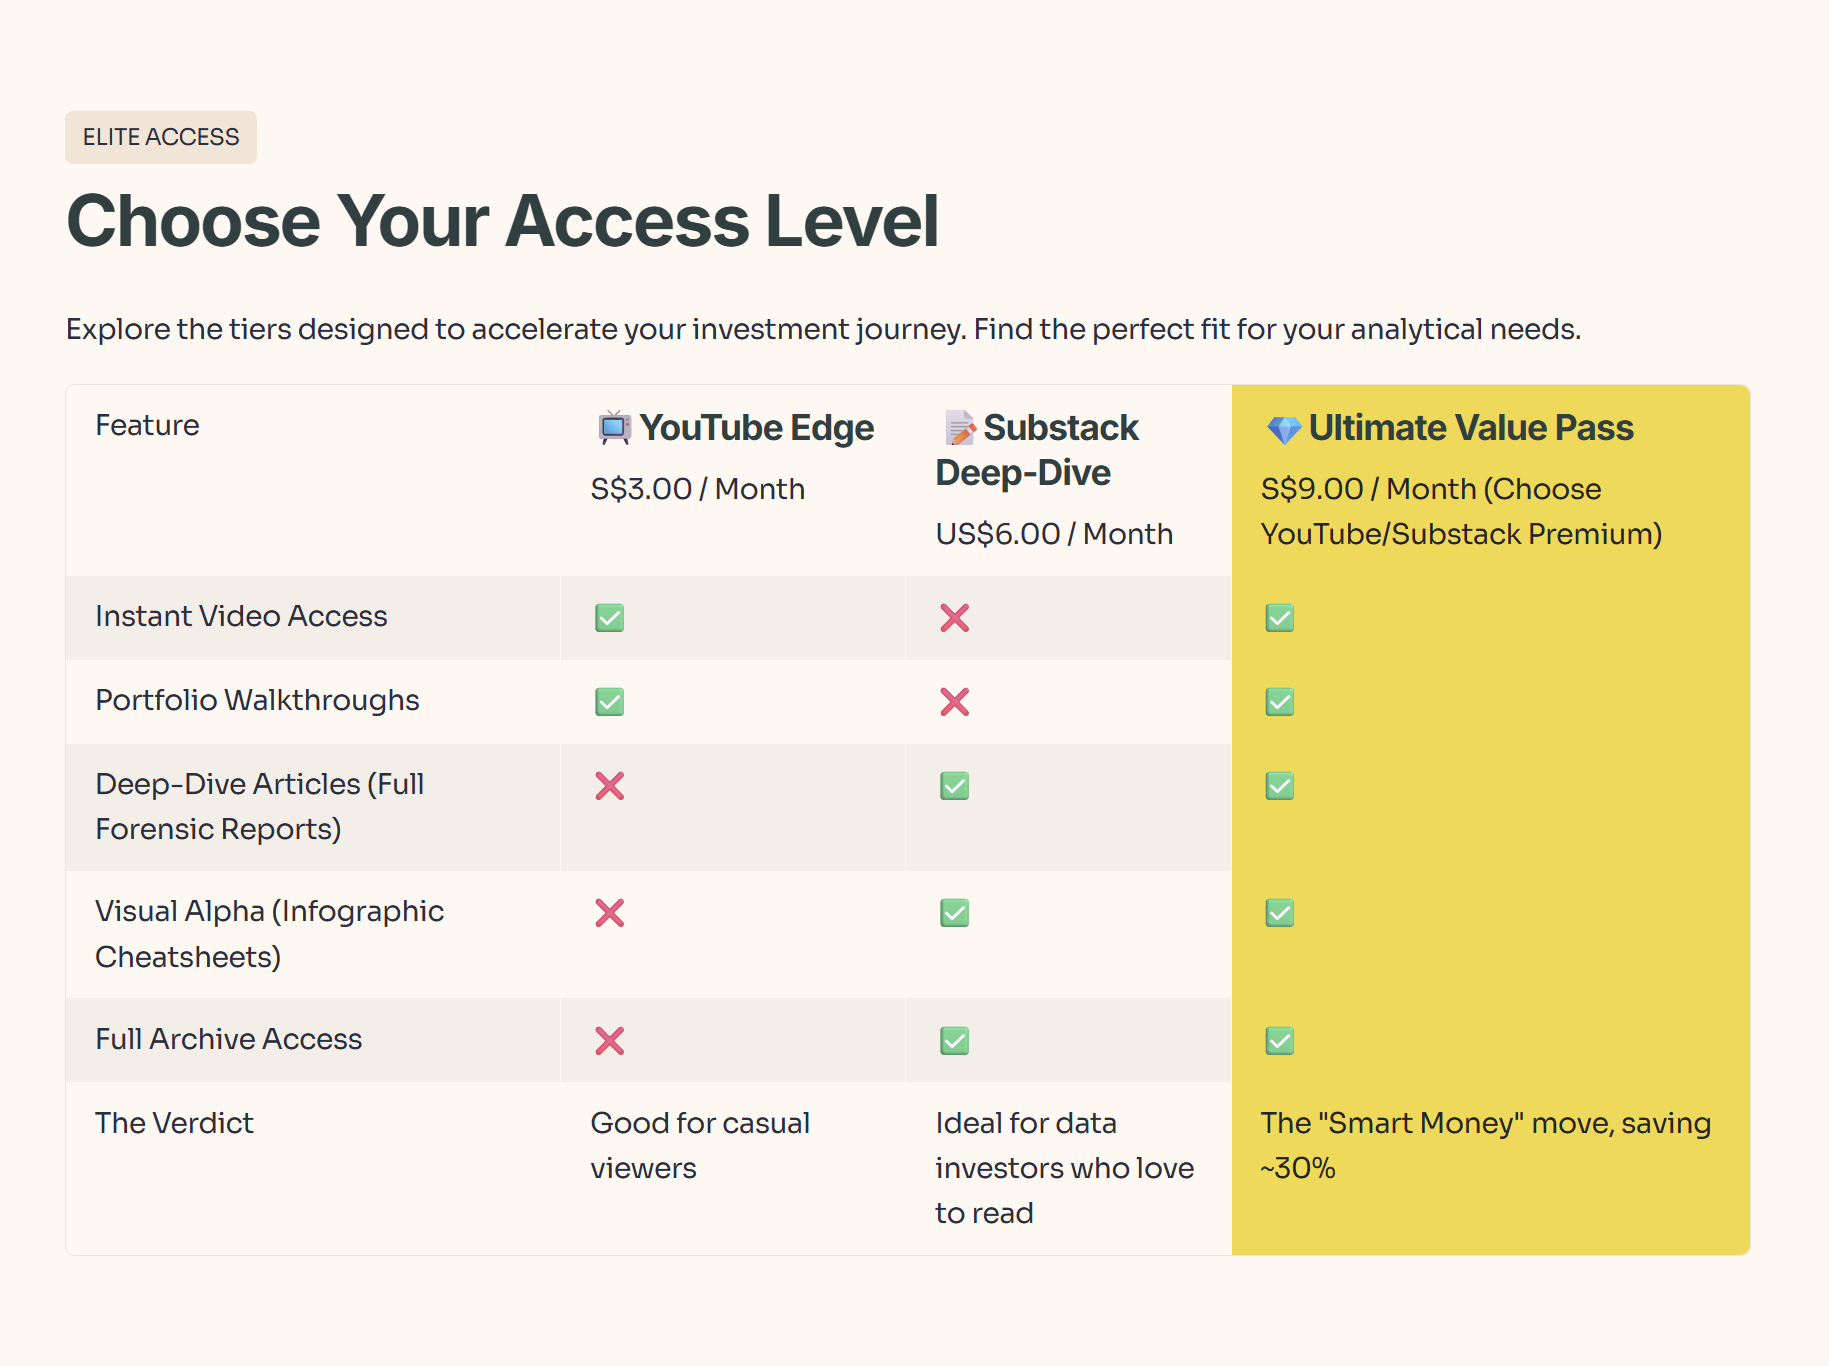
📺 The YouTube Edge (S$3/mo): Beat the Delay.
Instant Access: Watch new videos the moment they drop.
The Free Tier Trap: Free subscribers wait up to 14 days to see the same video. (By then, the news is old and the trade is gone).
📝 The Substack Deep-Dive (US$6/mo): Unlock the Vault.
Zero Paywalls: Read the full “Deep Dive” articles and “Substack Exclusive” articles found only on Substack.
Visual Alpha: Download exclusive Infographic Cheatsheets not available to free readers.
💎 The Ultimate Value Pass (S$9/mo): (BEST VALUE)
Get It All: Paid via YouTube, this bundle grants you Instant Video Access AND Full Substack Access.
The Math: You save ~30% compared to buying them separately. It’s the “Smart Money” move.

Why wait 2 weeks for old news? Get the data while it’s fresh. 👉 Join Here: https://www.youtube.com/@InvestingIguana/membership
Interest Coverage Ratio
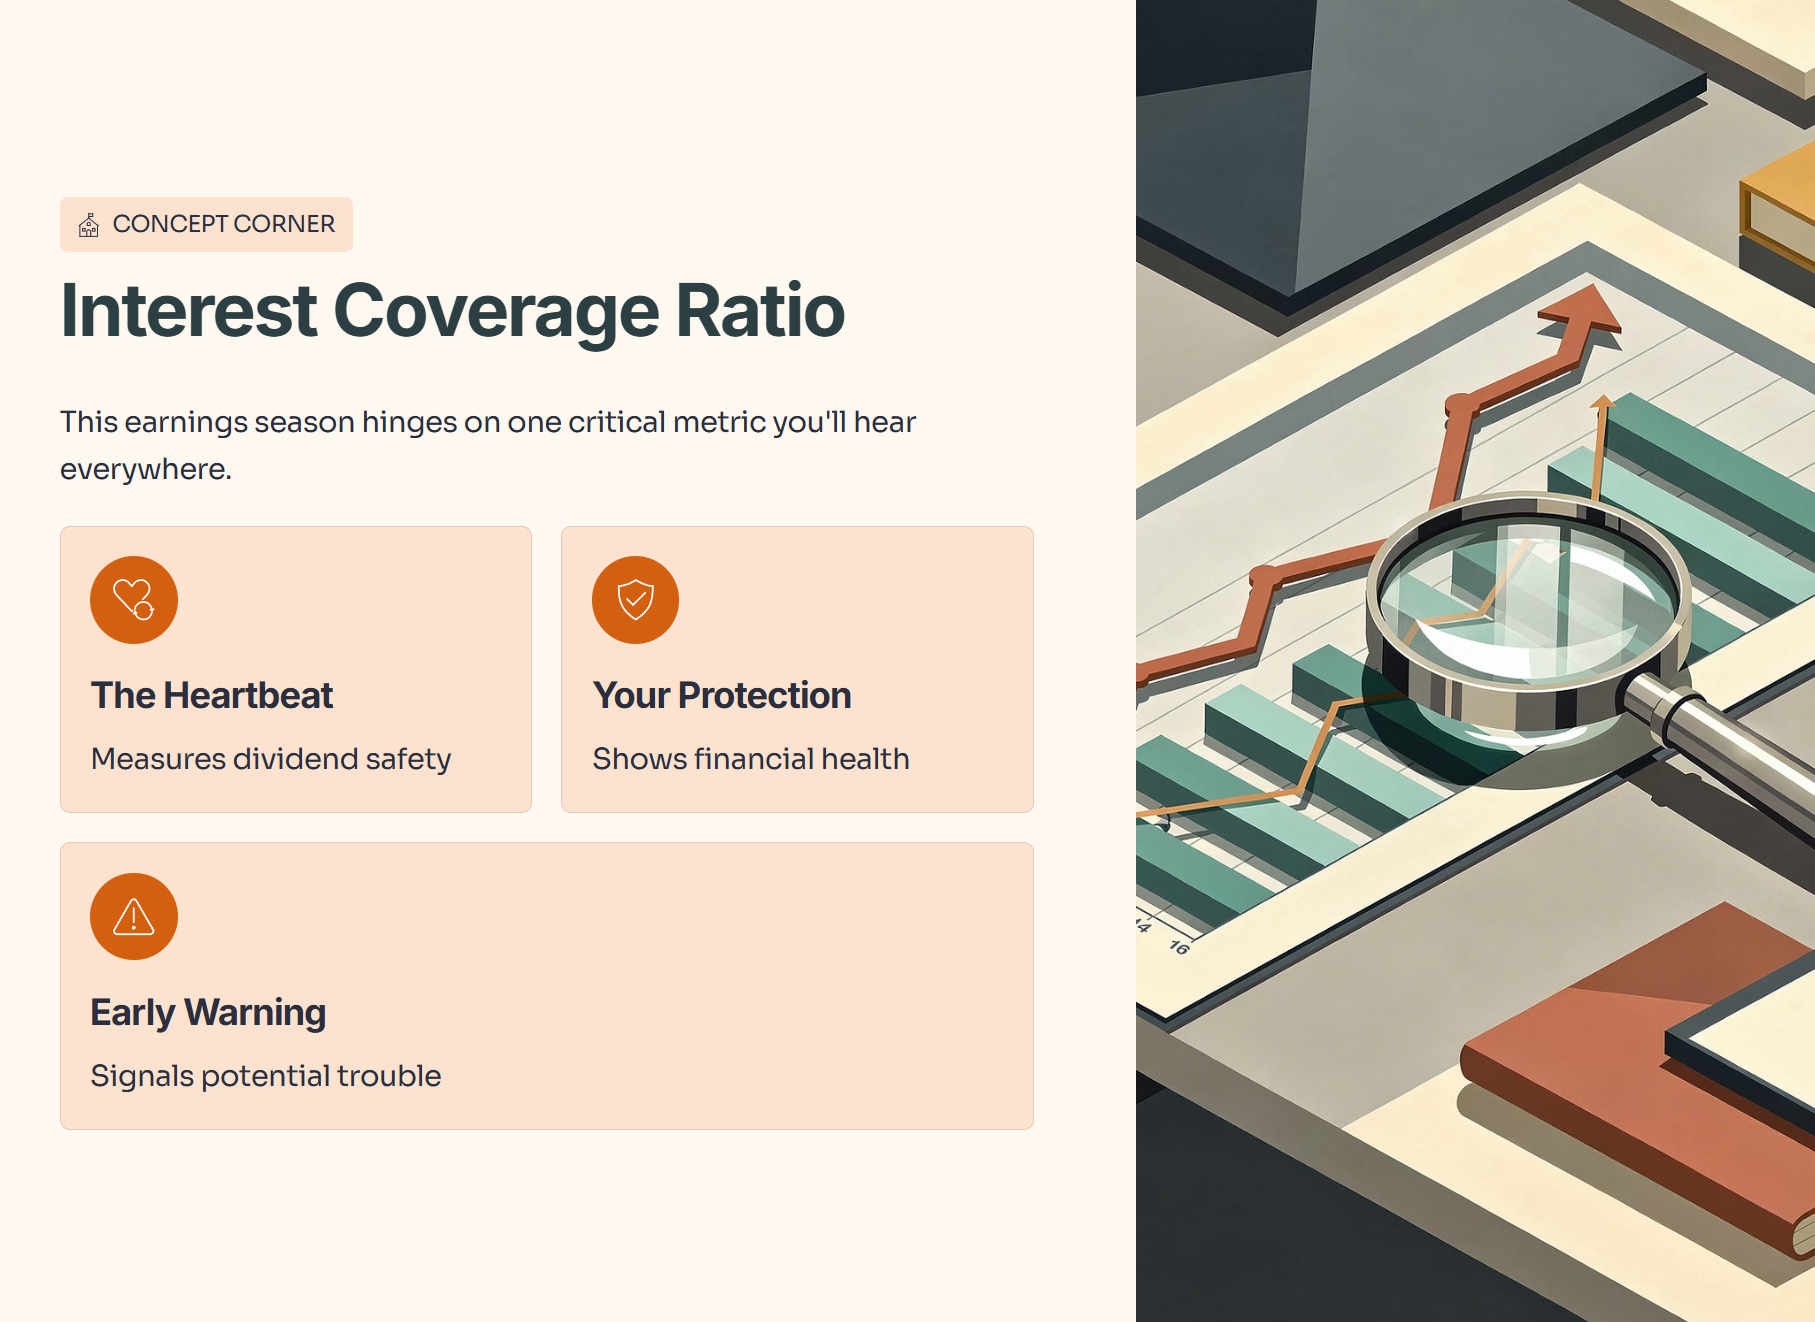
Now, to understand why this earnings season is so critical, we need to go back to school for a moment. I want to take us into the “Concept Corner” and talk about a term you are going to hear thrown around a lot in the coming weeks. That term is “Interest Coverage Ratio.”
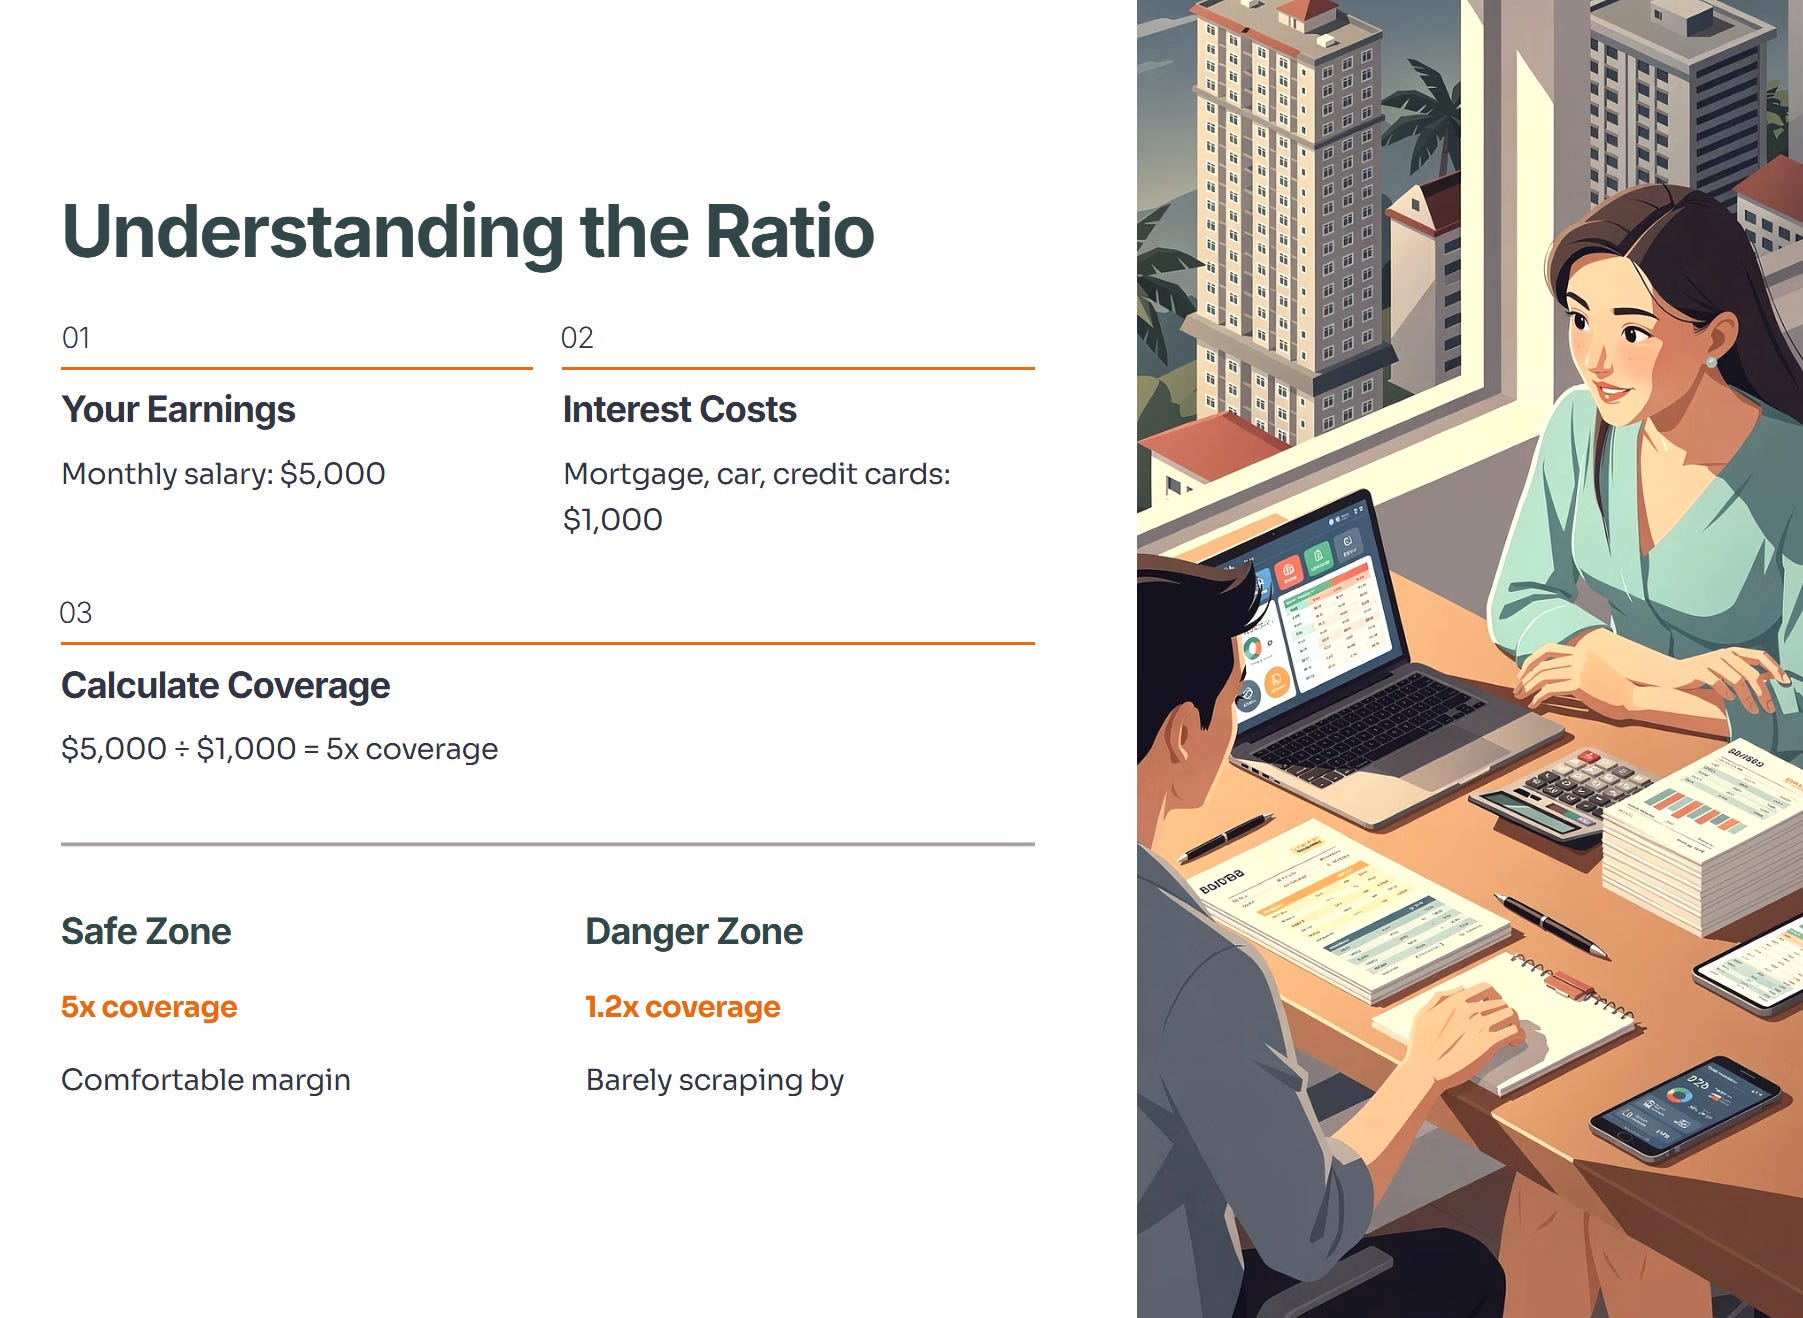
Now, before we go further, let’s pause on the term “Interest Coverage Ratio” because it sounds like accounting jargon, but it is actually the heartbeat of your dividend safety. Imagine you are running a household. Your monthly salary is five thousand dollars. That is your earnings. But you have a mortgage, a car loan, and credit card debt. The interest payments on those debts cost you one thousand dollars a month. To find your coverage ratio, you take your earnings of five thousand and divide it by your interest cost of one thousand. The result is five times. That means you can cover your interest bill five times over. You are safe. But what if interest rates go up? Suddenly, your debt cost isn’t one thousand; it is four thousand. Your coverage drops to one point two times. You are barely scraping by.
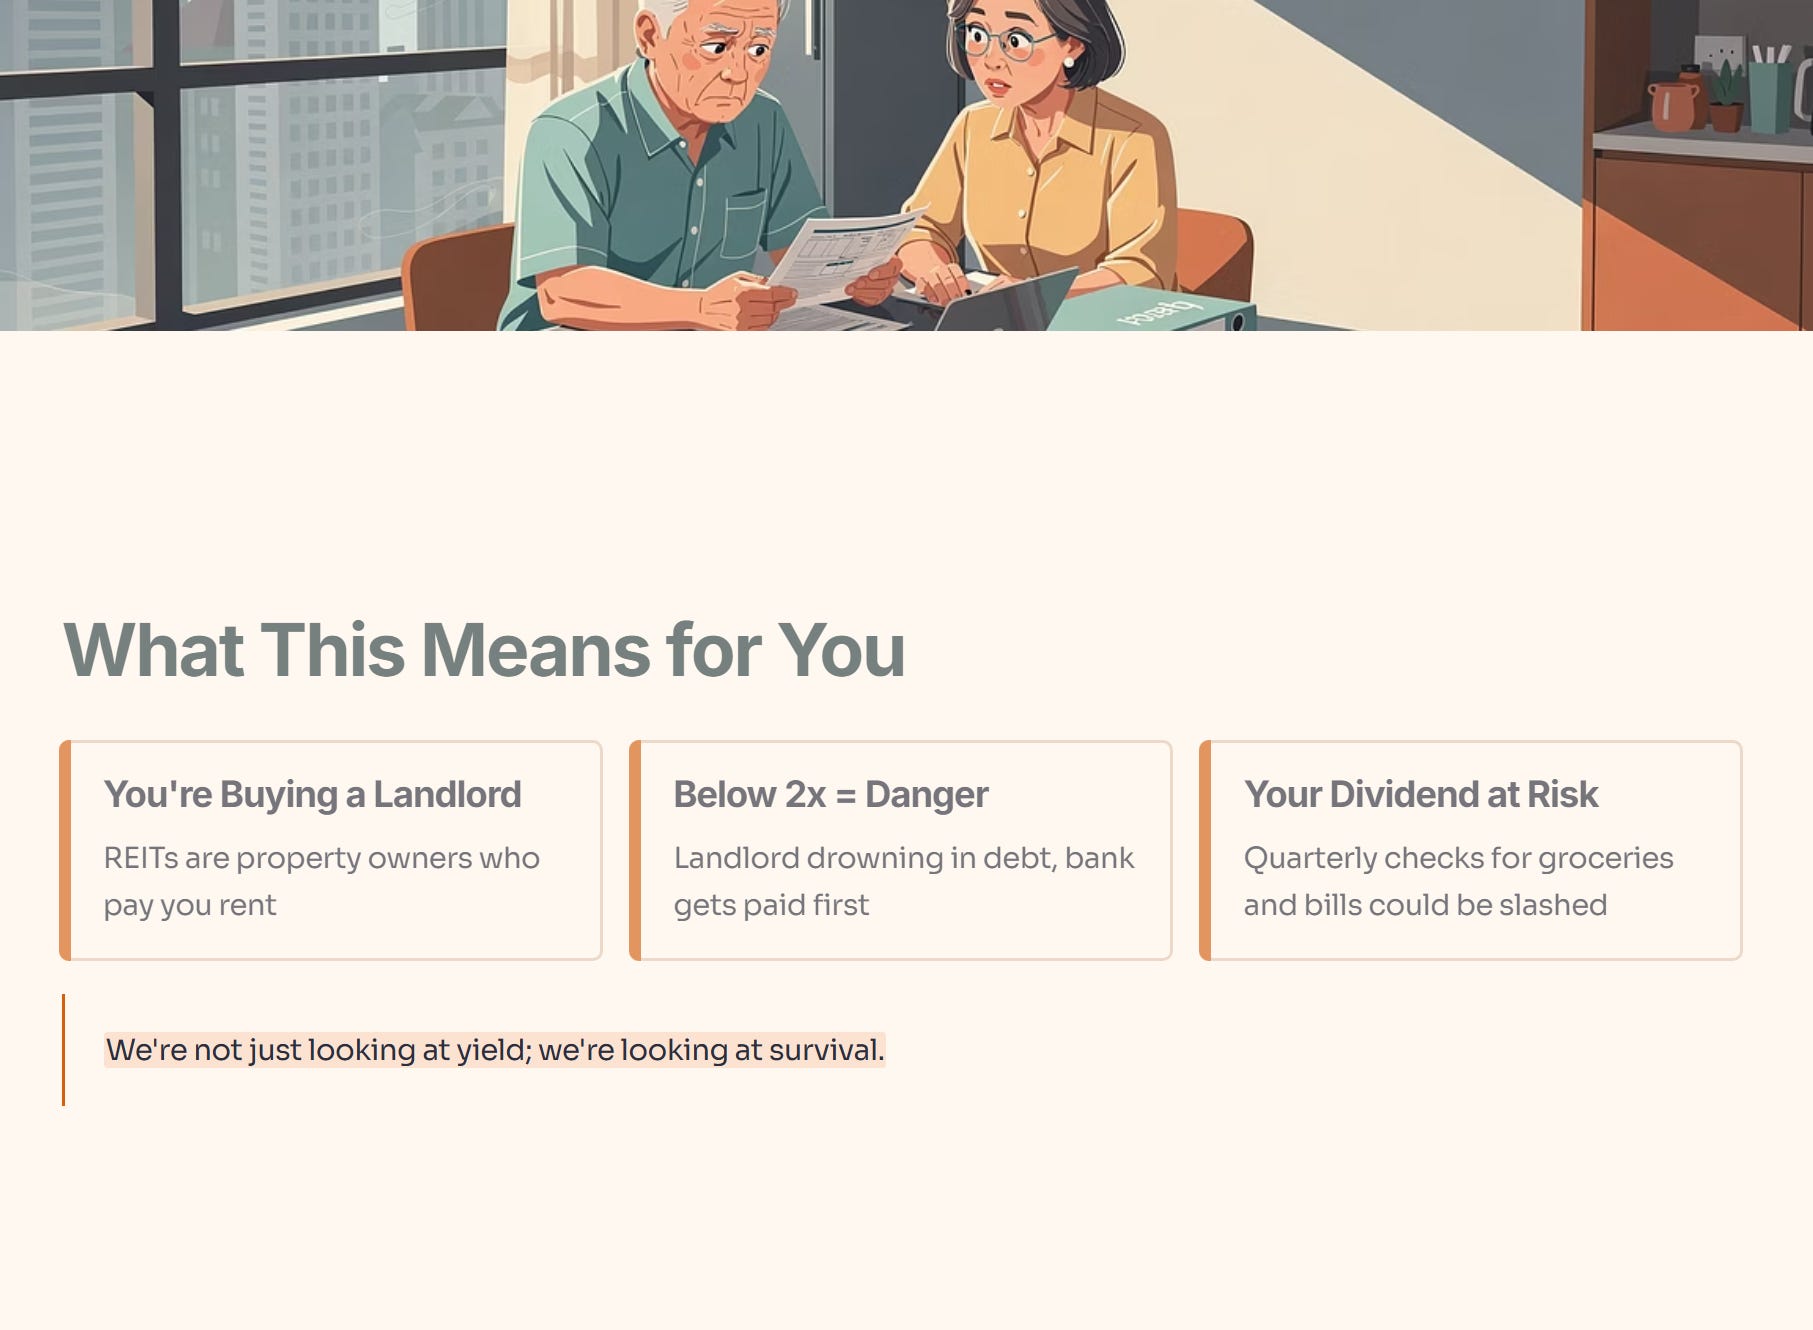
So, what does that actually mean for a Singaporean retiree’s daily life? It means that when you buy a REIT, you are essentially buying a landlord. If that landlord has an Interest Coverage Ratio that drops below two times, they are like that household drowning in debt. They have to pay the bank before they can pay you. So when you see a low coverage ratio, it means your quarterly dividend check, the money you use for groceries or utility bills, is at risk of being slashed so the REIT can save itself. We are not just looking at yield; we are looking at survival.
Concept Deep Dive: The 60-Day Window
The earnings calendar between now and late February is thick. But not all results matter equally to an income-focused, CPF-optimised portfolio. Here are the five that do.
The Earnings Radar
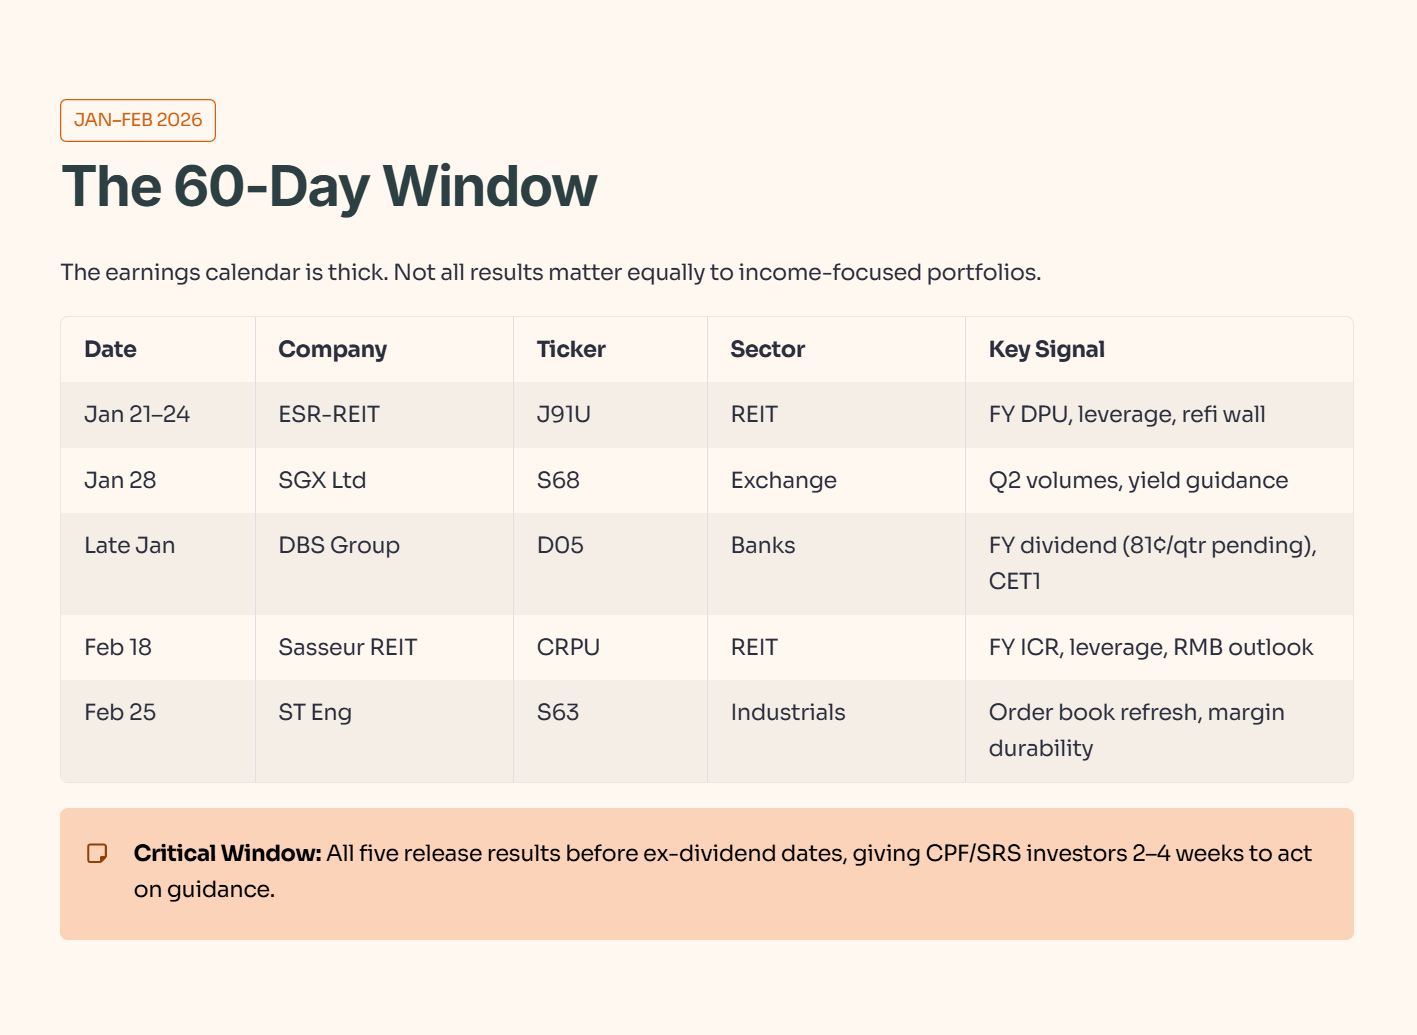
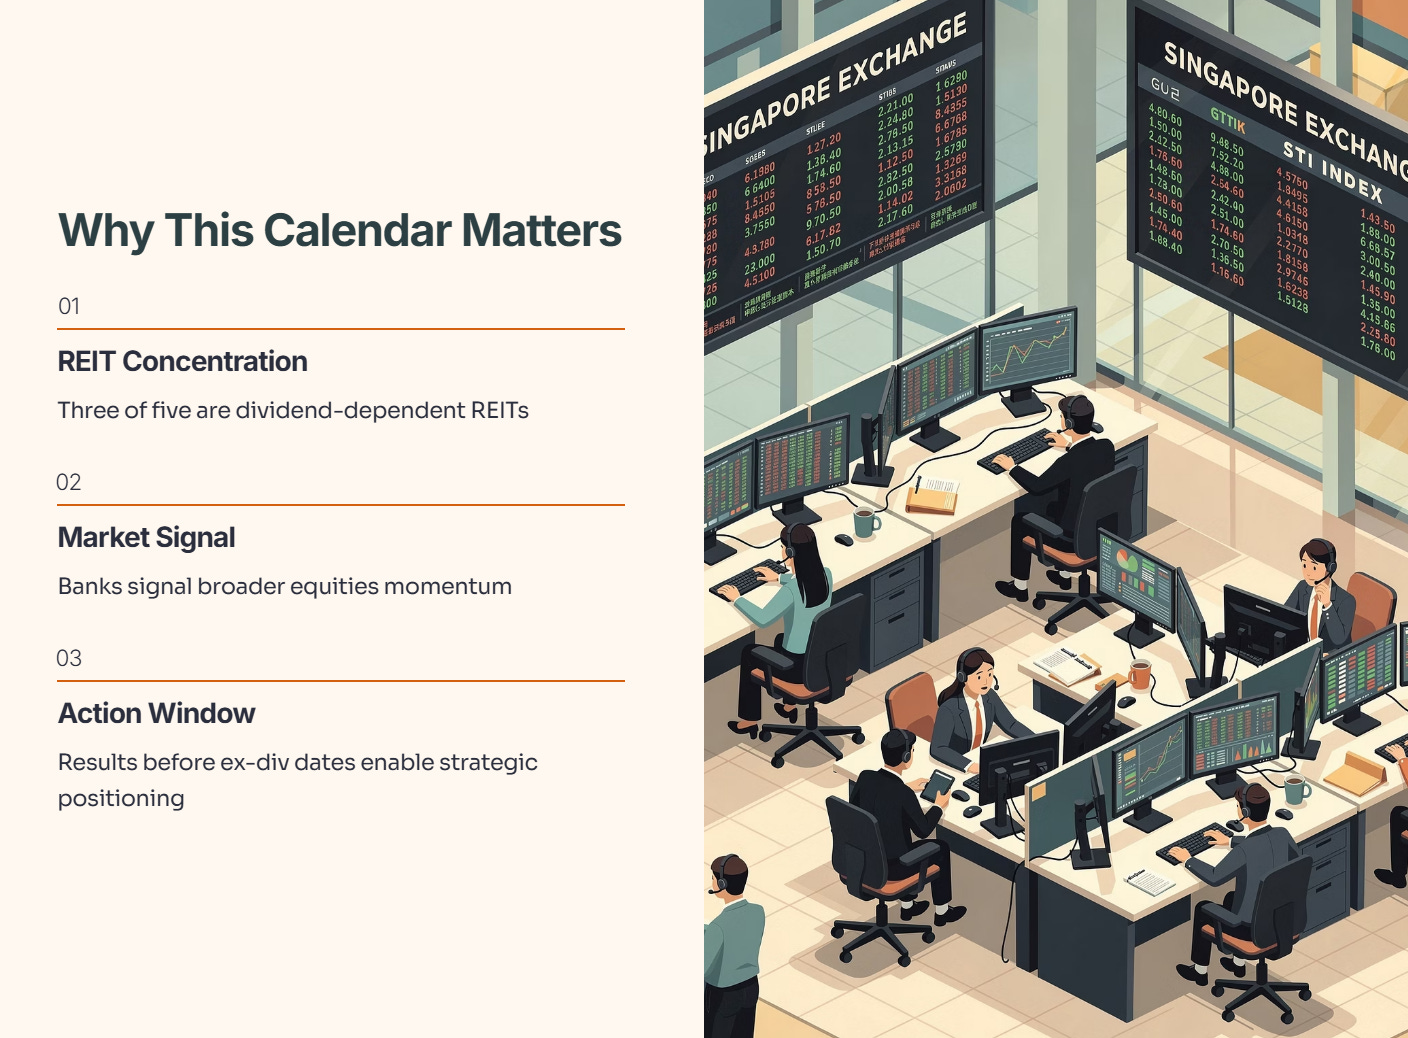
Why this calendar matters: Three of these five are REITs or REITs-adjacent (dividend-dependent). The two banks (DBS as anchor, SGX as ancillary) signal broader equities momentum. Most crucially, all five release results before their ex-dividend dates, giving CPF/SRS investors a 2–4 week window to act on guidance.
The “Iggy Audit”: REIT 4-KPI Scorecard
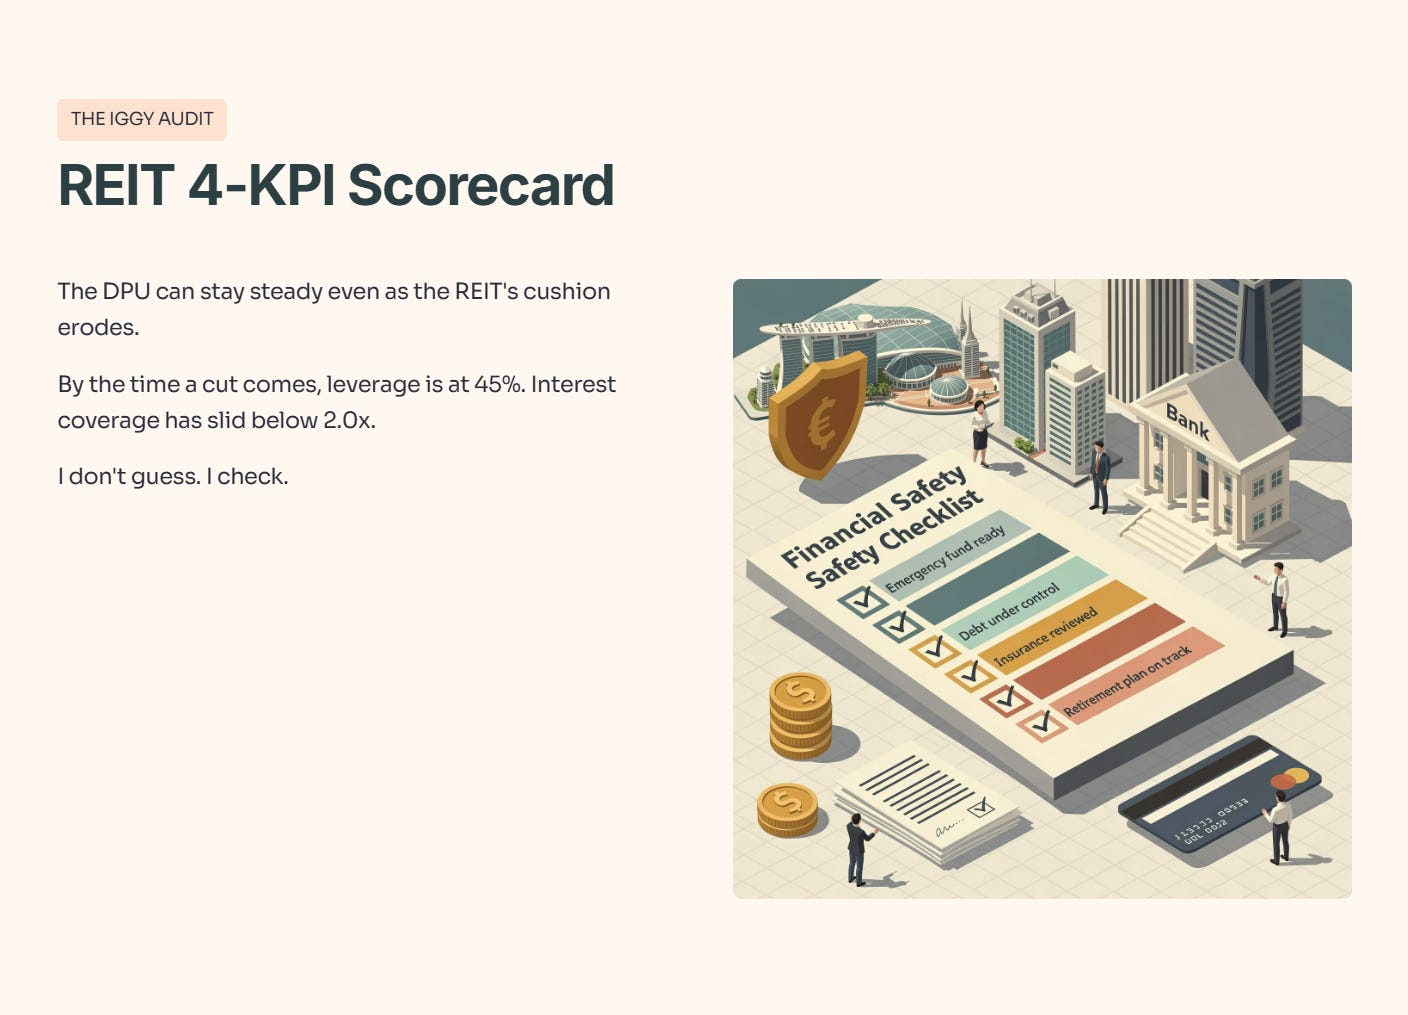
Here’s the problem with REITs. The DPU can stay steady even as the REIT’s cushion erodes. By the time a cut comes, leverage is already at 45%, interest coverage has slid below 2.0x, and refinancing costs have spiked 200 basis points.
I don’t guess. I check.
The 4-KPI Safety Matrix
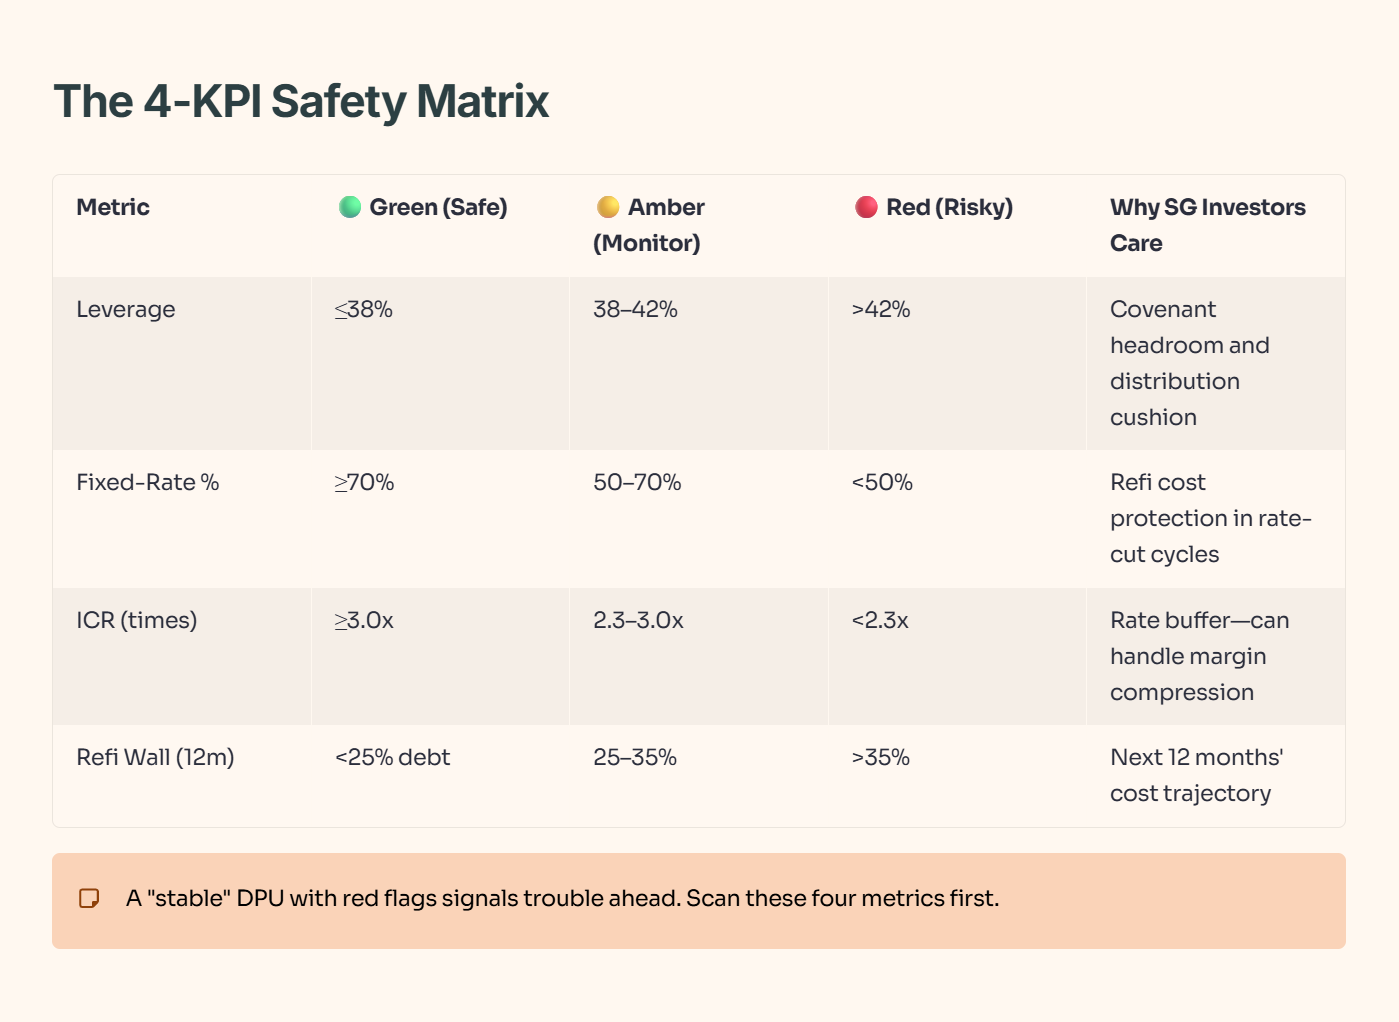
Scan these four metrics first. A “stable” DPU with red flags signals trouble ahead.
Analysis: ESR-REIT (J91U)
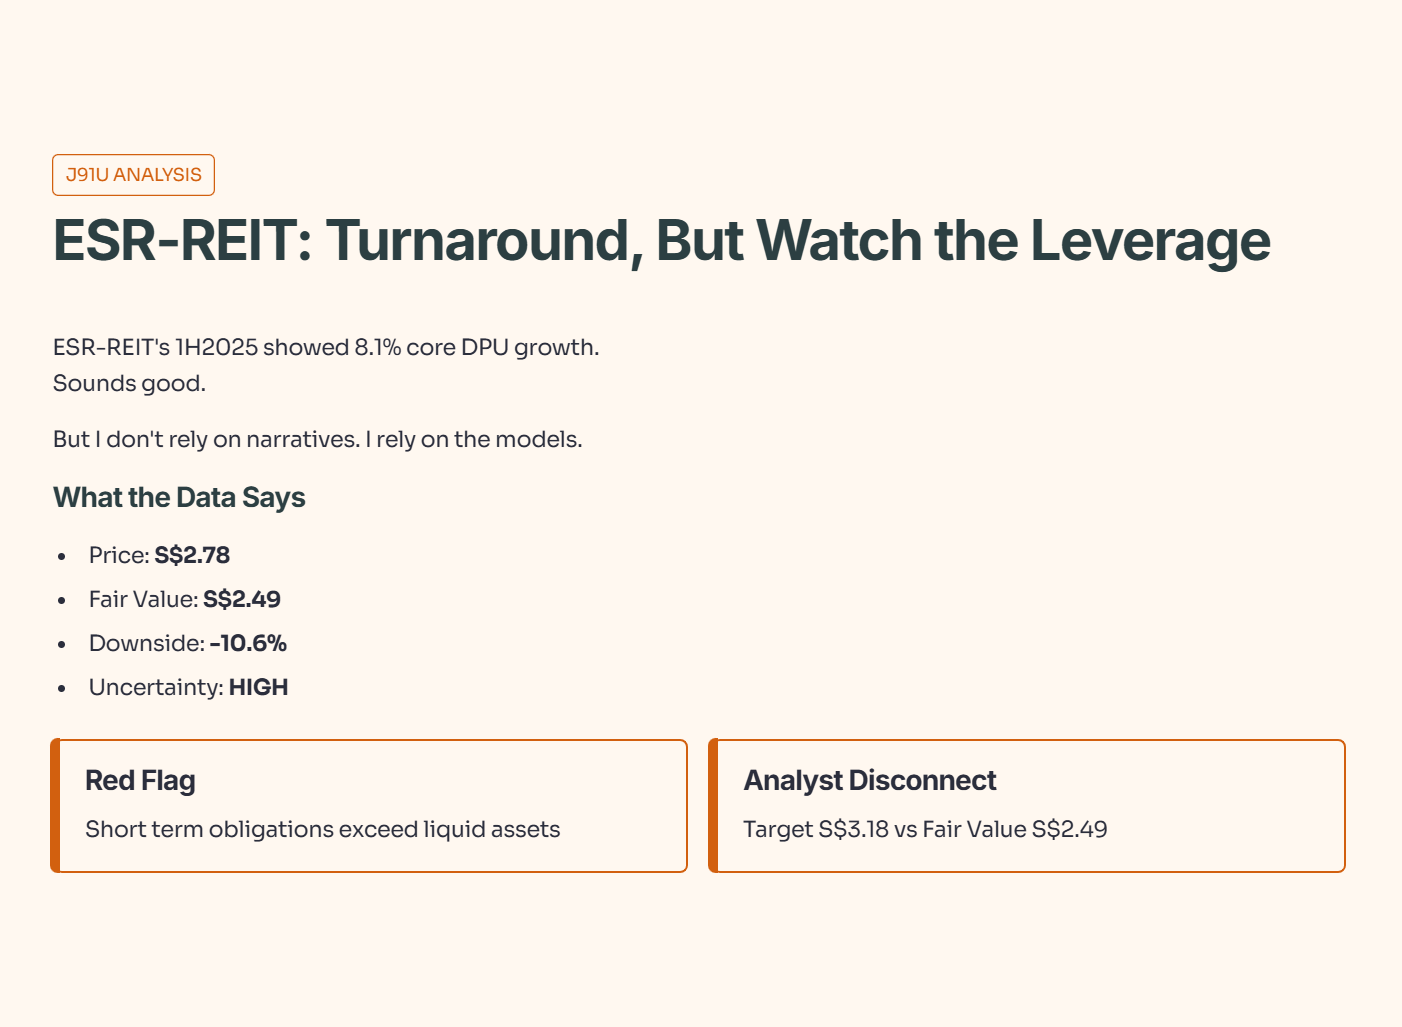
Turnaround, But Watch the Leverage
ESR-REIT’s 1H2025 showed 8.1% core DPU growth and a “strategic turnaround” narrative. Sounds good. But I don’t rely on narratives. I rely on the models.
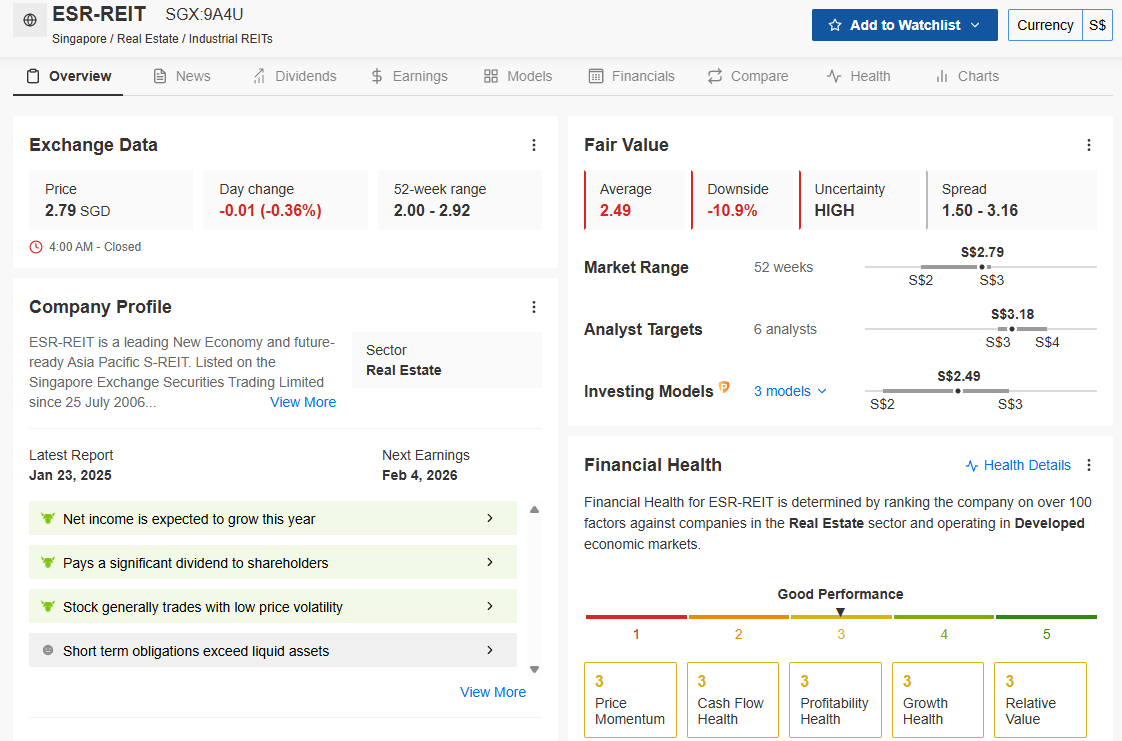
Source: InvestingPro data. Unlock these institutional tools for yourself: Use code INVESTINGIGUANA for an exclusive 55% discount to kickstart 2026.
What the Data Actually Says:
We ran the numbers through the InvestingPro Fair Value model to see if the current price is justified by the fundamentals.
Price vs. Fair Value: The stock is trading at S$2.78, but the Fair Value model pegs it lower at S$2.49. That’s a potential downside of -10.6%.
Uncertainty Level: Note the “HIGH” uncertainty tag. This confirms that the market is struggling to price in their future growth versus their debt load.
The Red Flag: The platform flags that “Short term obligations exceed liquid assets.”. This is the critical risk for dividend investors—if they need cash for obligations, they might conserve it by capping the dividend.
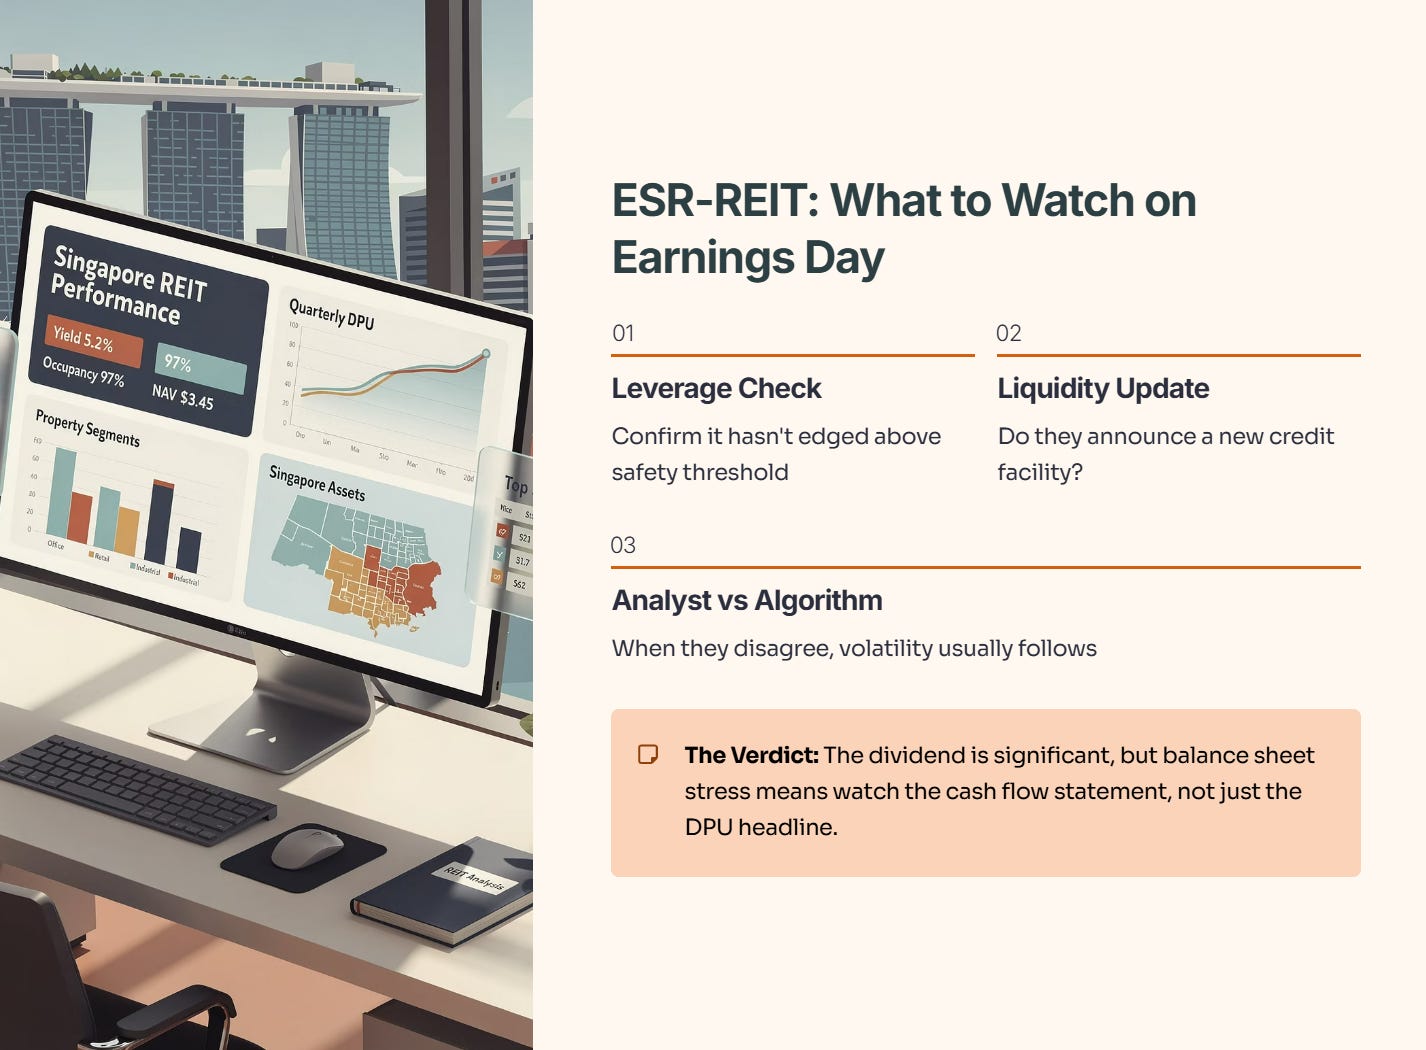
What to watch on Earnings Day:
Leverage: Confirm it hasn’t edged above the safety threshold.
Liquidity: With short-term obligations high, do they announce a new credit facility?
Analyst Disconnect: Analysts are bullish (Target: S$3.18) while the math is bearish (Fair Value: S$2.49). When analysts and algos disagree, volatility usually follows.
The Verdict: The dividend is significant, but the balance sheet stress (”obligations > liquid assets”) means you need to watch the cash flow statement, not just the DPU headline.
Analysis: Sasseur REIT (CRPU)
The Outlier Play (Cash Flow Strength)
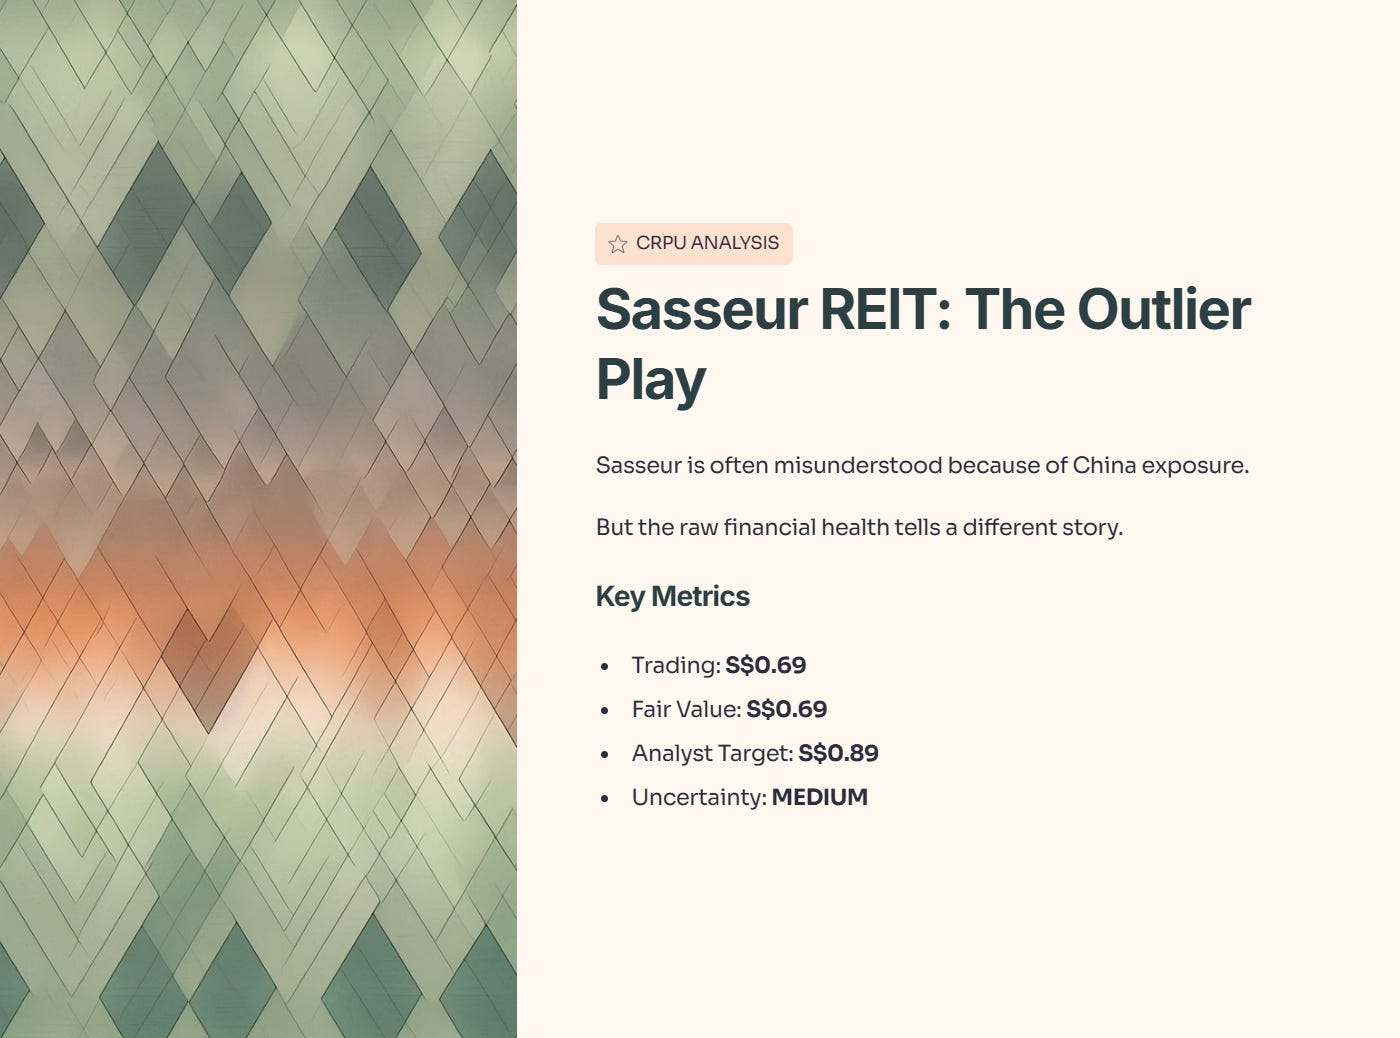
Sasseur is often misunderstood because of its China exposure. But when we strip away the sentiment and look at the raw financial health, a different picture emerges.
Source: InvestingPro data. Unlock these institutional tools for yourself: Use code INVESTINGIGUANA for an exclusive 55% discount to kickstart 2026.
What the Data Actually Says:
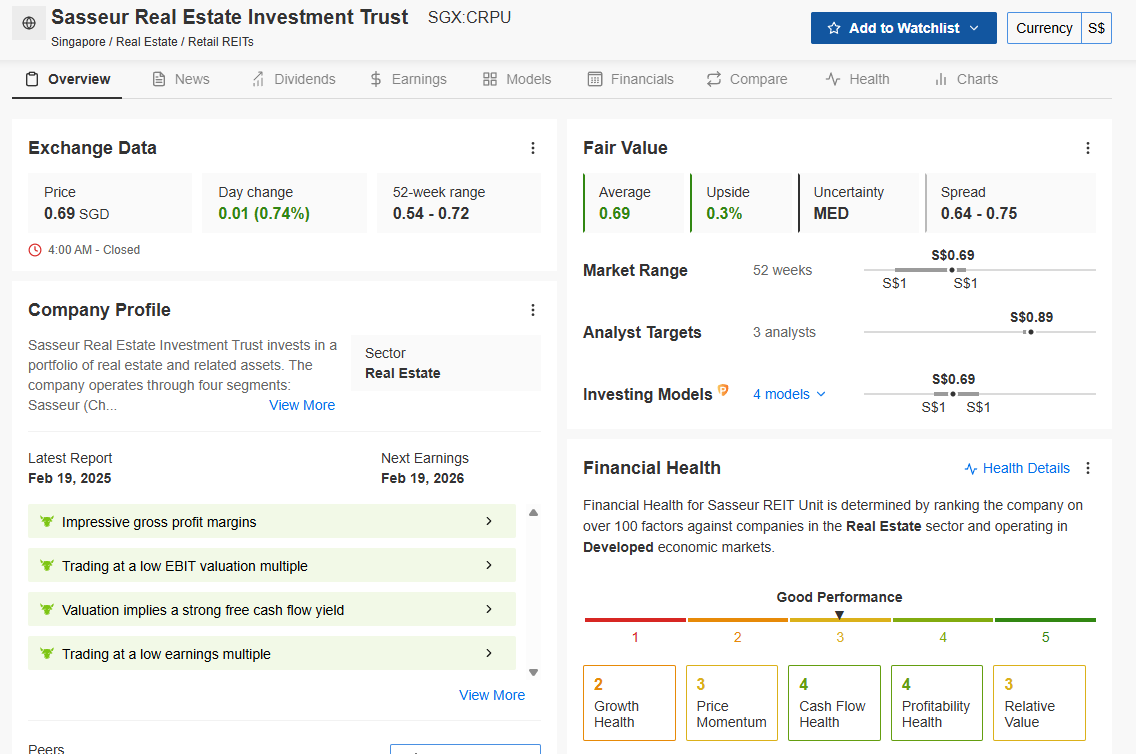
While the market is hesitant, the financial health scores are incredibly robust compared to peers.
Valuation: It’s trading exactly at Fair Value (S$0.69), meaning you aren’t overpaying.
The “Bull” Case: Look at the Analyst Targets. They see it going to S$0.89, which is a massive gap from the current price.
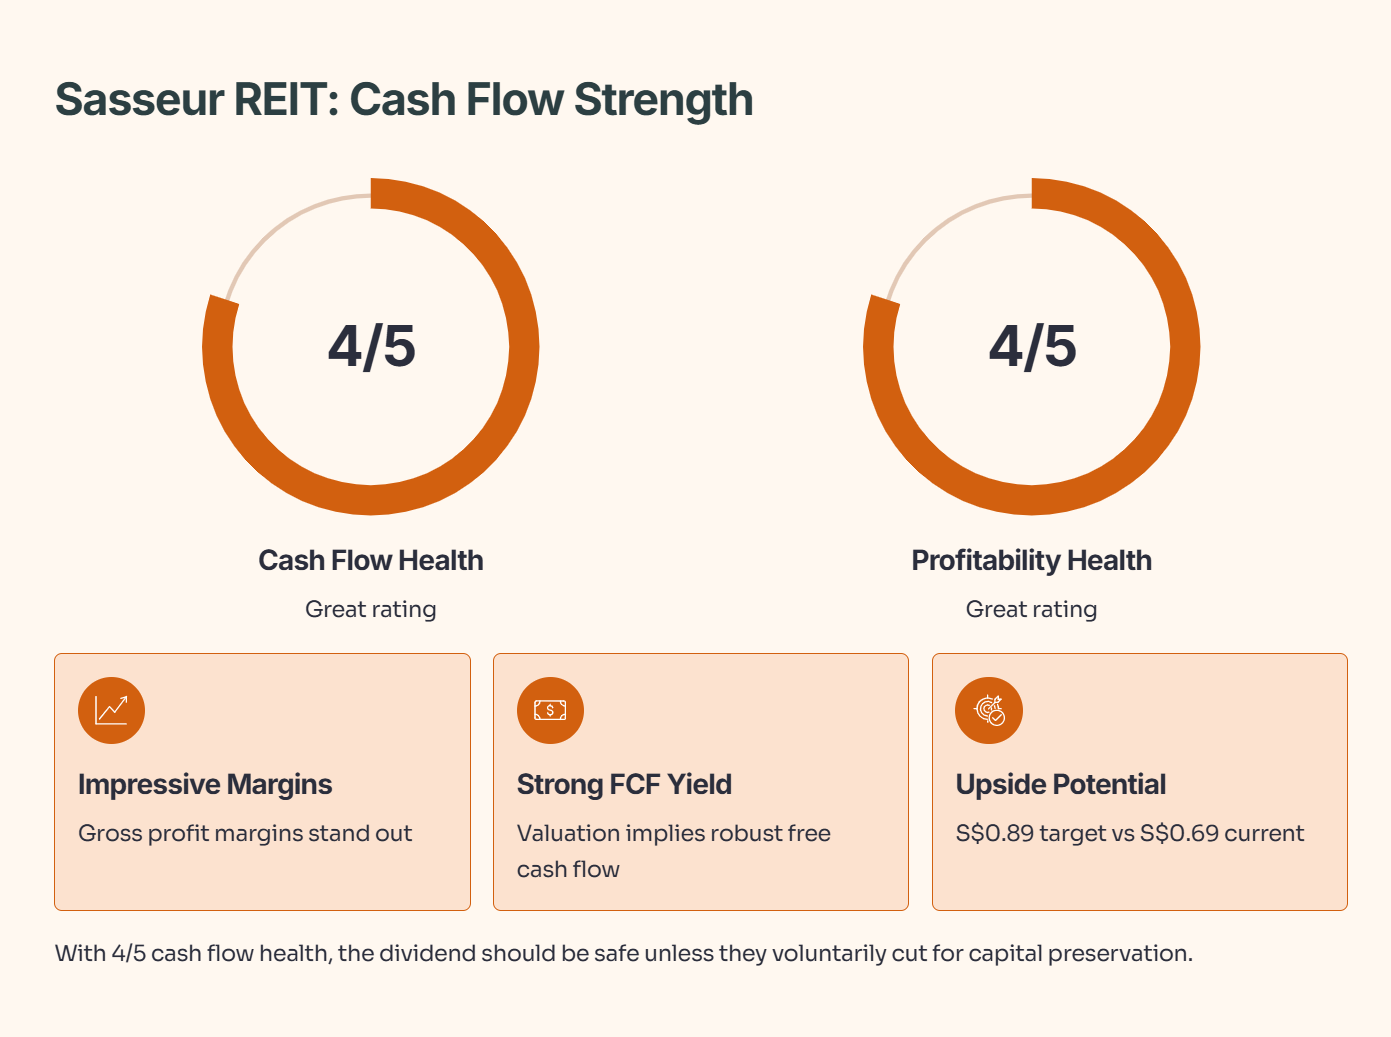
Health Check: This is what I like to see.
Cash Flow Health: 4/5 (Great).
Profitability Health: 4/5 (Great).
Key Strength: The model highlights “Impressive gross profit margins” and a valuation that “implies a strong free cash flow yield.”.
What to watch on Feb 19:
Dividend Floor: With such strong cash flow health (4/5), the dividend should be safe unless they voluntarily cut for capital preservation.
The Catalyst: If they report decent numbers, the price could snap back toward that S$0.89 analyst target quickly, as the “uncertainty” metric here is only “MED” (Medium), unlike ESR’s “HIGH”.
