

Singapore Exchange | RHB Research Neutral S$20.90 | A Monopoly With a 2.06% Yield Is Not an Income Stock
RHB says Neutral. Iggy's forensic screen says something sharper. The balance sheet is clean. The entry price is the problem.

EP1617 — Singapore Exchange Ltd | RHB Research Neutral S$20.90
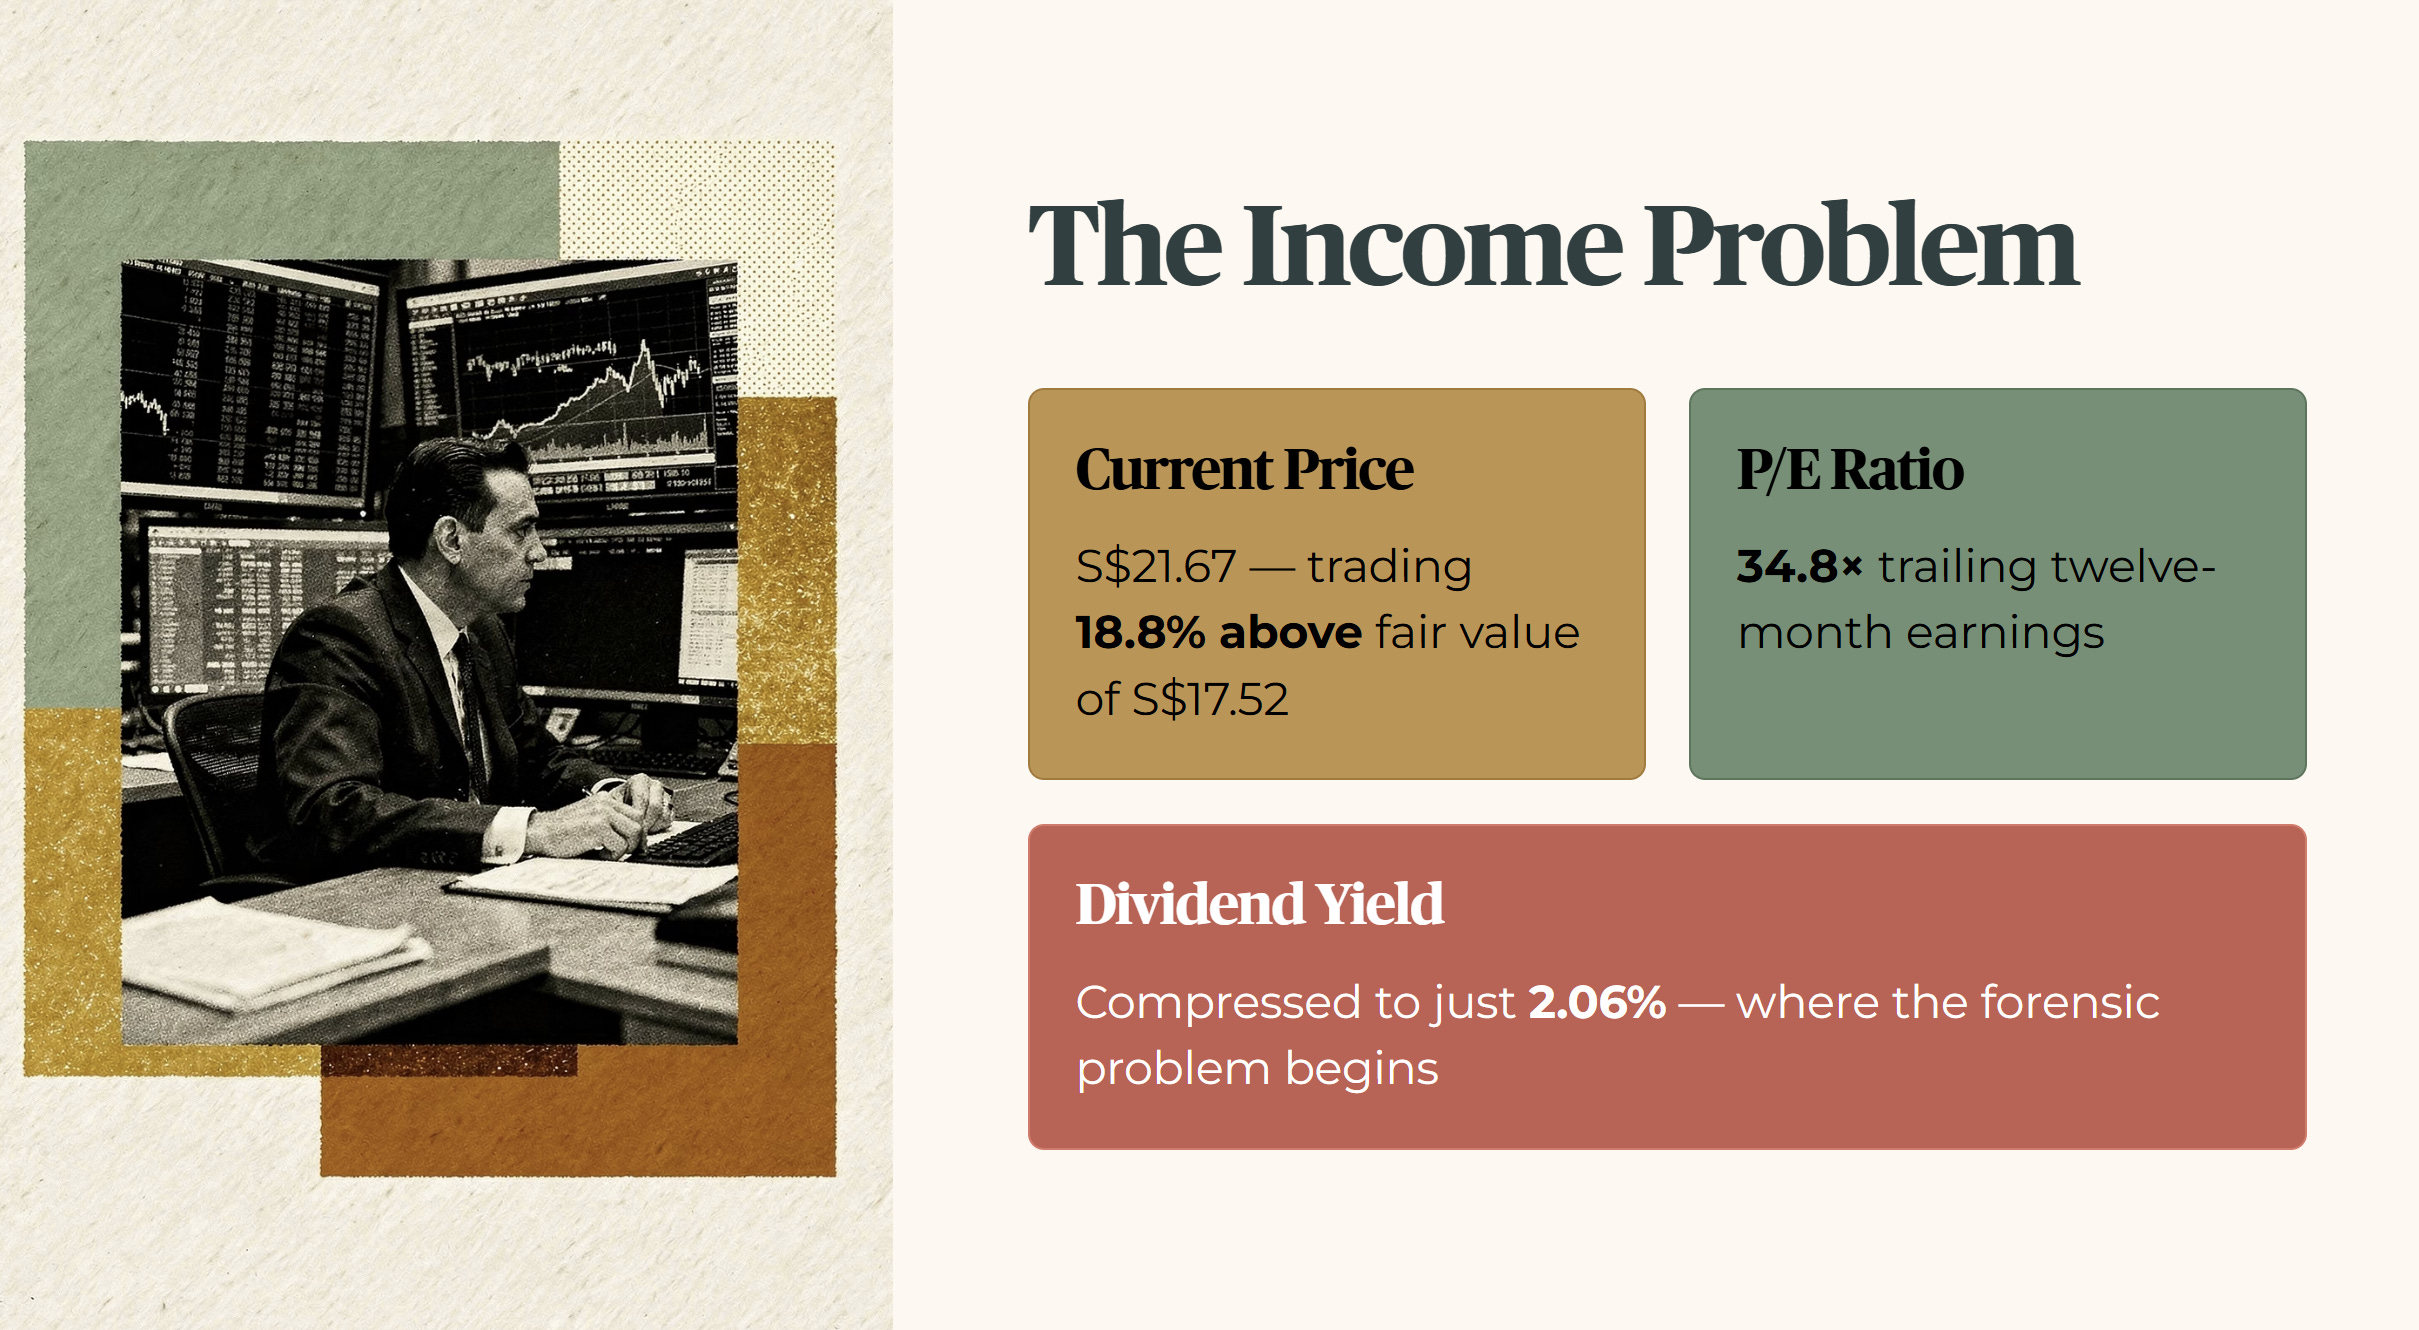
Singapore Exchange Ltd is now trading at a price-to-earnings ratio of 34.8 times its trailing twelve-month earnings. That is 18.8% above its verified fair value of S$17.52, based on InvestingPro. For a retiree drawing income from their portfolio, the result is a dividend yield compressed to just 2.06% — and that is where the forensic problem begins.
Stock prices move fast. Cash generation moves slow.
My job is simple, even if the balance sheet is not. I read the numbers that the headline skips — the interest coverage, the gearing, the free cash flow sustainability — so that the Singaporean building or living off a dividend portfolio gets the same forensic clarity that institutional money takes for granted.

In This Article:
Section 1 — The Analyst’s Case
Section 2 — Iggy’s Forensic Screen
Metric 1: Trailing Dividend Yield
Metric 2: Corporate Gearing and Debt Obligations
Metric 3: Interest Coverage Ratio
Metric 4: Net Debt to EBITDA
Metric 5: Valuation Disconnect
Forensic Compliance Gate
Forensic Zone Assignment: ZONE 5 — RED ZONE
Section 3 — The Dividend Trajectory
Section 4 — The Forensic Gap
Iggy’s Insight Box 1
Section 5 — What To Watch Next
Iggy’s Insight Box 2
Closing — The Forensic Stance
Iggy’s Forensic Disclaimer
Section 1 — The Analyst’s Case
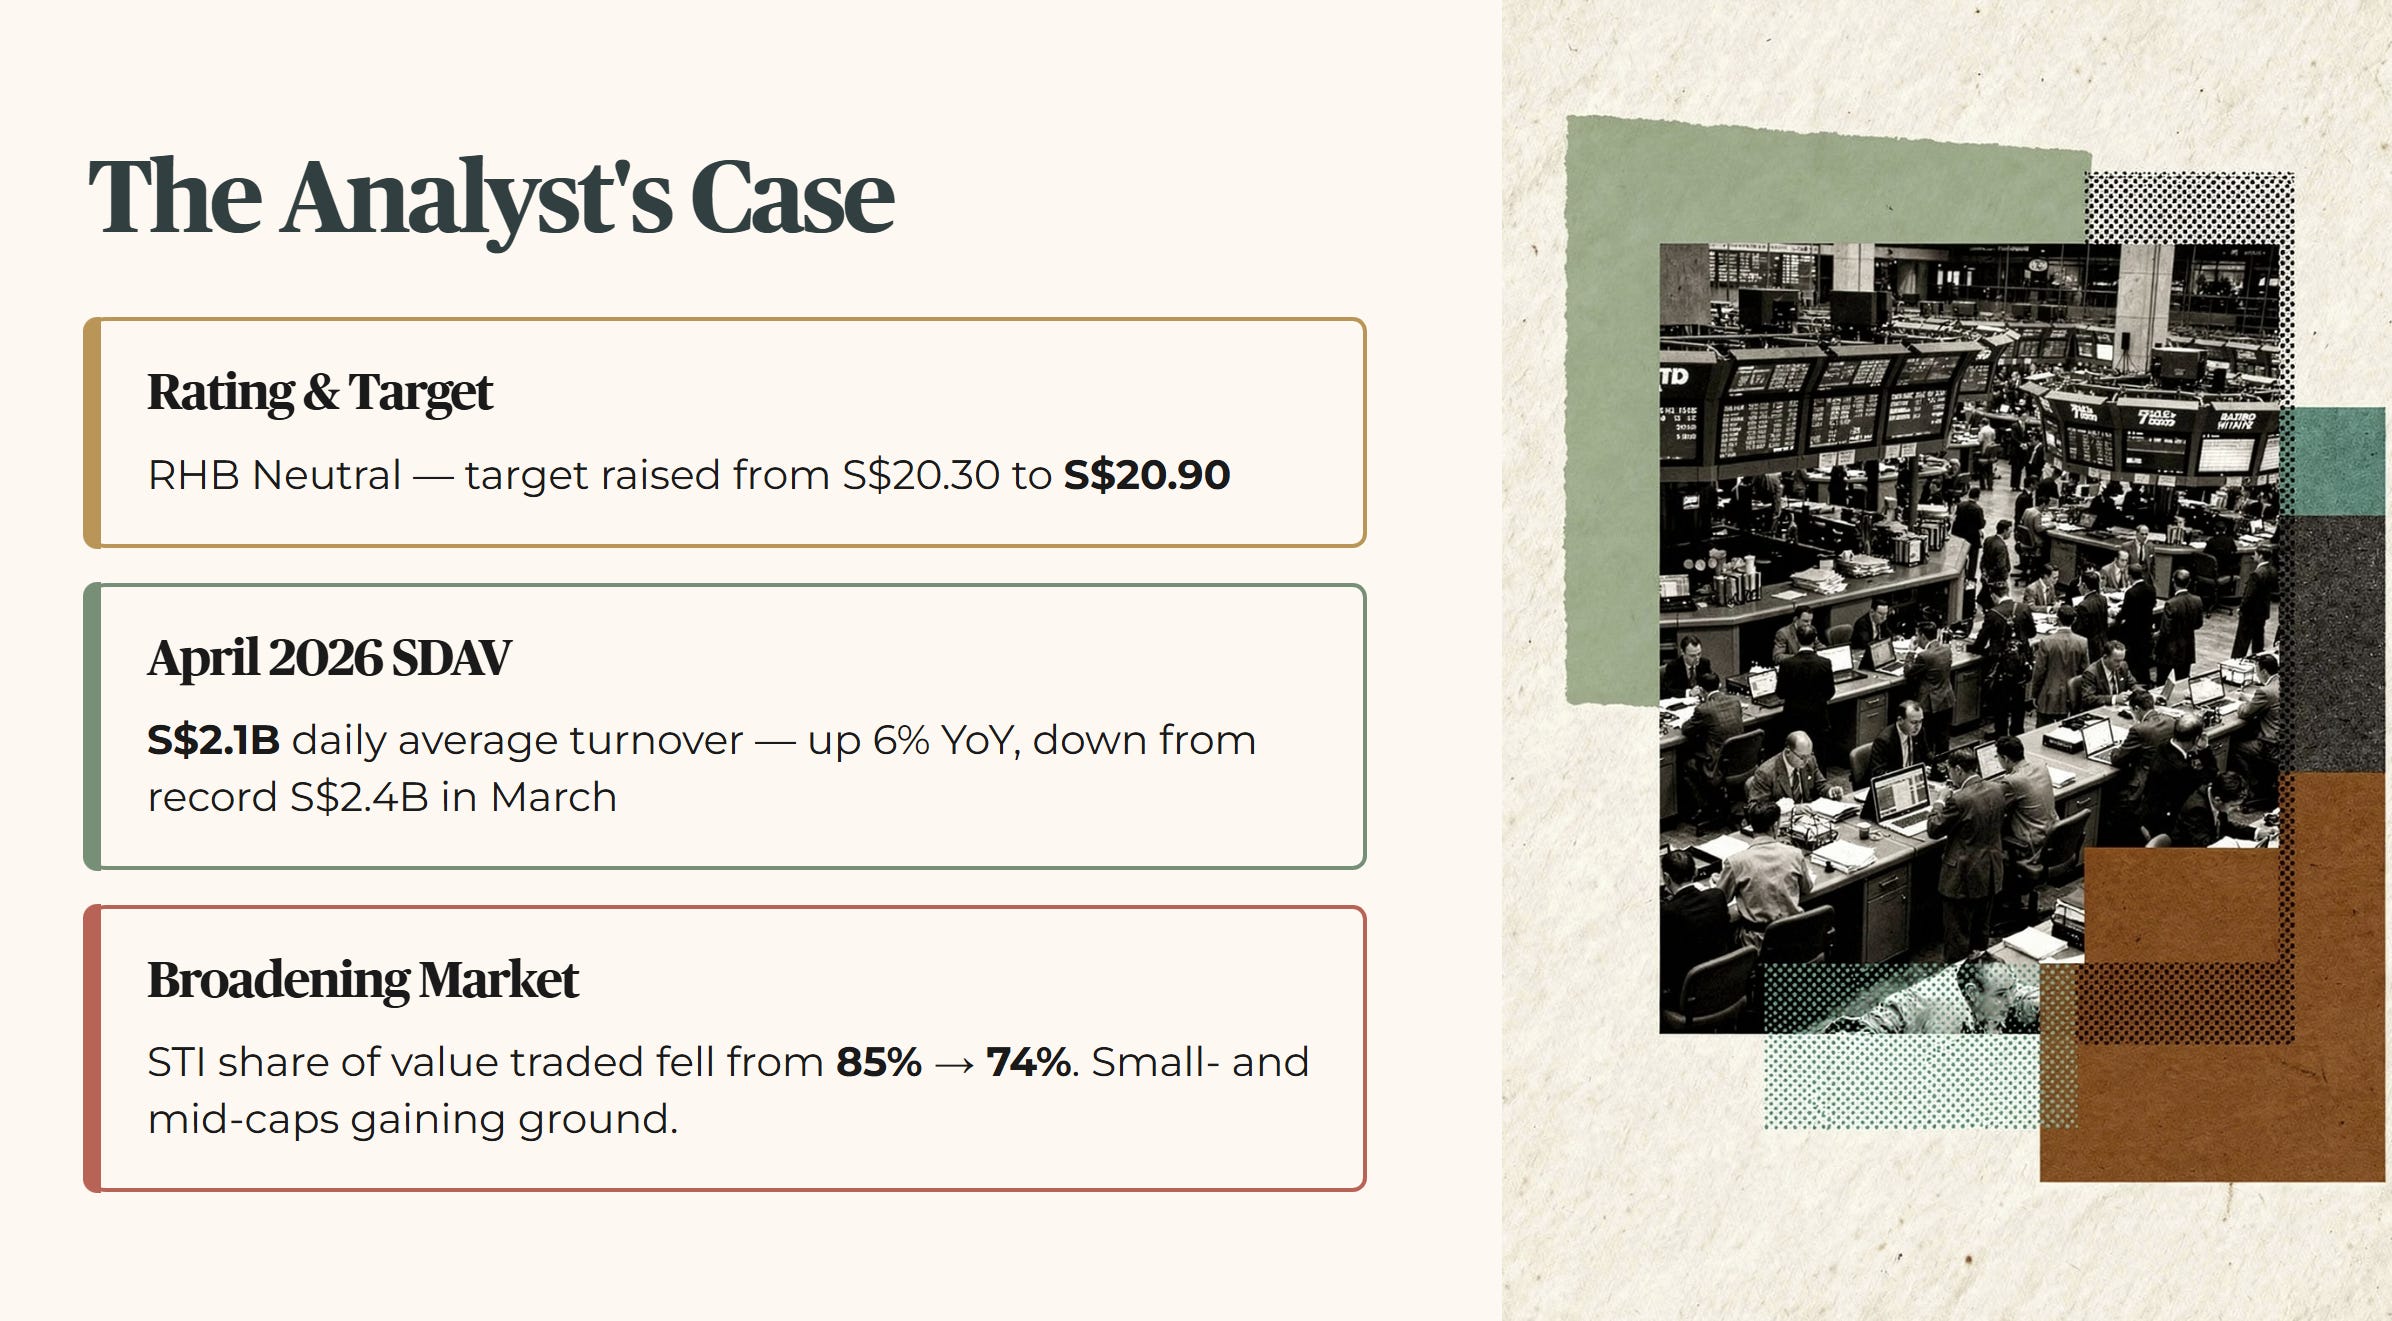
RHB Research has updated its outlook on Singapore Exchange Ltd. The firm gives it a Neutral rating and raised its target price slightly from S$20.30 to S$20.90.
The main argument is that trading momentum is broadening across the local stock market. It is no longer just the big Straits Times Index stocks driving volumes. Small- and mid-cap stocks are showing real activity too. The analyst sees this as a positive structural shift for the exchange.
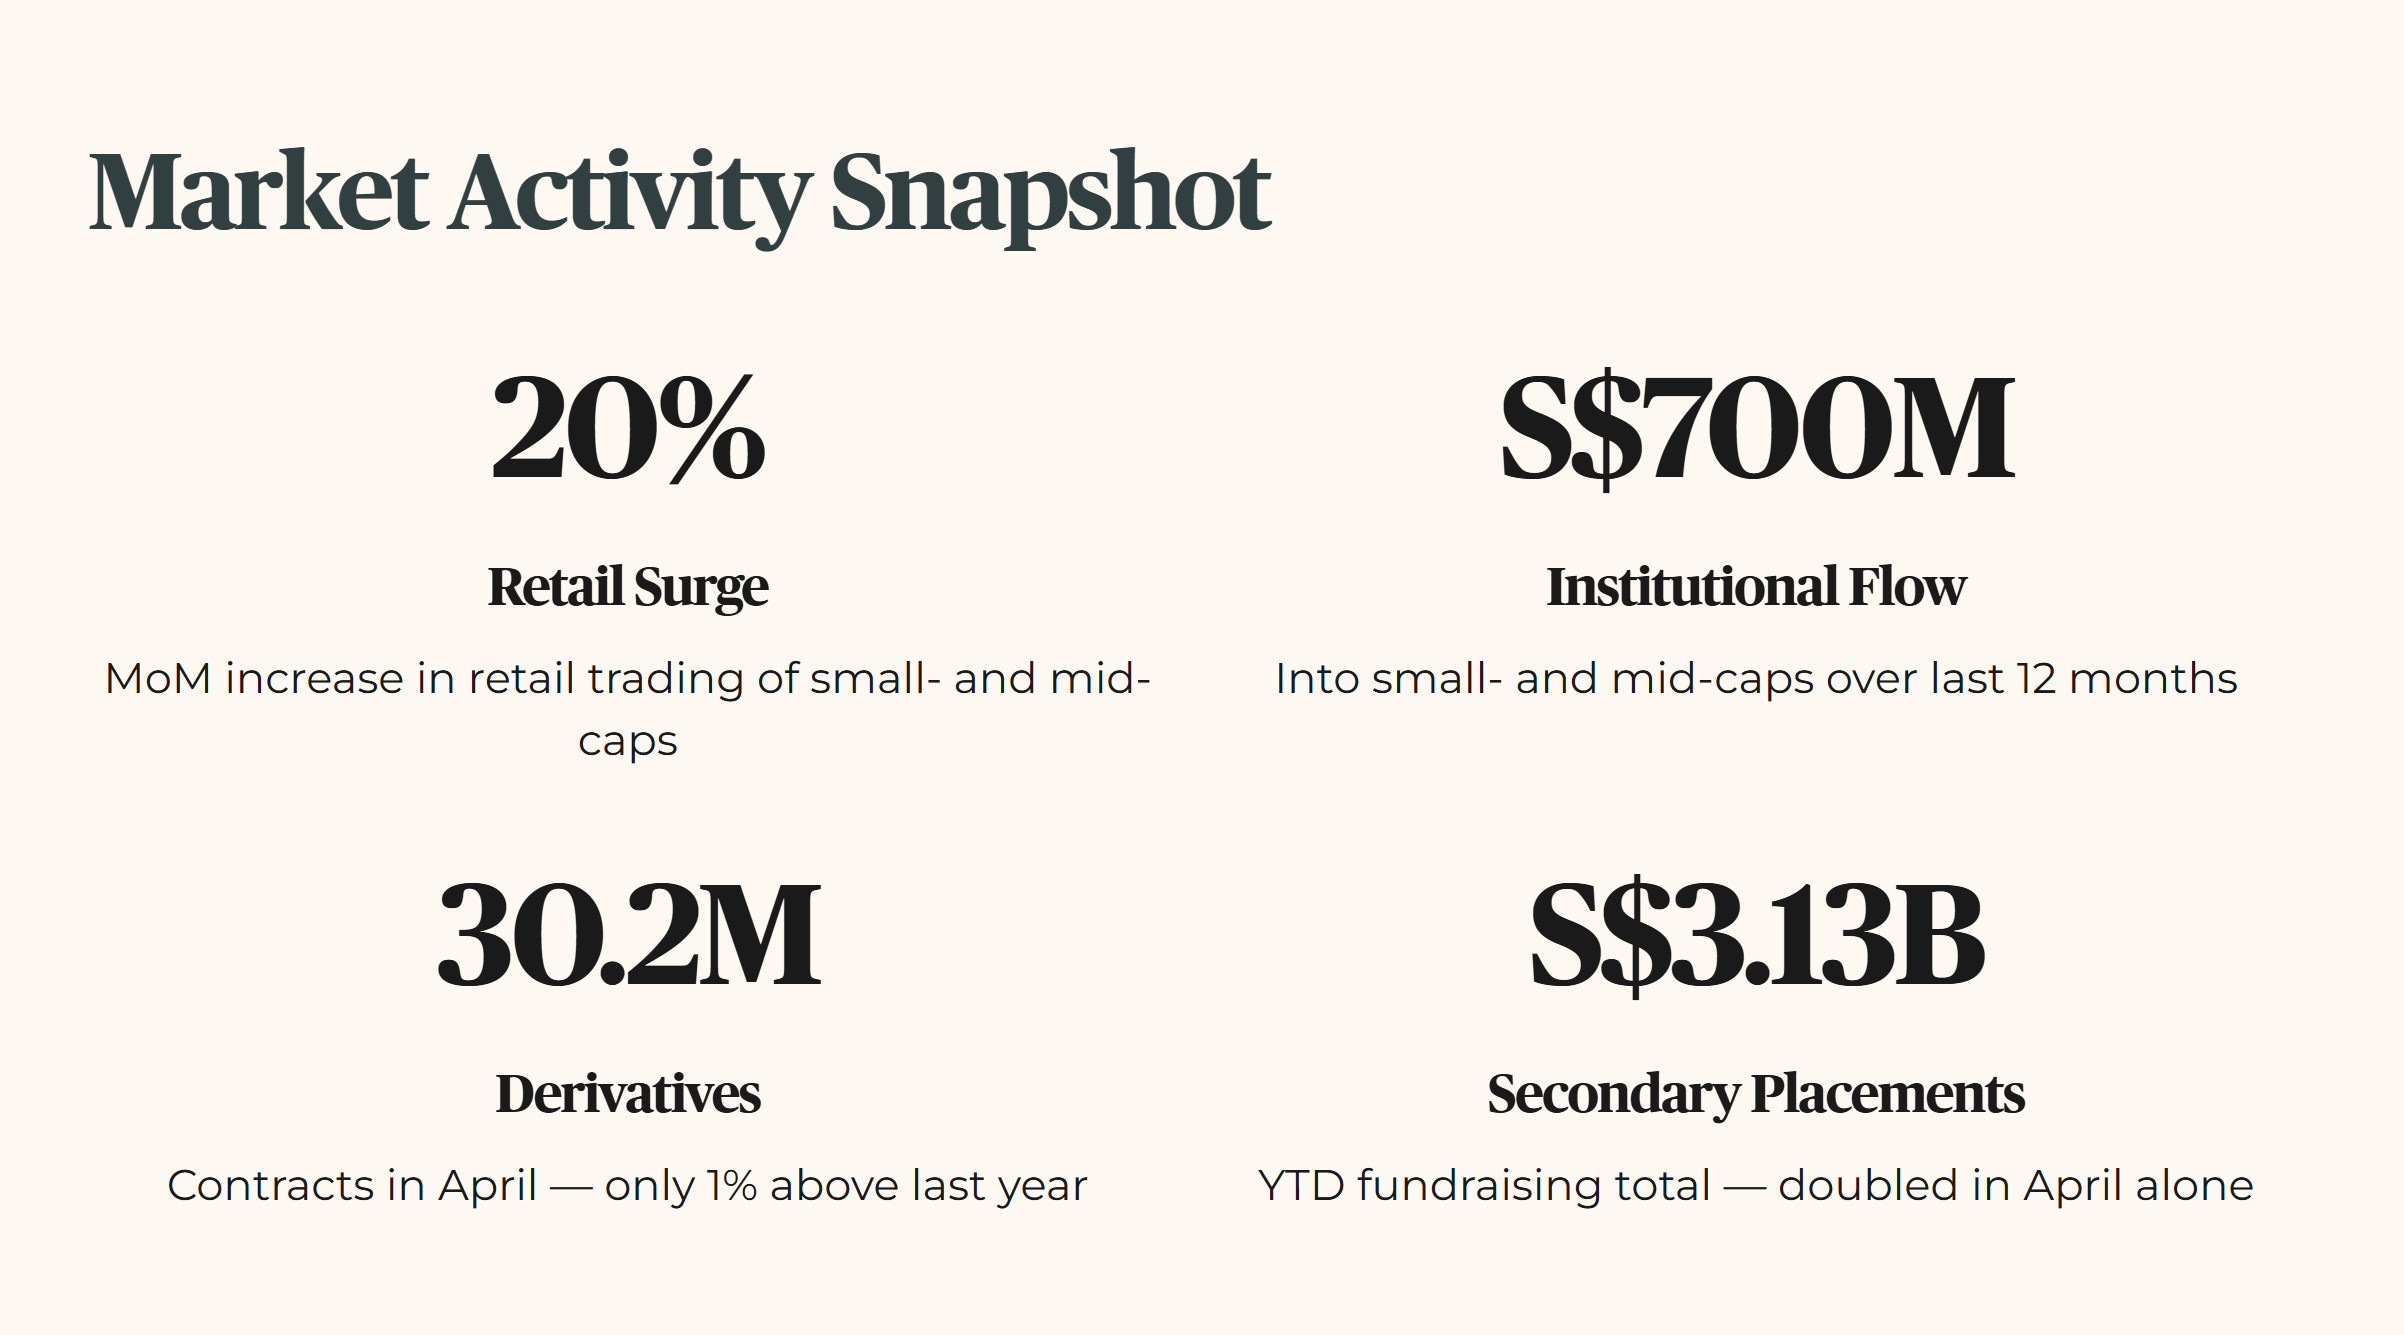
Here are the April 2026 numbers. The Securities Daily Average Turnover — that is the total value of shares traded each day — came in at S$2.1 billion. That is up 6% from a year ago. But it is down from the record S$2.4 billion seen in March 2026.
The small- and mid-cap segment grew 8% month-on-month. Its share of total turnover is now the highest since July 2021. At the same time, the Straits Times Index’s share of total value traded dropped from about 85% last year to 74% now. Money is moving into smaller names.
Retail investors increased their trading in small- and mid-cap stocks by 20% month-on-month. Institutions were net buyers for four months in a row. They added S$158 million to that segment in April alone. Over the last twelve months, institutional money flowing into small- and mid-caps totalled S$700 million.
On the derivatives side, April volume hit 30.2 million contracts. That is only 1% higher than last year. The real action is in cash equities, not derivatives.
For new listings, the exchange saw one Catalist IPO — Kin Global. Three companies moved from Catalist to the Mainboard in May 2026: Aspial Lifestyle, Choo Chiang, and MoneyMax. Secondary placements brought in S$1.75 billion in April, doubling the year-to-date secondary fundraising total to S$3.13 billion.
Despite all this activity, the analyst is cautious about new IPOs. The forecast assumes only five new listings in the second half of fiscal year 2026. That is a real constraint on long-term trading growth.
Because trading volumes have been higher in recent months, RHB raised its profit estimates slightly. Net profit forecasts for fiscal years 2026, 2027, and 2028 went up by 1.4%, 3.2%, and 3.1% respectively. The key assumption for fiscal year 2027 is that daily average turnover will hit S$2.022 billion, up from the previous estimate of S$1.889 billion.
The analyst values the stock at 26 times estimated fiscal year 2027 earnings, plus a 4% premium for environmental, social, and governance factors. That target multiple is about two standard deviations above the exchange’s own 12-year average.
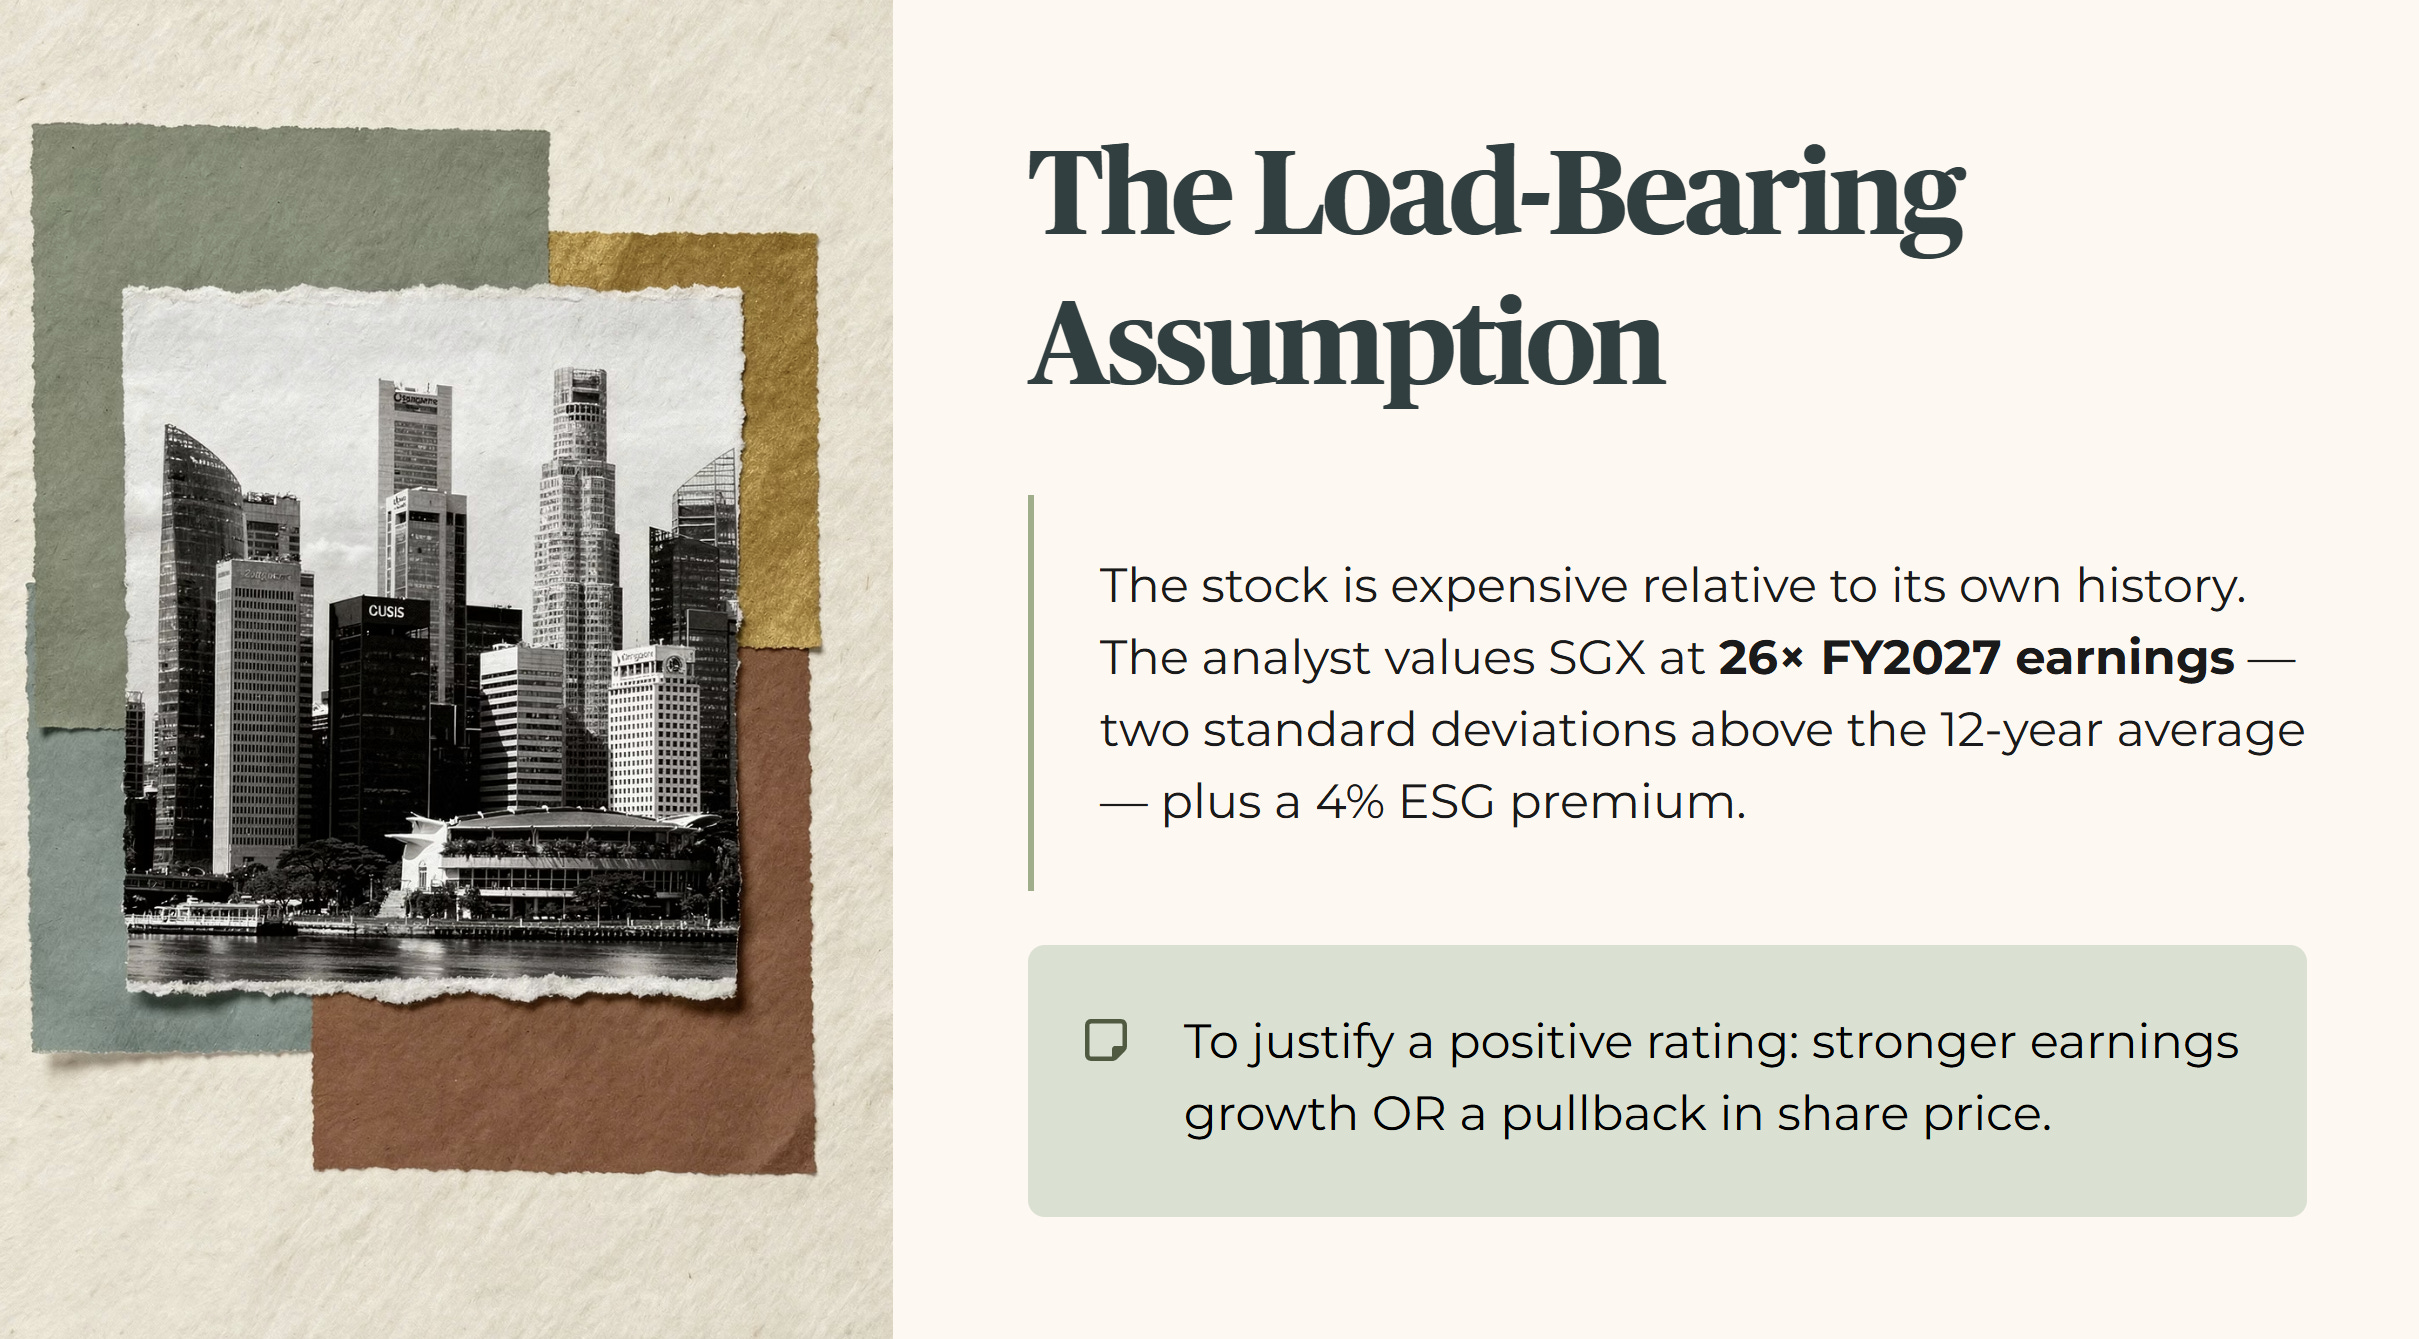
The conclusion from the institutional seat: the stock is expensive relative to its own history. To justify a more positive rating, the analyst would need either stronger earnings growth or a pullback in the share price.
THE LOAD-BEARING ASSUMPTION: The institutional thesis assumes that a high valuation — 26 to 34.8 times earnings — makes sense if trading activity keeps shifting from large caps to small- and mid-cap stocks.
Section 2 — Iggy’s Forensic Screen
To decide whether this stock belongs in a retirement portfolio, we run it through five layers of scrutiny. We look at the raw numbers. We compare them to history and peers. We stress-test them for bad scenarios. And we ask one question at the end: what does this mean for your actual cash flow?
Metric 1: Trailing Dividend Yield
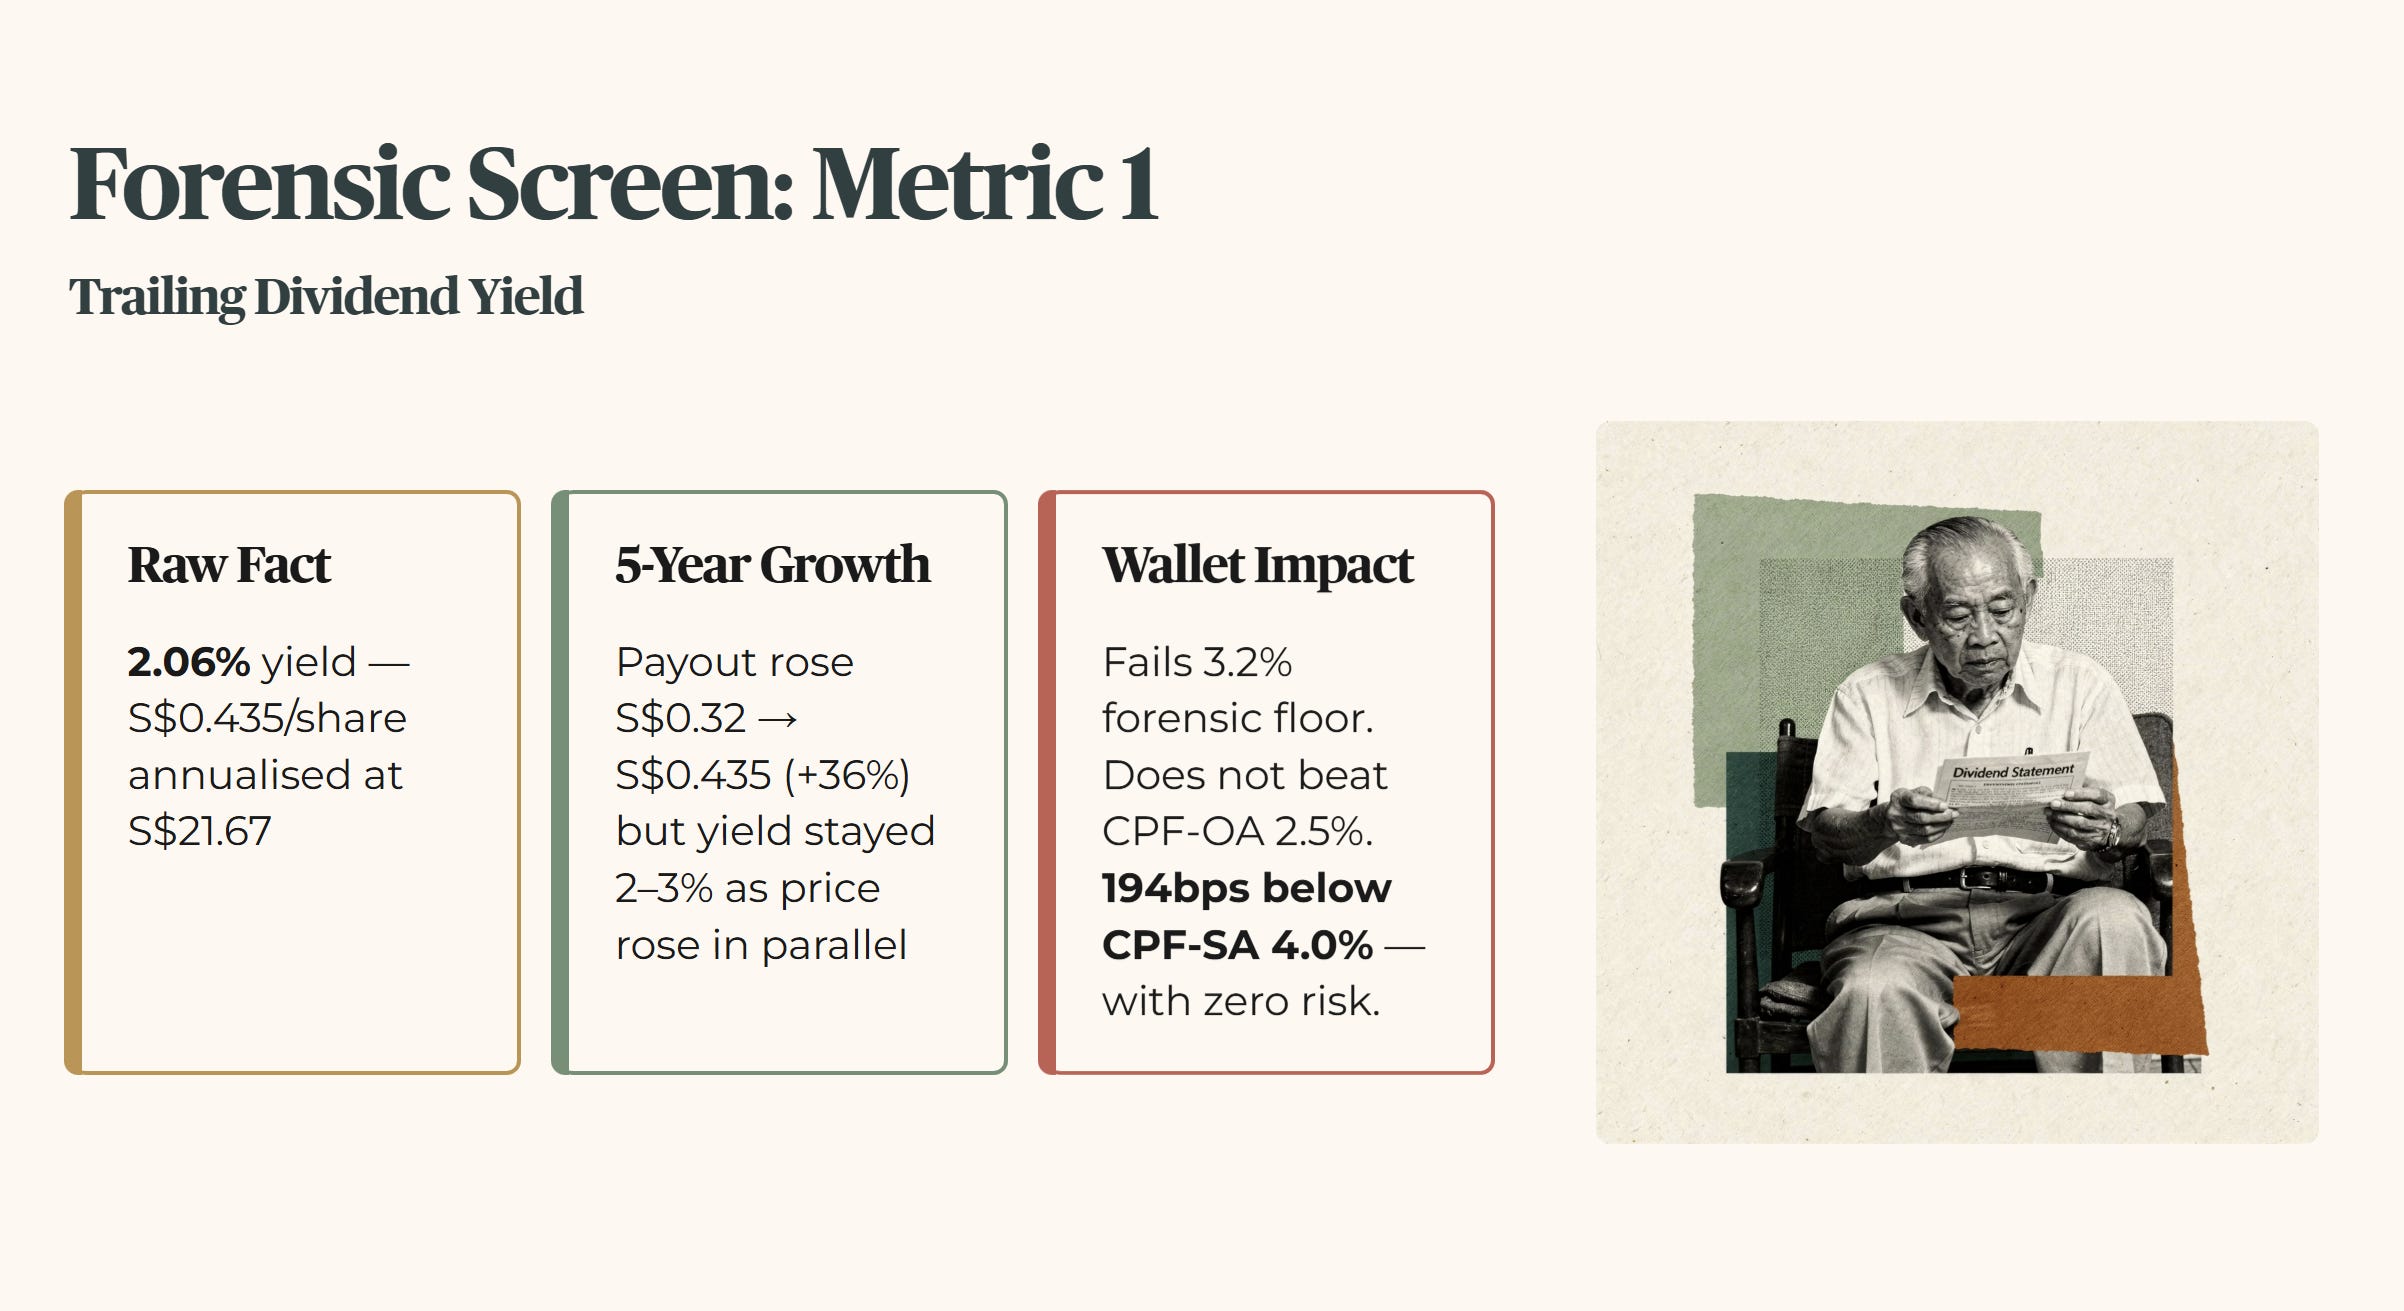
Layer 1 — Raw Fact: The verified dividend yield is 2.06%, based on an annualised payout of S$0.435 per share at the current price of S$21.67.
Layer 2 — Historical Benchmark: SGX has paid a consistent and growing dividend since FY2021, with annual payouts rising from S$0.32 per share to S$0.435 annualised today — a 36% increase over five years. But the yield has historically remained in the 2–3% range because the share price has risen in parallel. This is a structurally low-yield stock. That is not new. It is the nature of the business.
Layer 3 — Peer Context: Compared to other Singapore-listed financial sector dividend stocks, 2.06% is well below average income levels.
Layer 4 — Forward Scenario: If the share price falls 10% from S$21.67 to S$19.50, and the dividend payout stays flat, the yield would rise to approximately 2.23%. Still below the forensic floor.
Layer 5 — Wallet Impact: For a 55-year-old investor who needs cash flow for daily expenses, 2.06% fails the minimum 3.2% forensic floor decisively. It does not beat the 2.5% available from a CPF Ordinary Account. It is 194 basis points below the 4.0% CPF Special Account rate — with zero risk.
Metric 2: Corporate Gearing and Debt Obligations
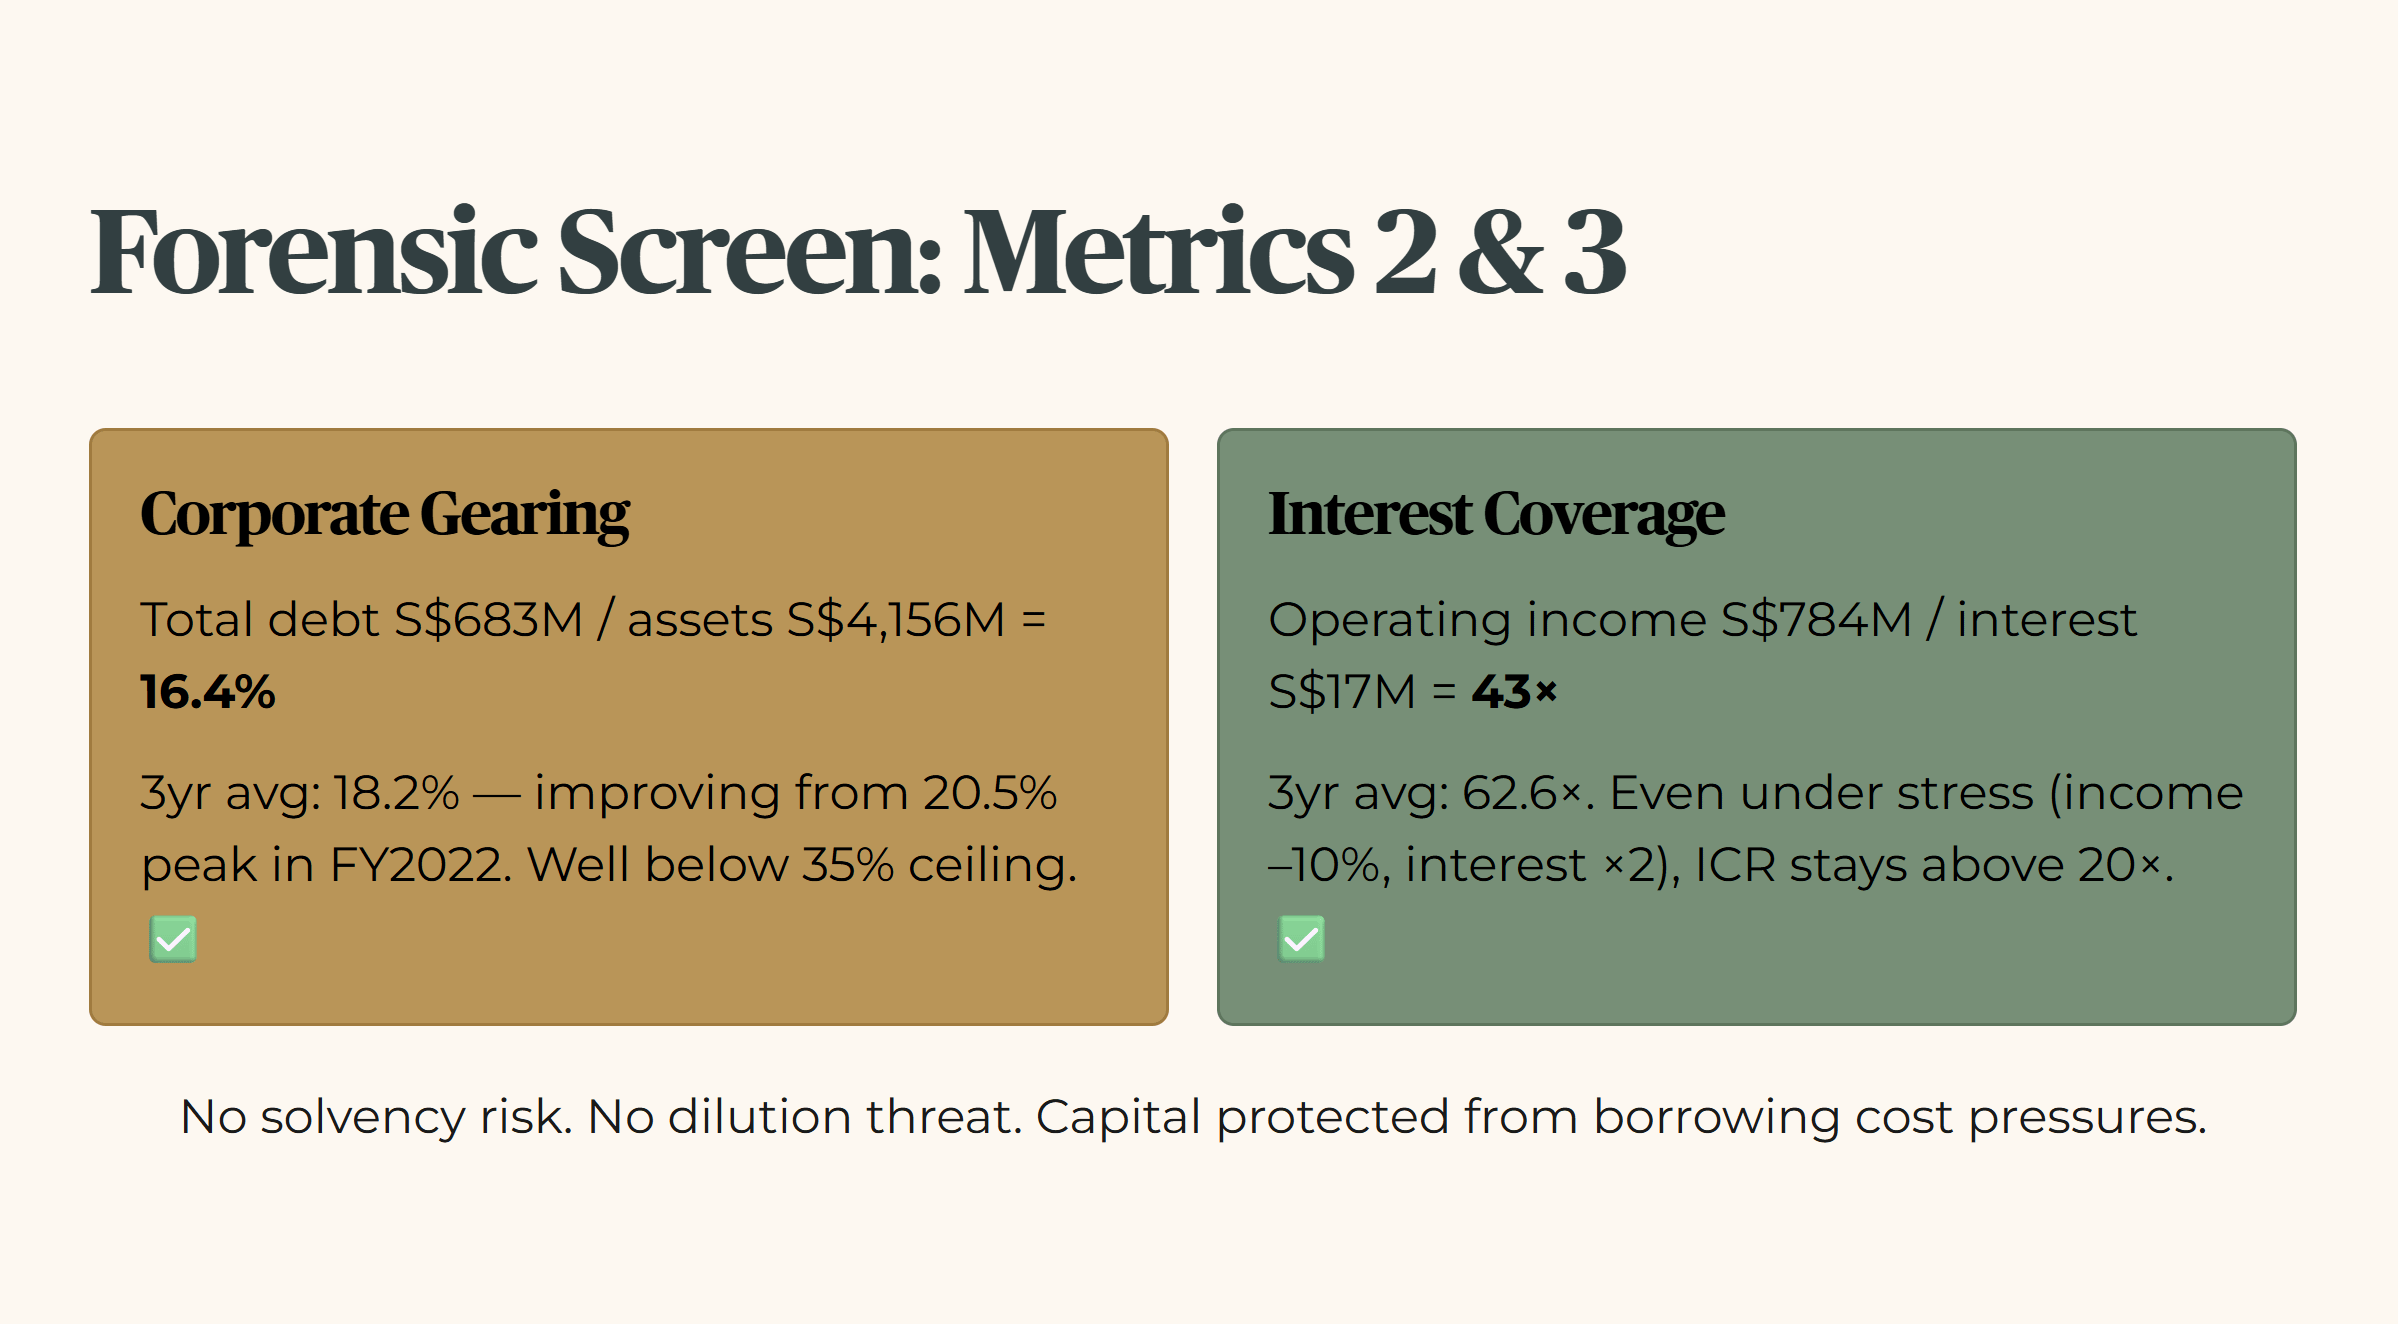
Layer 1 — Raw Fact: Total debt is S$683 million. Total assets are S$4,156 million. That gives a gearing ratio of 16.4%.
Layer 2 — Historical Benchmark: The three-year average gearing from FY2023 to FY2025 is 18.2%. The current 16.4% represents a structurally improving profile. Gearing has declined consistently from a peak of 20.5% in FY2022.
Layer 3 — Peer Context: Below 20% is conservative compared to most listed companies in Singapore.
Layer 4 — Forward Scenario: Even if debt rose 10% to S$751 million, gearing would move to approximately 18.1%. Still well within safe limits.
Layer 5 — Wallet Impact: You do not need to worry about this company diluting your shares, asking for more capital, or facing solvency pressure. The debt position is not just safe — it is improving.
Metric 3: Interest Coverage Ratio
Layer 1 — Raw Fact: Operating income for the trailing twelve months is S$784 million. Interest expense for FY2025 was S$17 million. That gives a current ICR of 43 times — far above the 4.0 times minimum floor.
Layer 2 — Historical Benchmark: The three-year average ICR from FY2023 to FY2025 is 62.6 times. Even as interest expense has risen from S$5 million in FY2021 to S$17 million in FY2025, operating income has grown faster. The coverage ratio remains exceptional.
Layer 4 — Forward Scenario: Even if operating income fell 10% to S$705 million and interest expense doubled to S$34 million, ICR would remain above 20 times. This is not a risk factor.
Layer 5 — Wallet Impact: The cash flow from exchange fees, listing services, and derivatives processing is not threatened by interest rate cycles. Your capital is protected from the borrowing cost pressures that hurt highly leveraged REITs.
Metric 4: Net Debt to EBITDA
Layer 1 — Raw Fact: Cash and short-term investments total S$2,046 million. Total debt is S$683 million. The company holds net cash of S$1,363 million — more cash than debt.
Layer 4 — Forward Scenario: Even if cash balances fell 10% to S$1,841 million, the net cash surplus would remain at S$1,158 million.
Layer 5 — Wallet Impact: This is a fortress balance sheet by any operational measure. Interest rate fluctuations do not threaten solvency.
Metric 5: Valuation Disconnect
Layer 1 — Raw Fact: The stock trades at S$21.67. That is 18.8% above the verified InvestingPro fair value of S$17.52.
Layer 2 — Historical Benchmark: The trailing price-to-earnings ratio of 34.8 times is elevated. The analyst’s own forward target multiple of 26 times sits two standard deviations above the 12-year average — confirming this is not normal pricing.
Layer 4 — Forward Scenario: A 10% correction would bring the share price to S$19.50. Late buyers would absorb that capital loss while still earning below-floor income.
Layer 5 — Wallet Impact: Buying at an 18.8% premium to fair value introduces capital risk that the underlying business does not. When price is detached from fundamentals, your entry point becomes the problem — not the company.
Forensic Compliance Gate
Total Soft Flag Count: 1 (Trading above InvestingPro Fair Value)
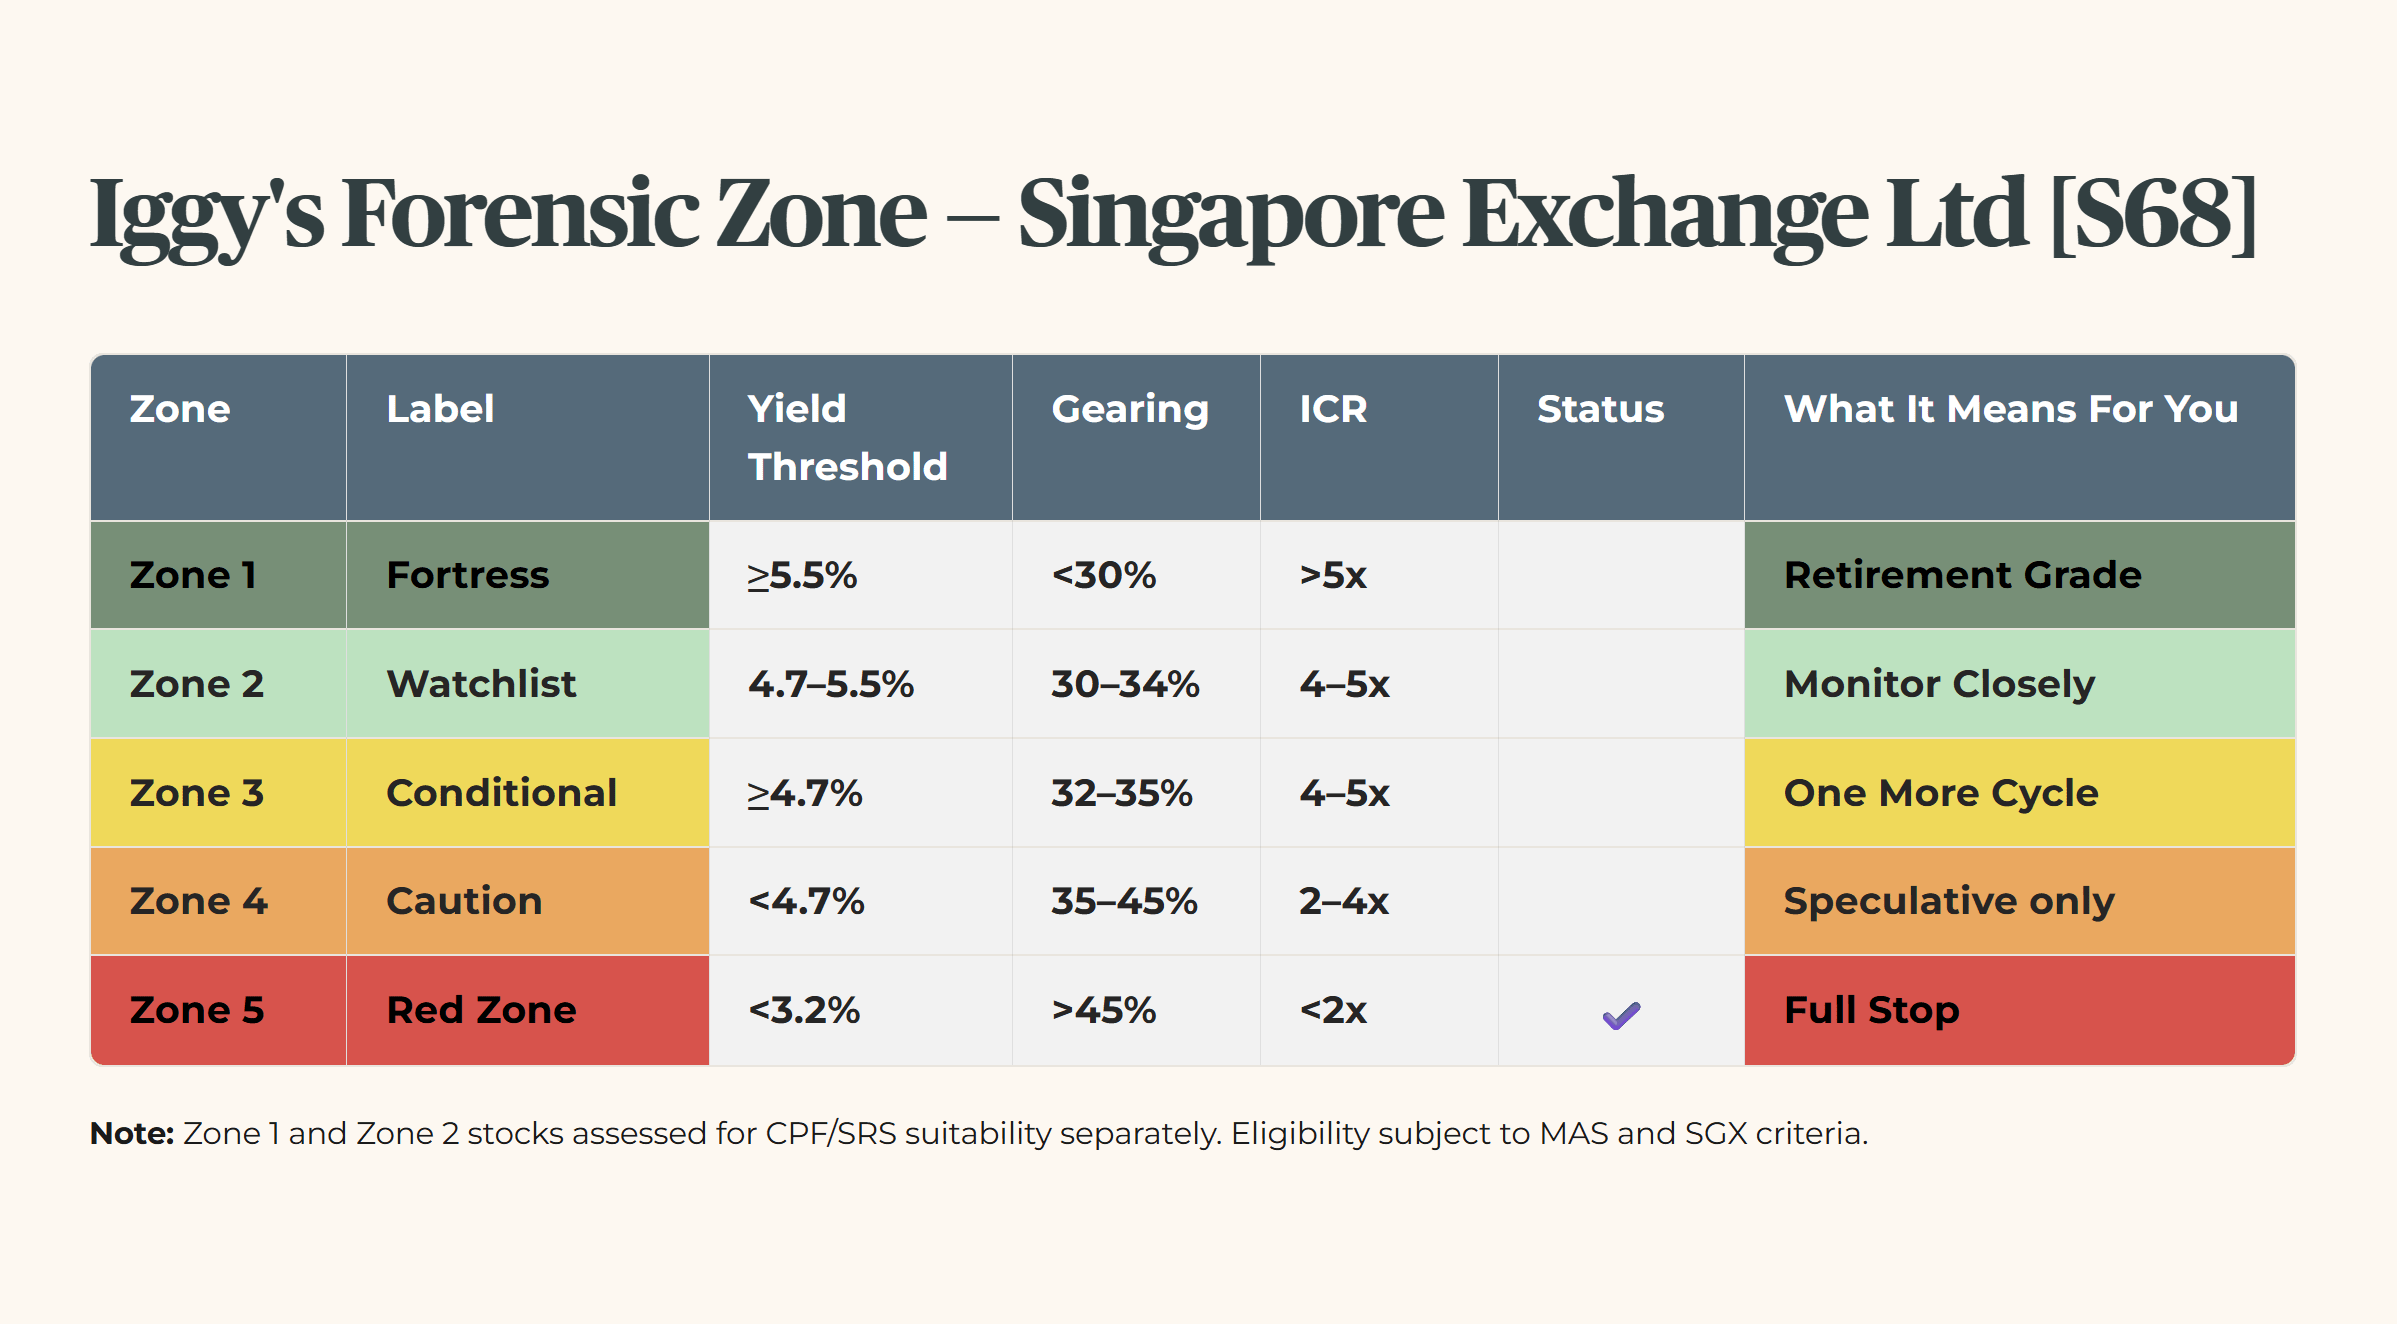
Forensic Zone Assignment: ZONE 5 — RED ZONE
The yield hard gate failure is the single determinative trigger. At 2.06%, the dividend yield falls 114 basis points below the 3.2% forensic floor — a structural failure for income generation, not a borderline reading.
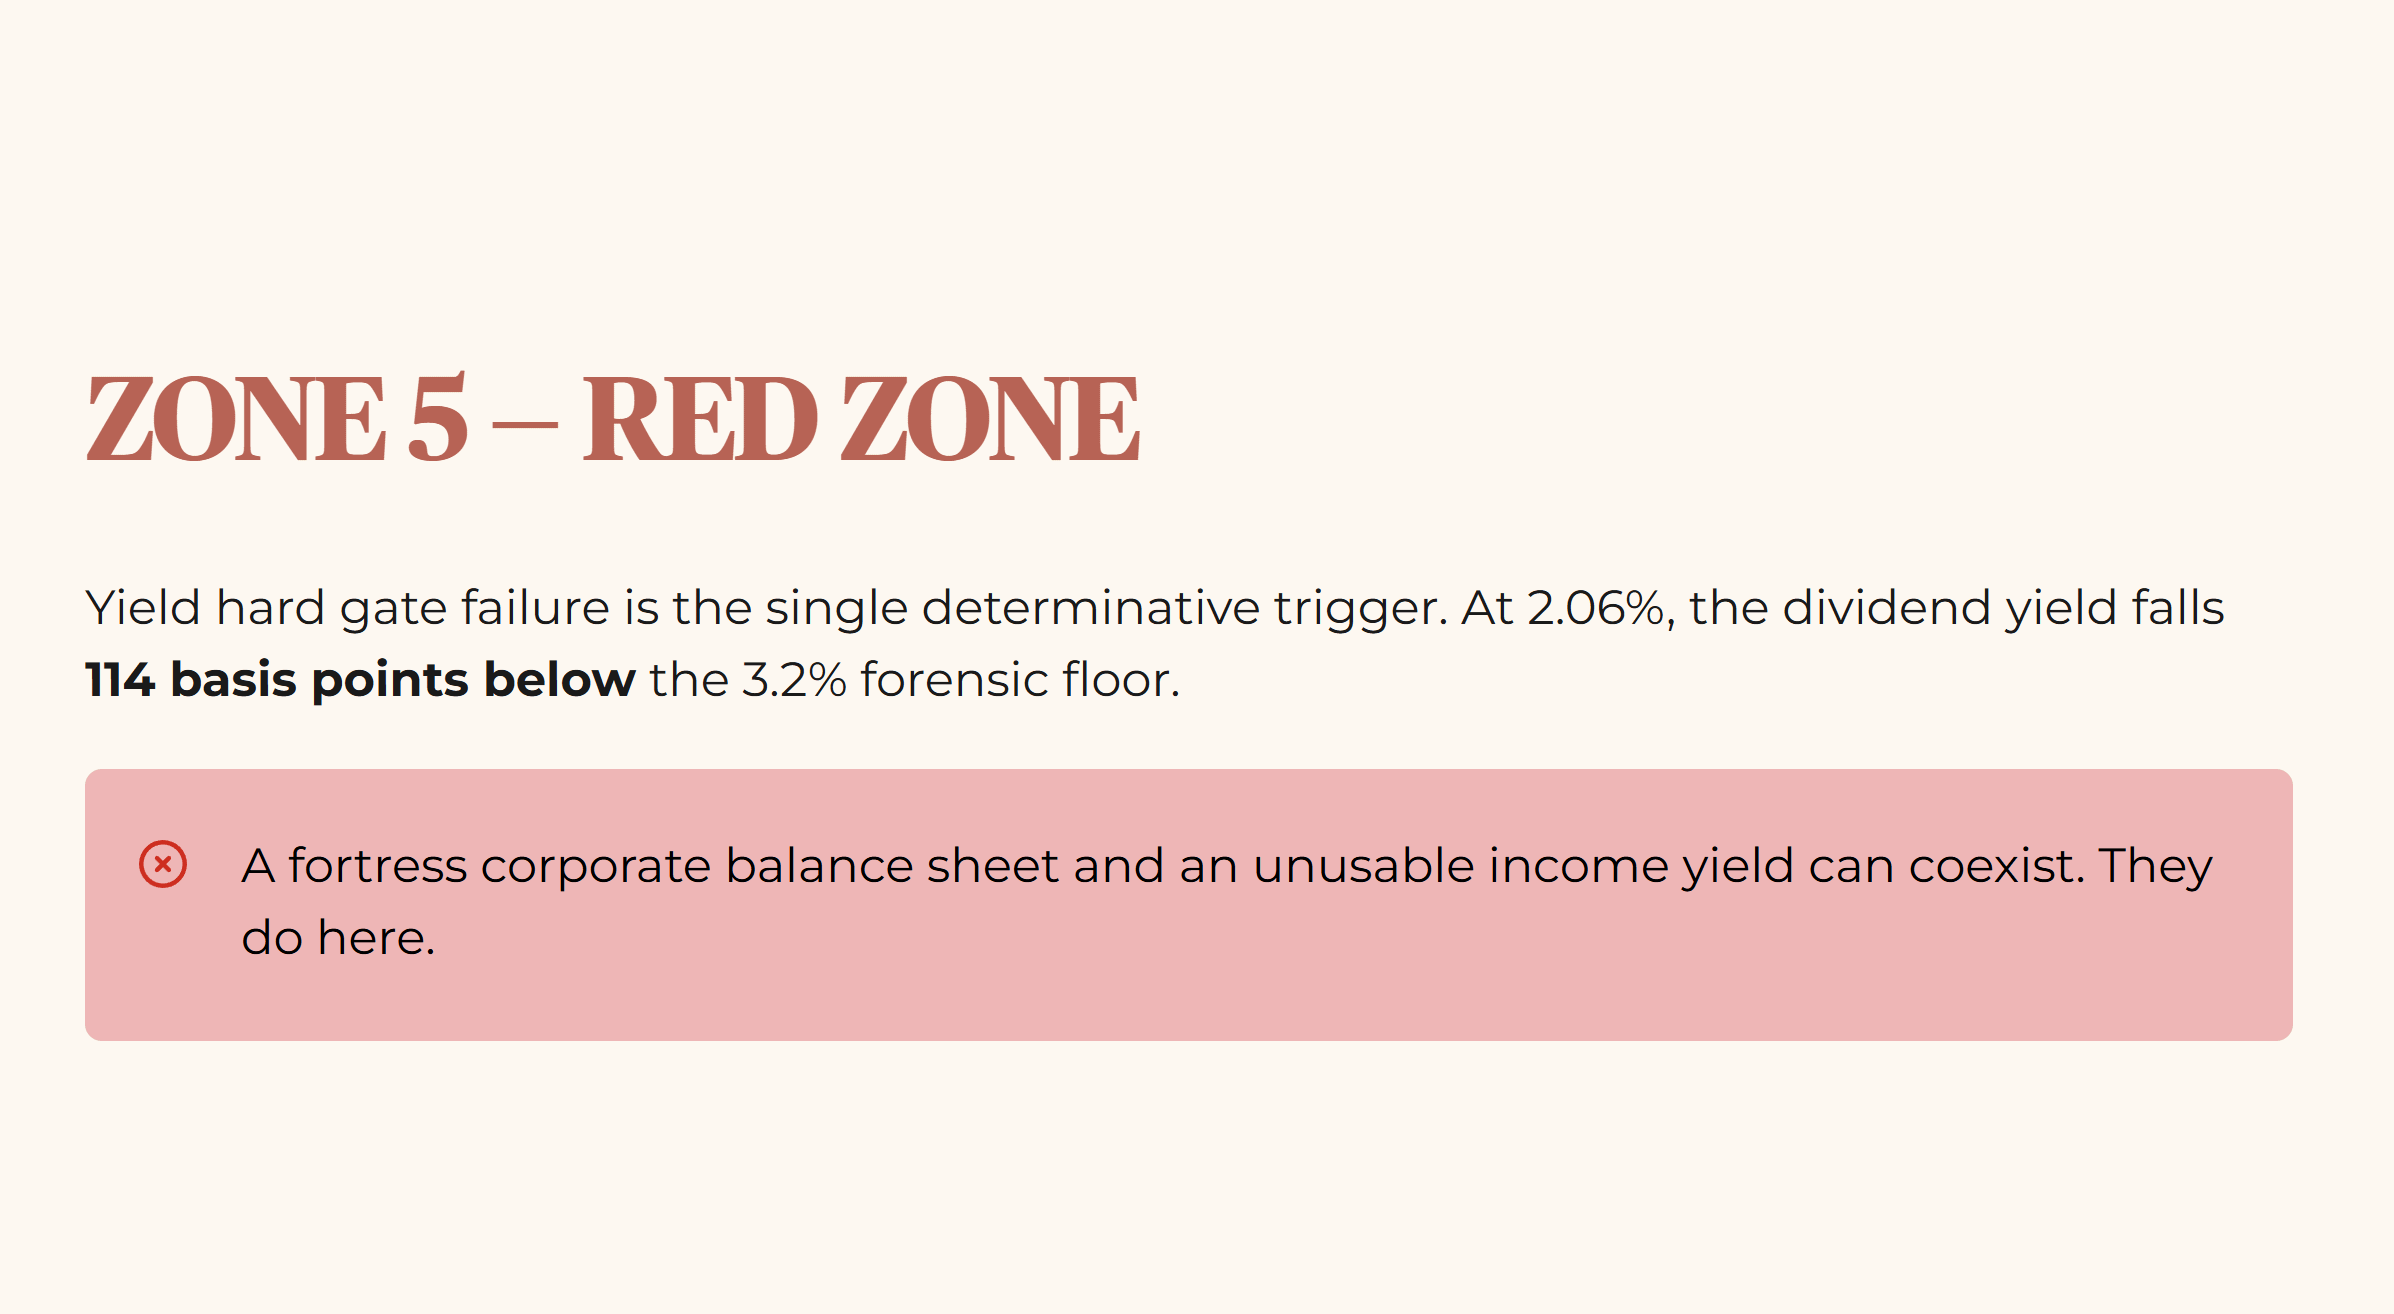
The balance sheet is clean. Net cash is substantial. ICR at 43 times is exceptional. But none of that changes the arithmetic for a retirement investor entering today. The market price has pushed the valuation to 34.8 times earnings. That premium compresses income to a level that cannot serve a drawdown portfolio. A fortress corporate balance sheet and an unusable income yield can coexist. They do here.
Section 3 — The Dividend Trajectory
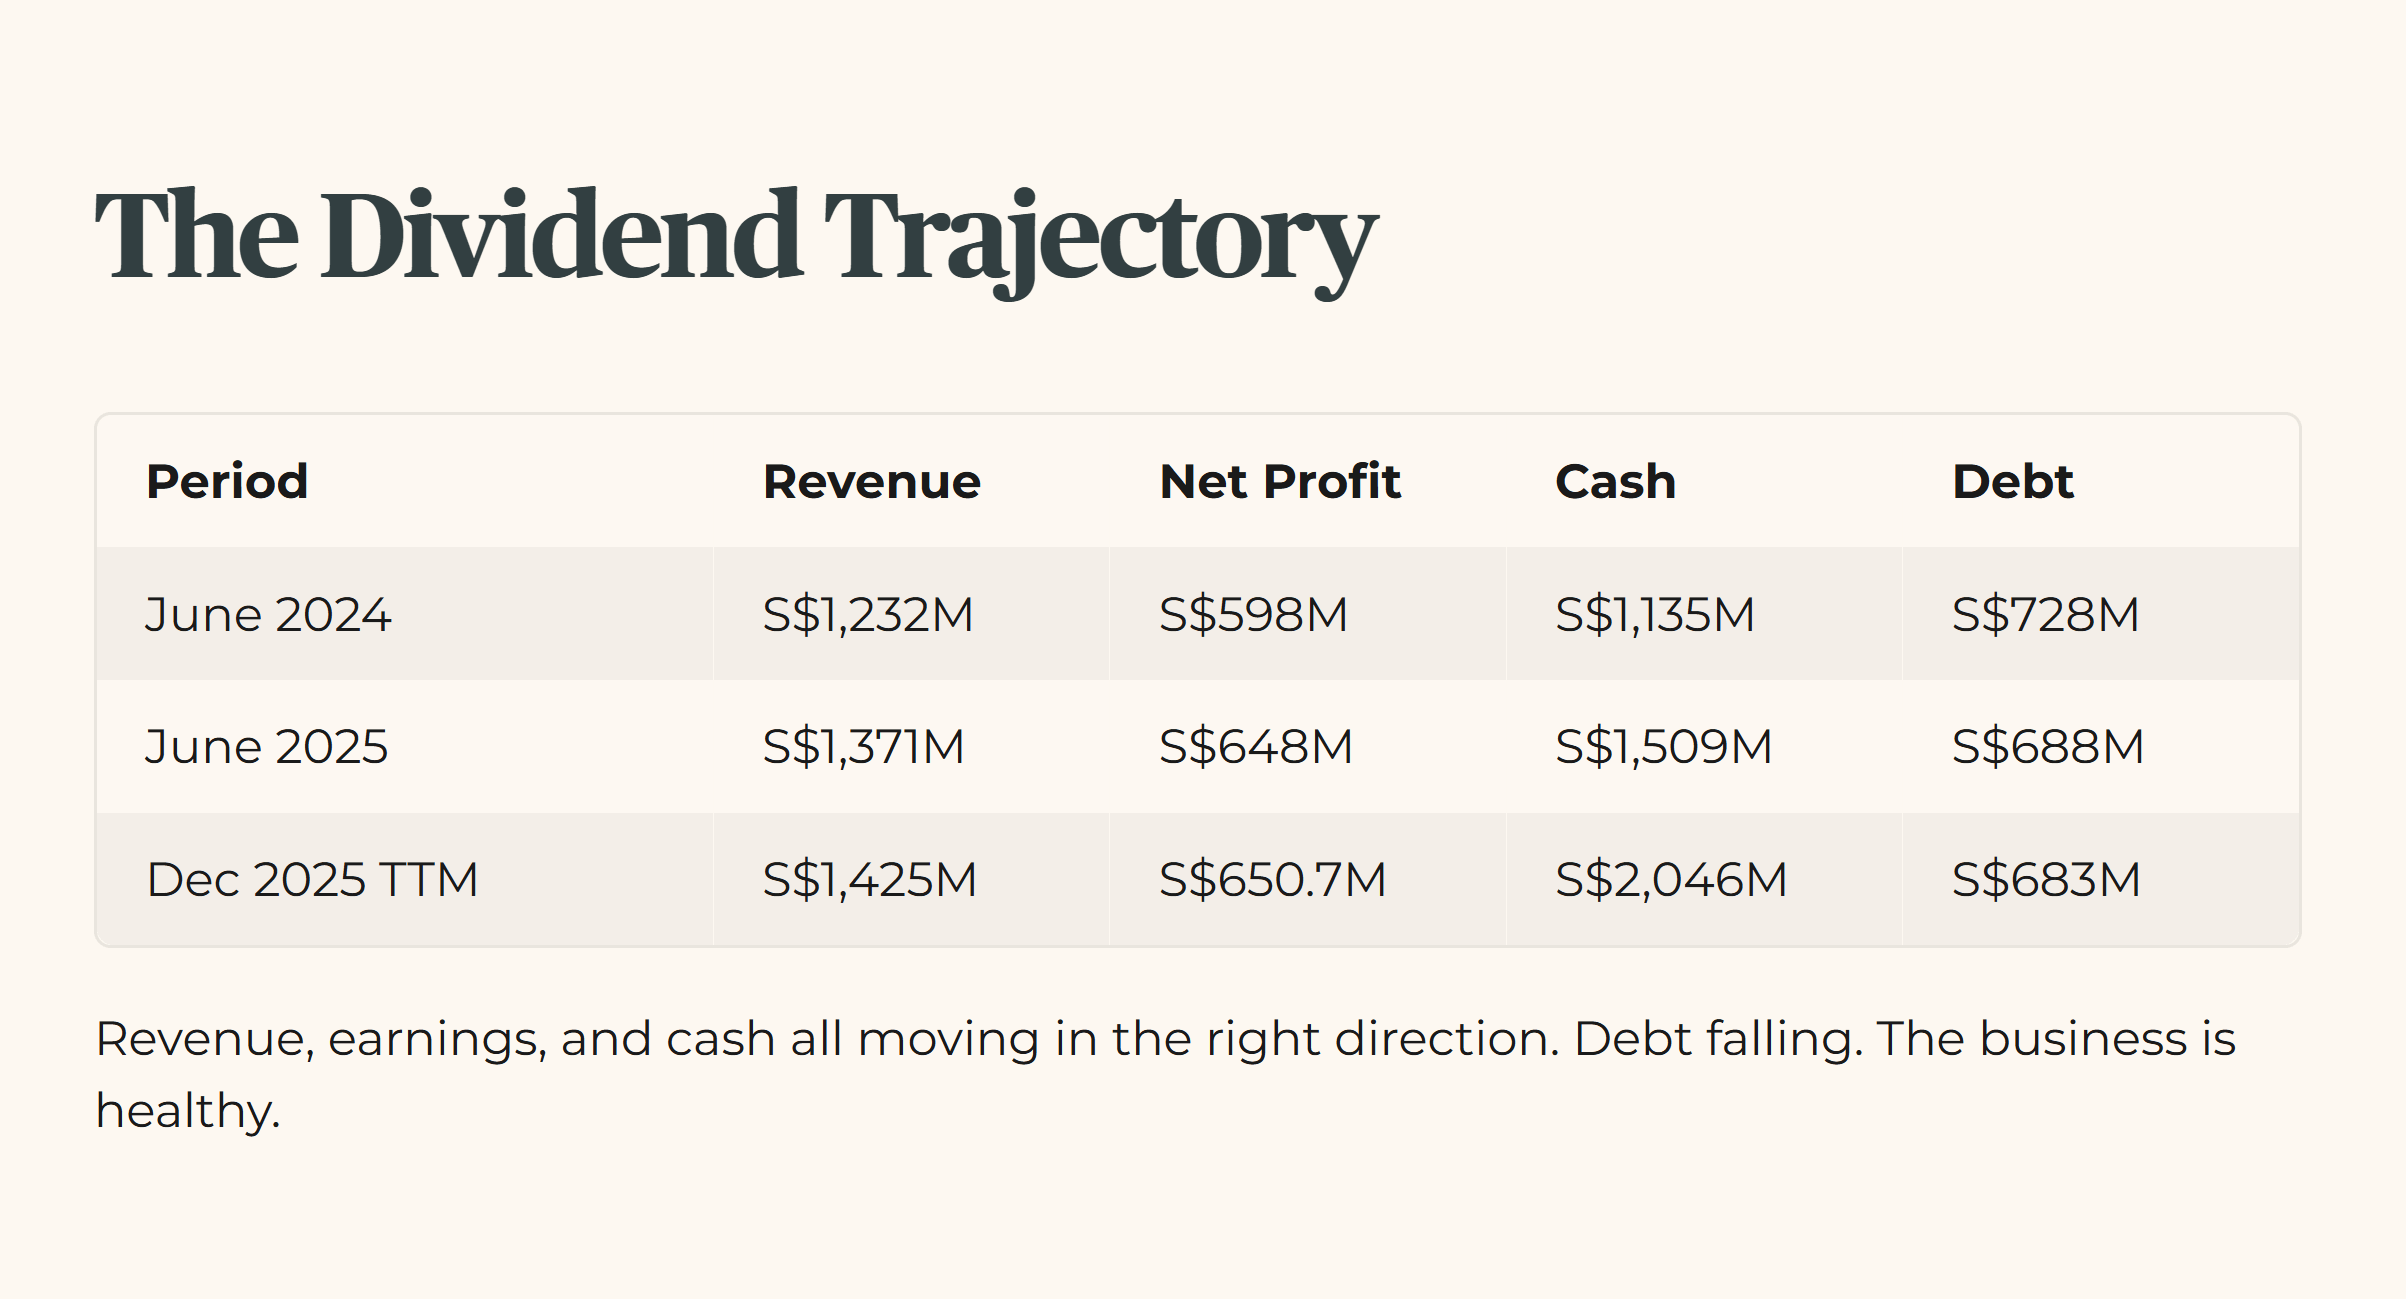
Revenue, earnings, and cash reserves are all moving in the right direction. Net profit rose from S$598 million to S$650.7 million. Cash climbed from S$1,135 million to S$2,046 million while debt fell from S$728 million to S$683 million.
Because this is an infrastructure monopoly with high free cash flow, it does not need to reinvest heavily to keep running. The dividend is safe from a coverage standpoint. Operating cash flow of S$826 million easily covers financing outflows of S$479 million. The risk of a cut is very low.
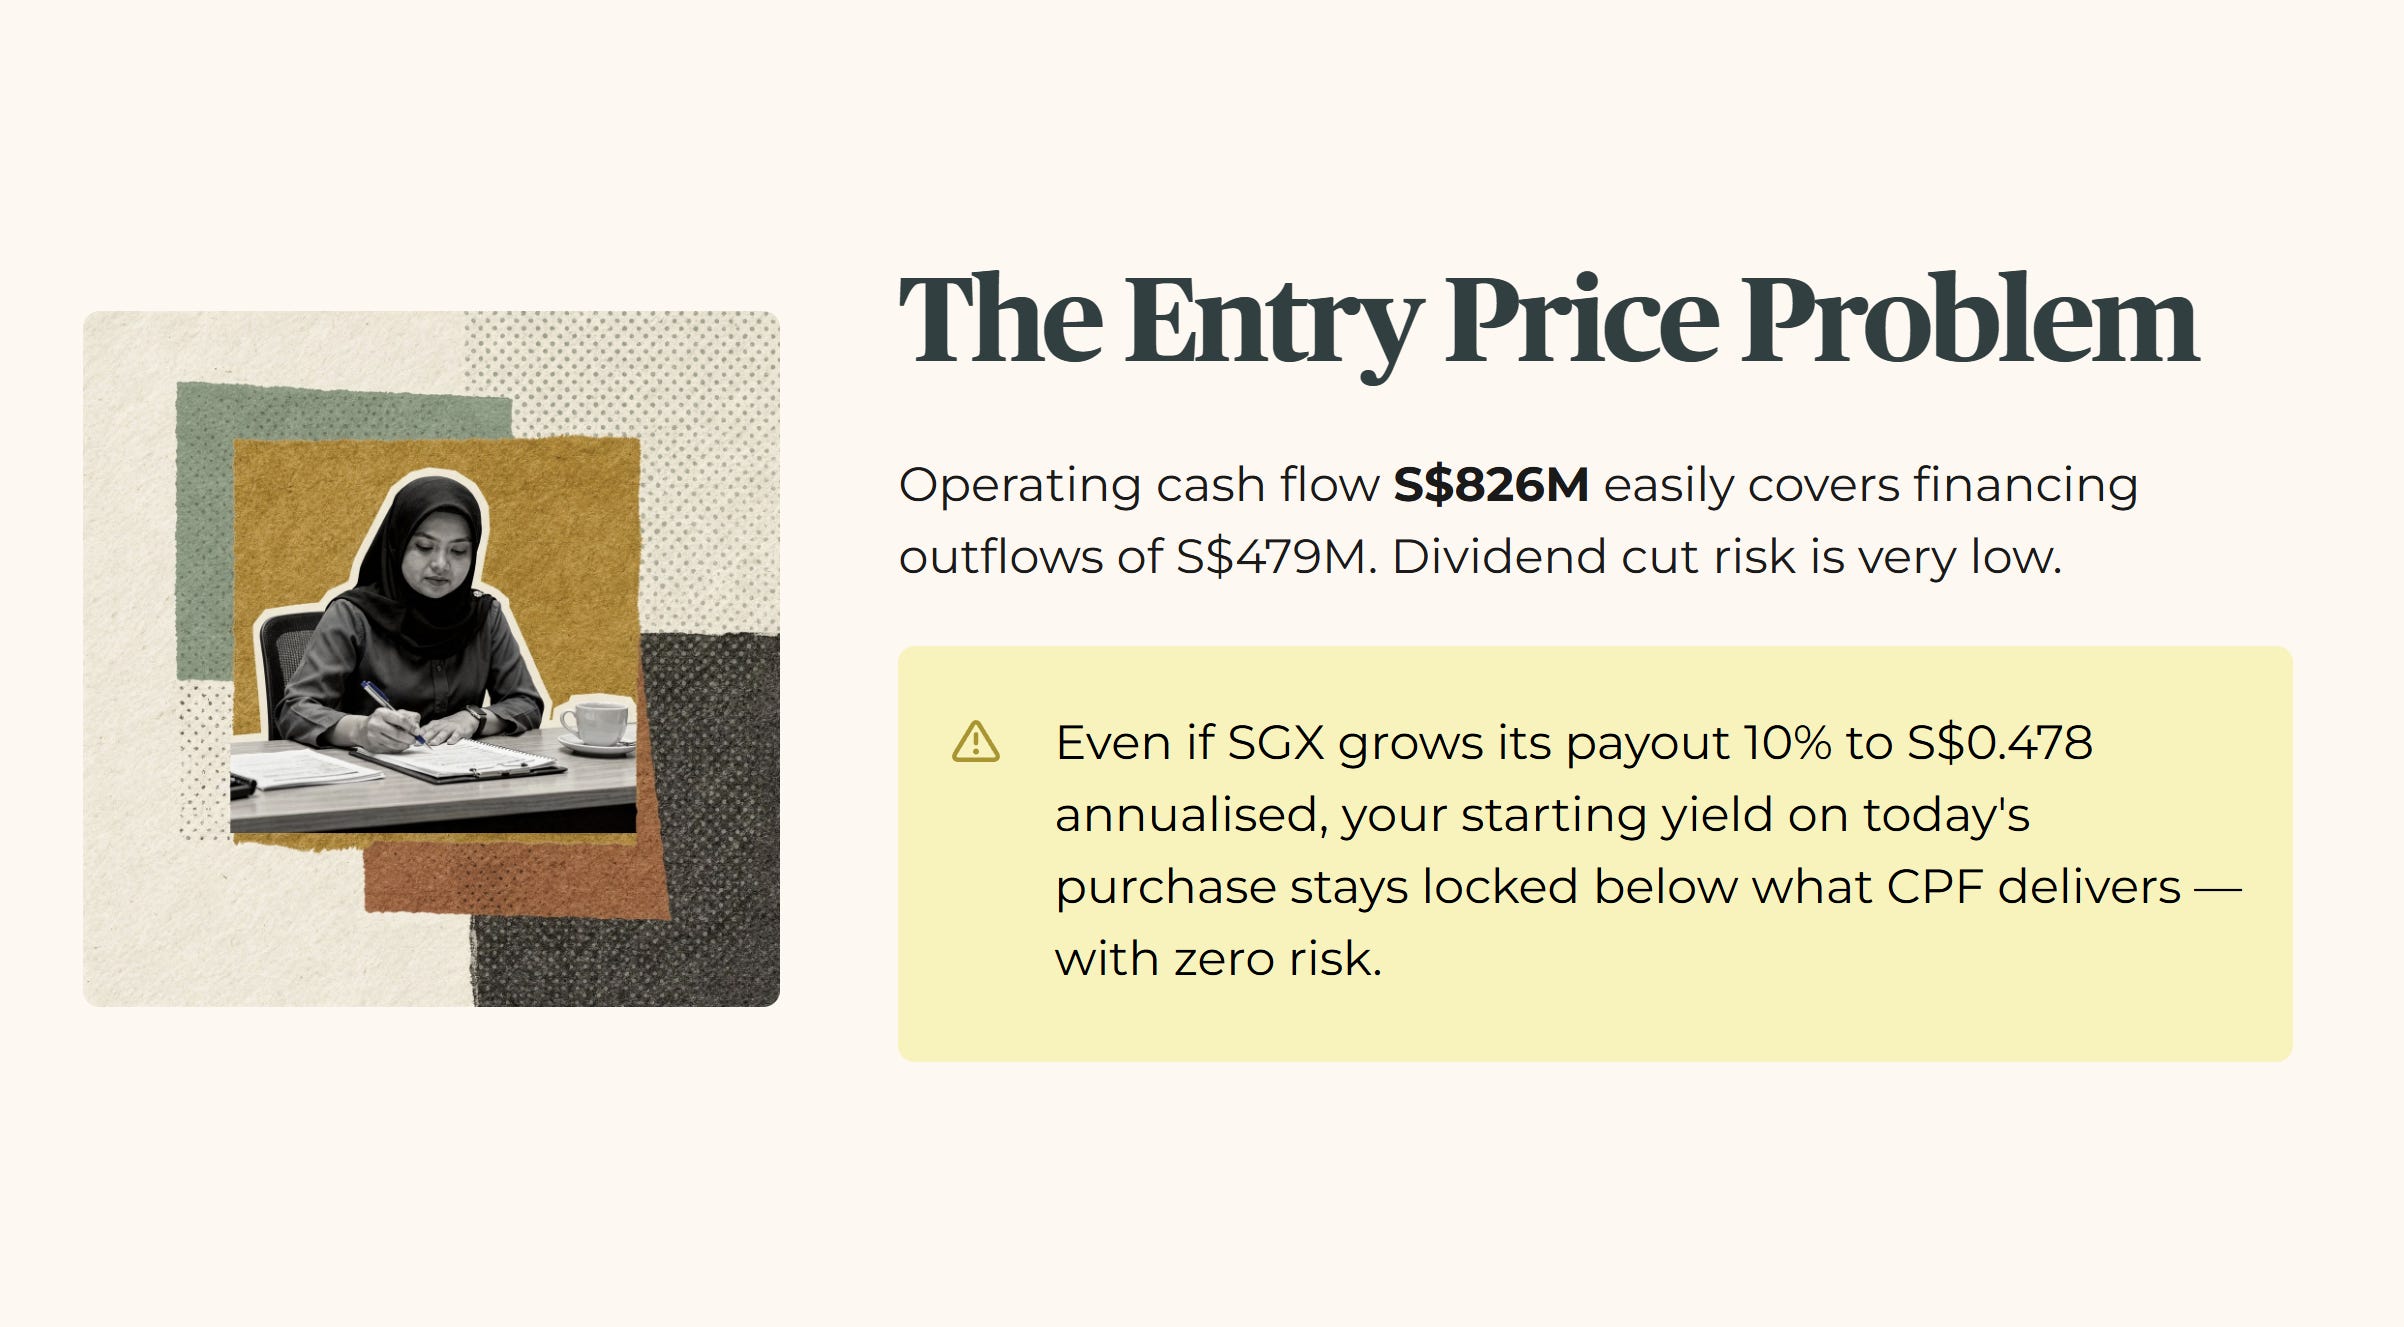
The problem is not operational. It is the entry price. At S$21.67, your yield is compressed to 2.06%. Even if the exchange grows its absolute payout by a further 10% to S$0.478 annualised, your starting yield on today’s purchase price stays locked below what CPF delivers with zero risk.
Section 4 — The Forensic Gap
This gap matters. An institutional analyst cares about relative performance, momentum, and short-term upgrades. From their seat, a stock at 34.8 times earnings can be Neutral because small- and mid-cap activity might support that multiple.
And let me be direct. An institutional money manager does not see 2.06% as a failure. They can capture capital appreciation from a net-cash monopoly during a market rally. They look at S$2.1 billion in daily volume and focus on market mechanics.
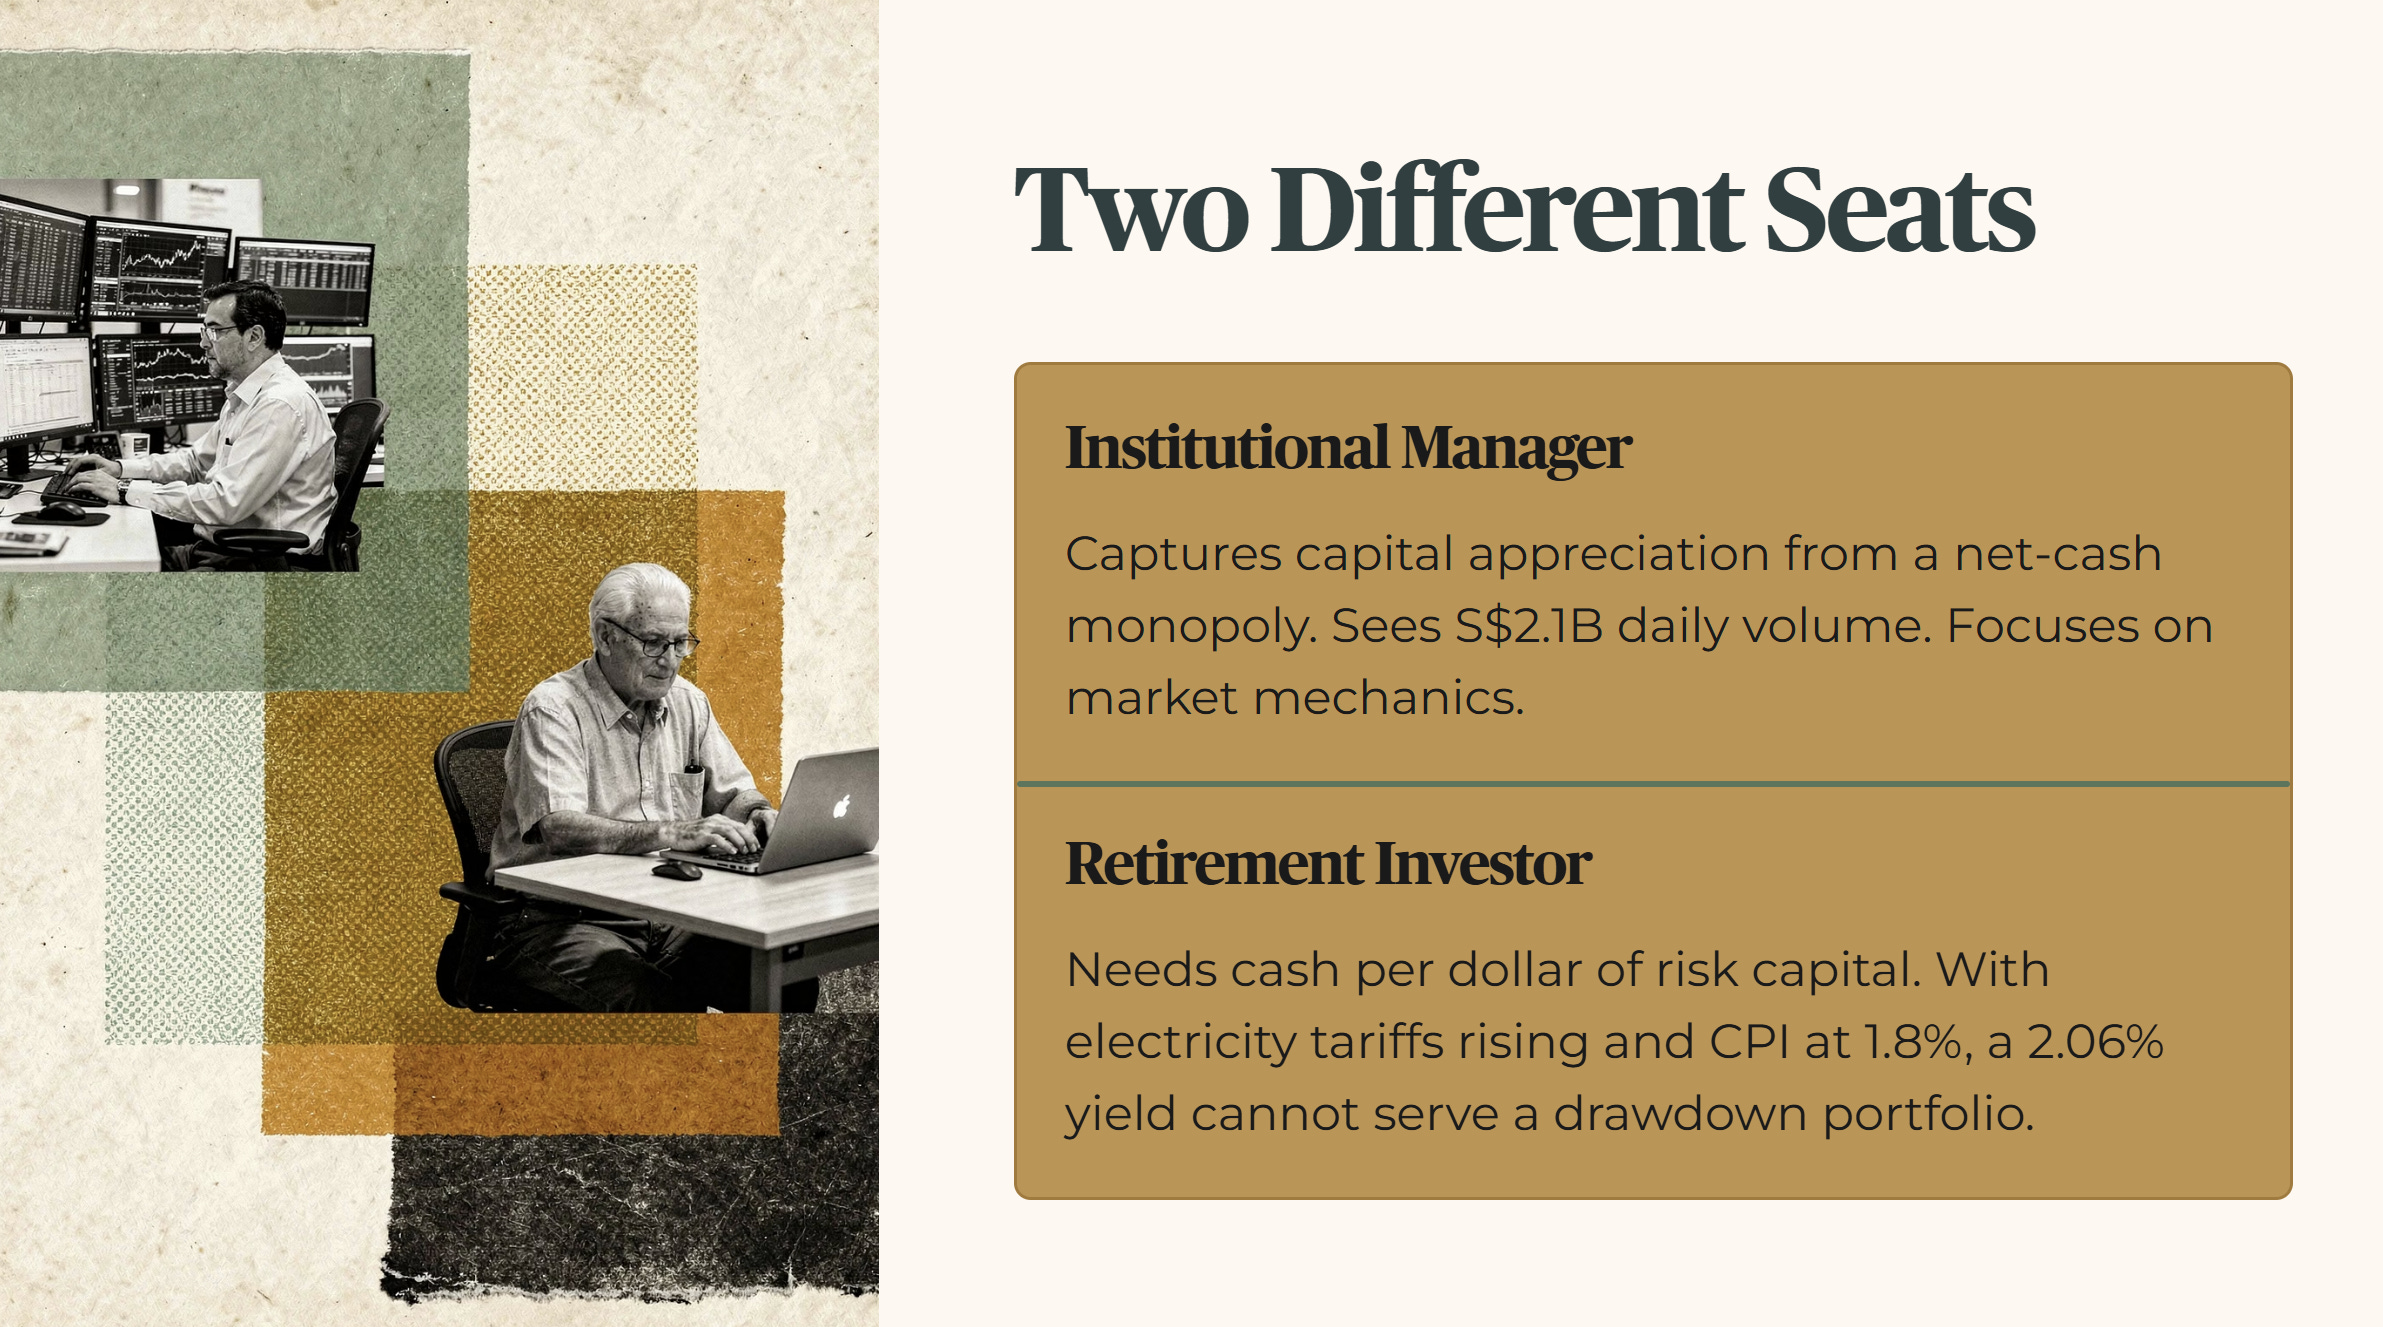
You cannot do that. You are managing a retirement portfolio. You need to look at cash production per dollar of risk capital deployed. When electricity tariffs are rising and headline inflation is running at 1.8% year-on-year, your income portfolio cannot afford to hold an asset yielding 2.06%. You need a real return premium over risk-free rates. Buying a business at an 18.8% premium to its fair value means sacrificing cash flow to chase volume metrics.
Iggy’s Insight Box 1
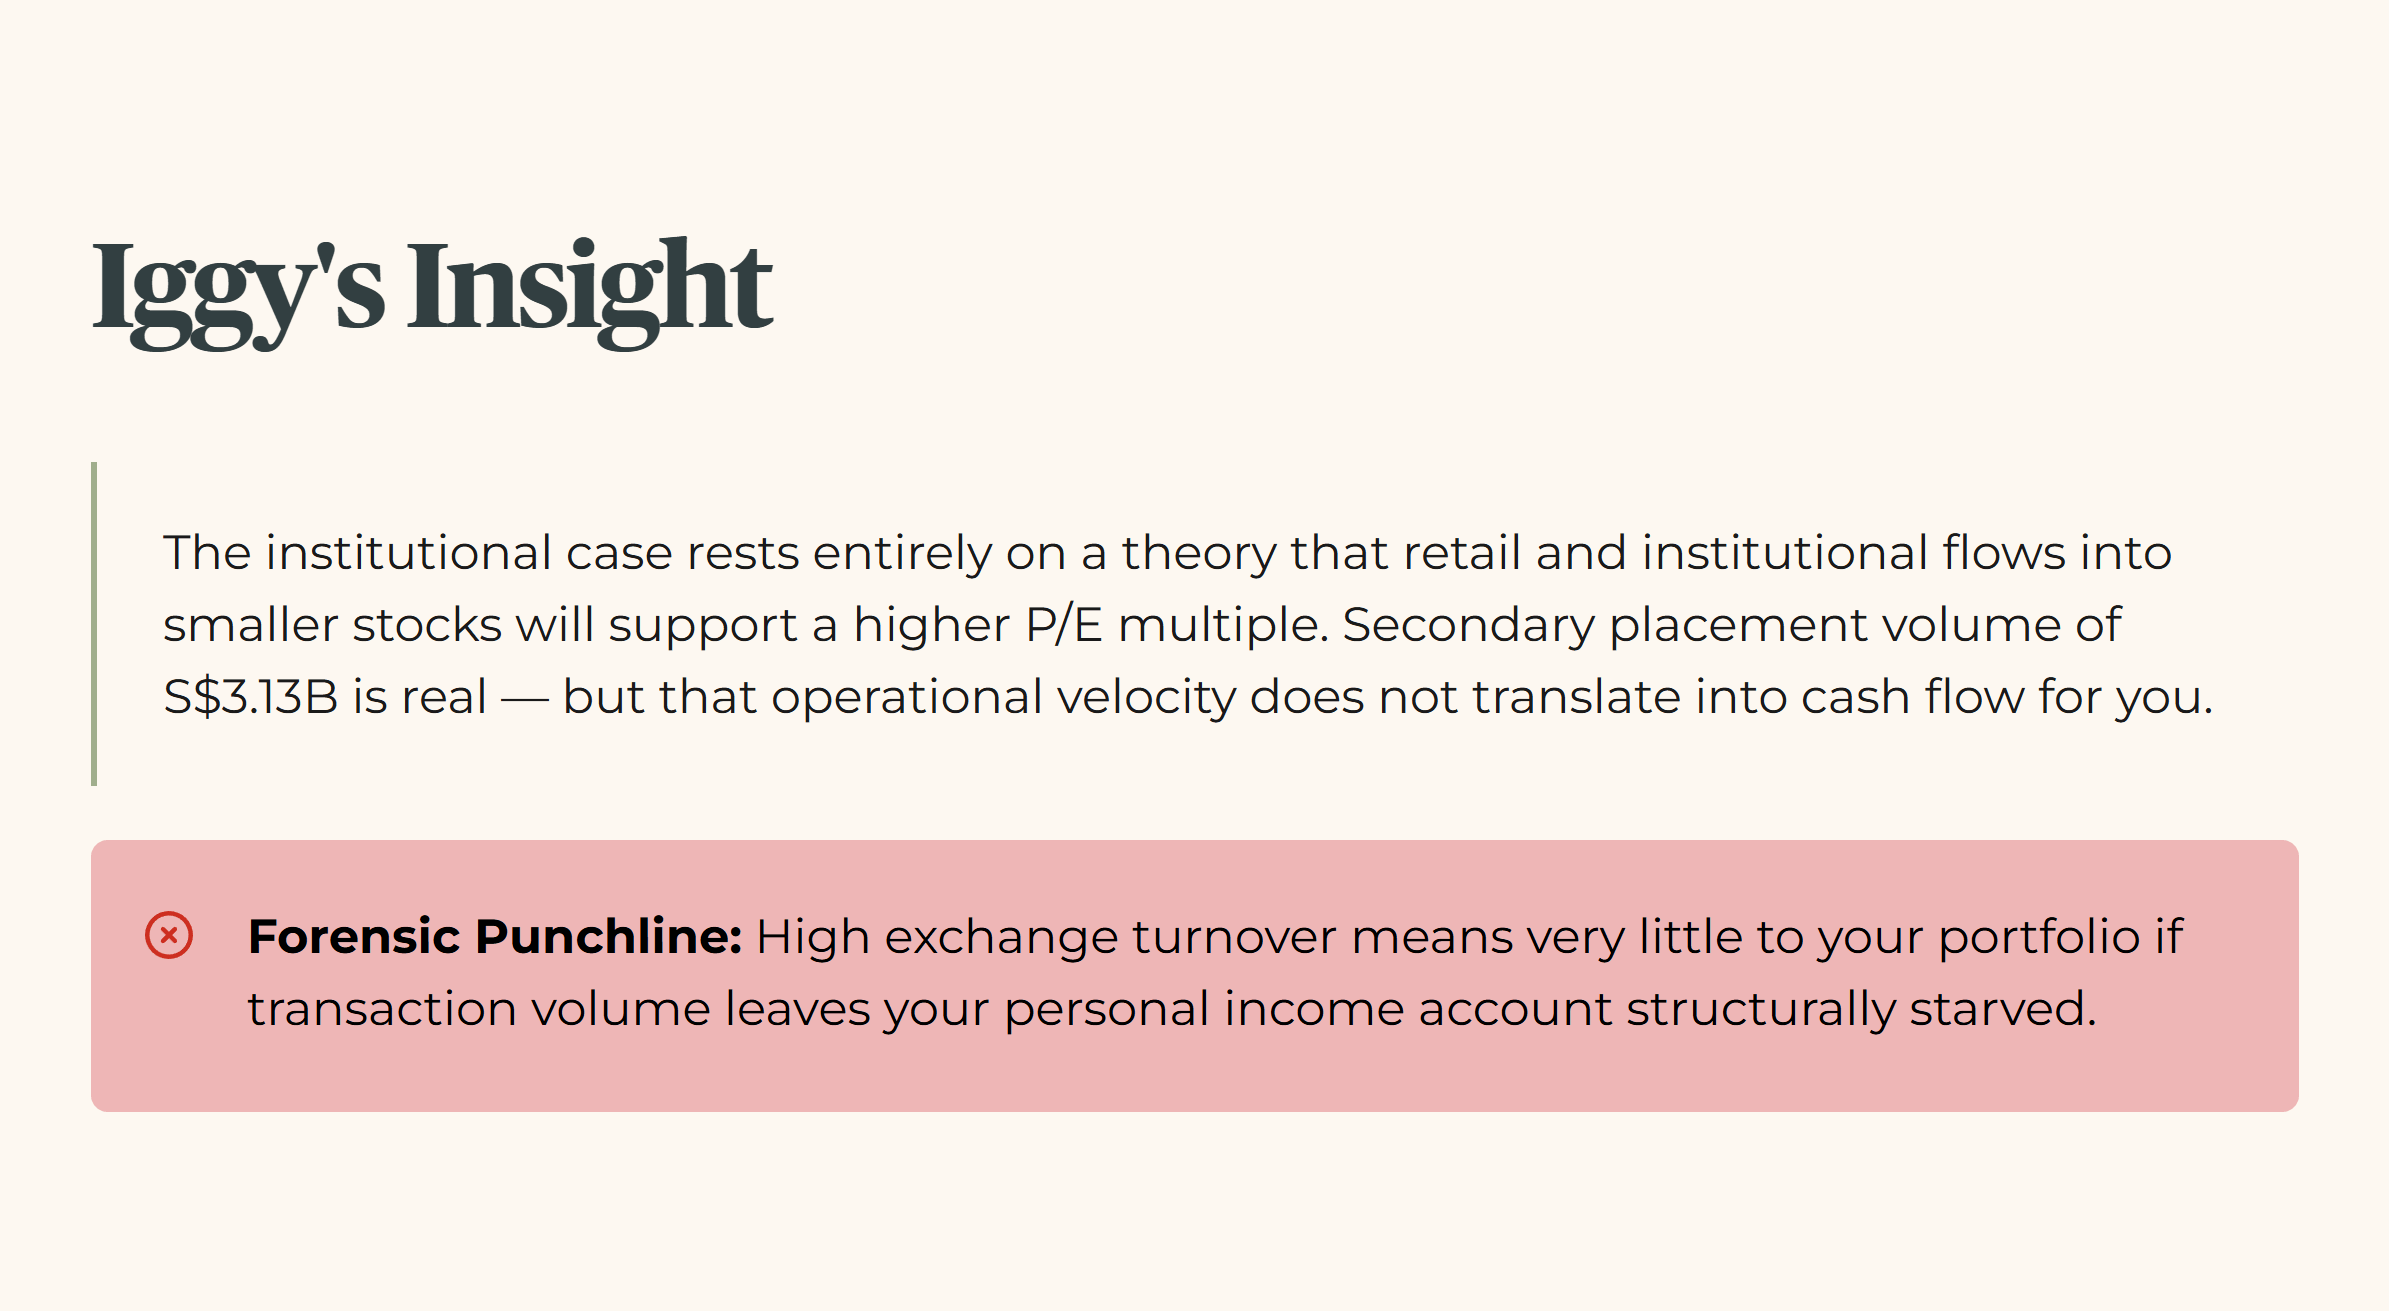
The institutional case for this stock rests entirely on a theory that retail and institutional flows into smaller stocks will support a higher price-to-earnings multiple. Yes, secondary placement volume has picked up to S$3.13 billion. But that operational velocity does not translate into cash flow for you. Chasing a monopoly at a multi-standard-deviation valuation premium forces you to accept institutional growth assumptions while taking on near-term capital downside risk. Financial metrics must serve your personal cash requirements, not the exchange’s transaction volume. Buying momentum at a deep yield discount is an unnecessary compromise.
Forensic Punchline: High exchange turnover means very little to your portfolio if the transaction volume leaves your personal income account structurally starved.
The full forensic breakdown that sits behind that 2.06% yield — from the step-by-step fair value spread to the live Red Zone watchlist that flagged this exact entry trap before the rally — is where the next section picks up.
