



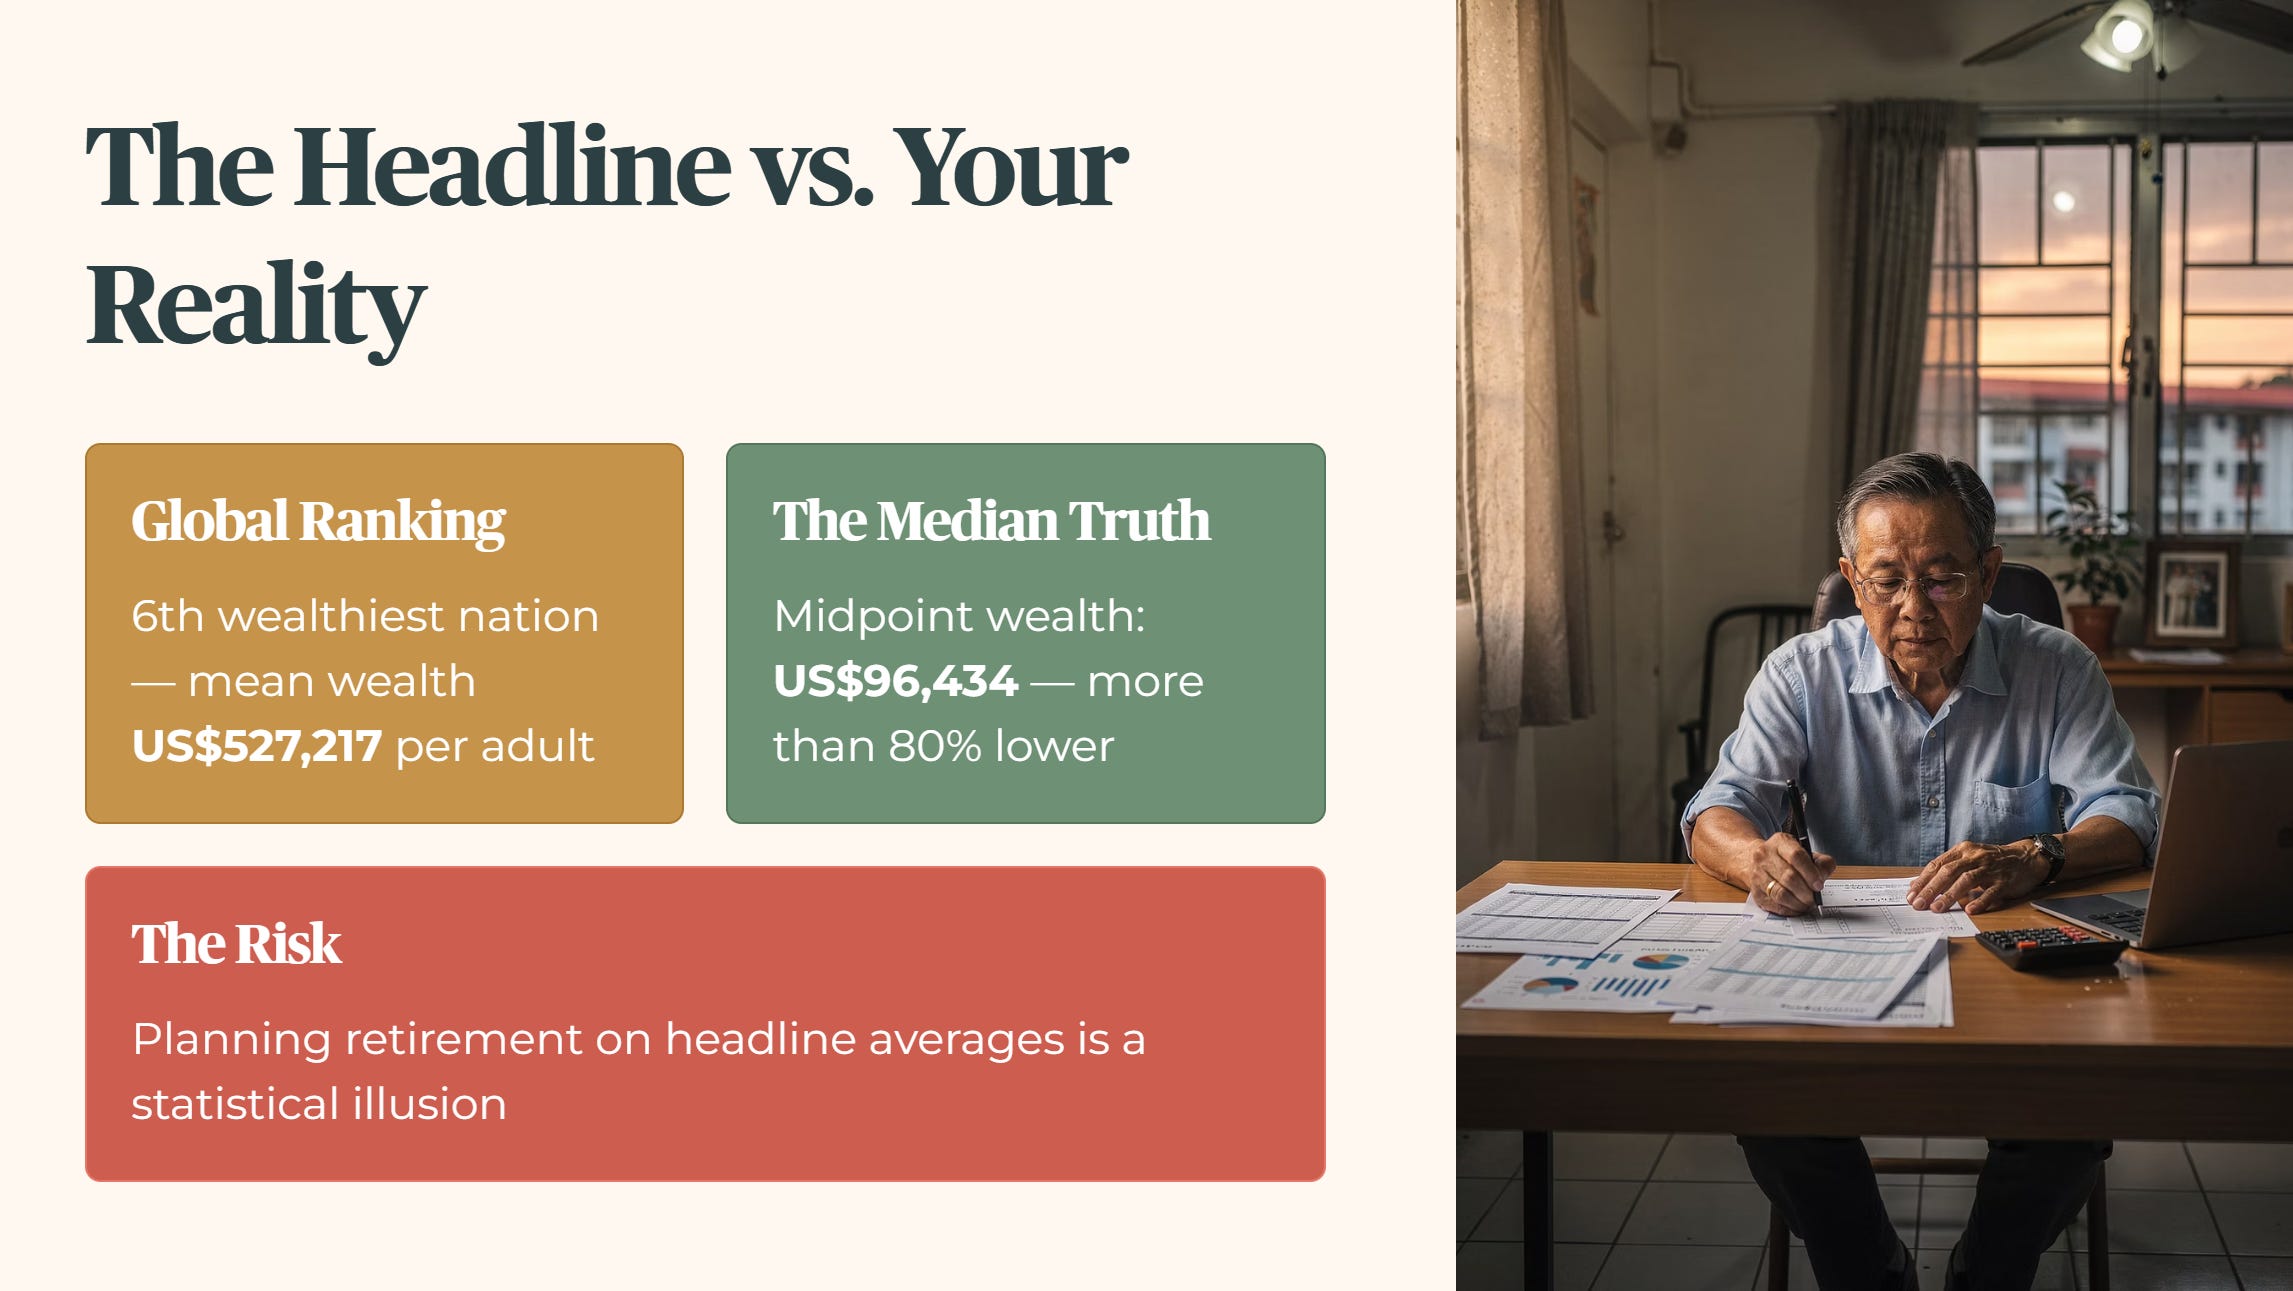
Singapore has just been ranked sixth globally in the latest wealth reports, boasting an average wealth of over half a million US dollars per adult. But if you look at the middle of our society instead of the top, that number shrinks by more than eighty percent to a vastly different reality. If you are calculating your retirement readiness using headline rankings, you are anchoring your wallet to a statistical illusion.
If you are chasing headline growth or macro bragging rights, global rankings might satisfy your thesis. But if you are a retiree focused on wealth preservation and dependable drawdown income, my forensic standard is built to protect your actual capital rather than celebrate average numbers.
Let’s look past the glossy reports and examine what the numbers say about the real world we live in.

Singapore’s Wealth Gap in Global Context
Decoding Your Real Household Balance Sheet
The Wallet Impact: Choosing the Honest Yardstick
Restructuring Your Personal Wealth Target
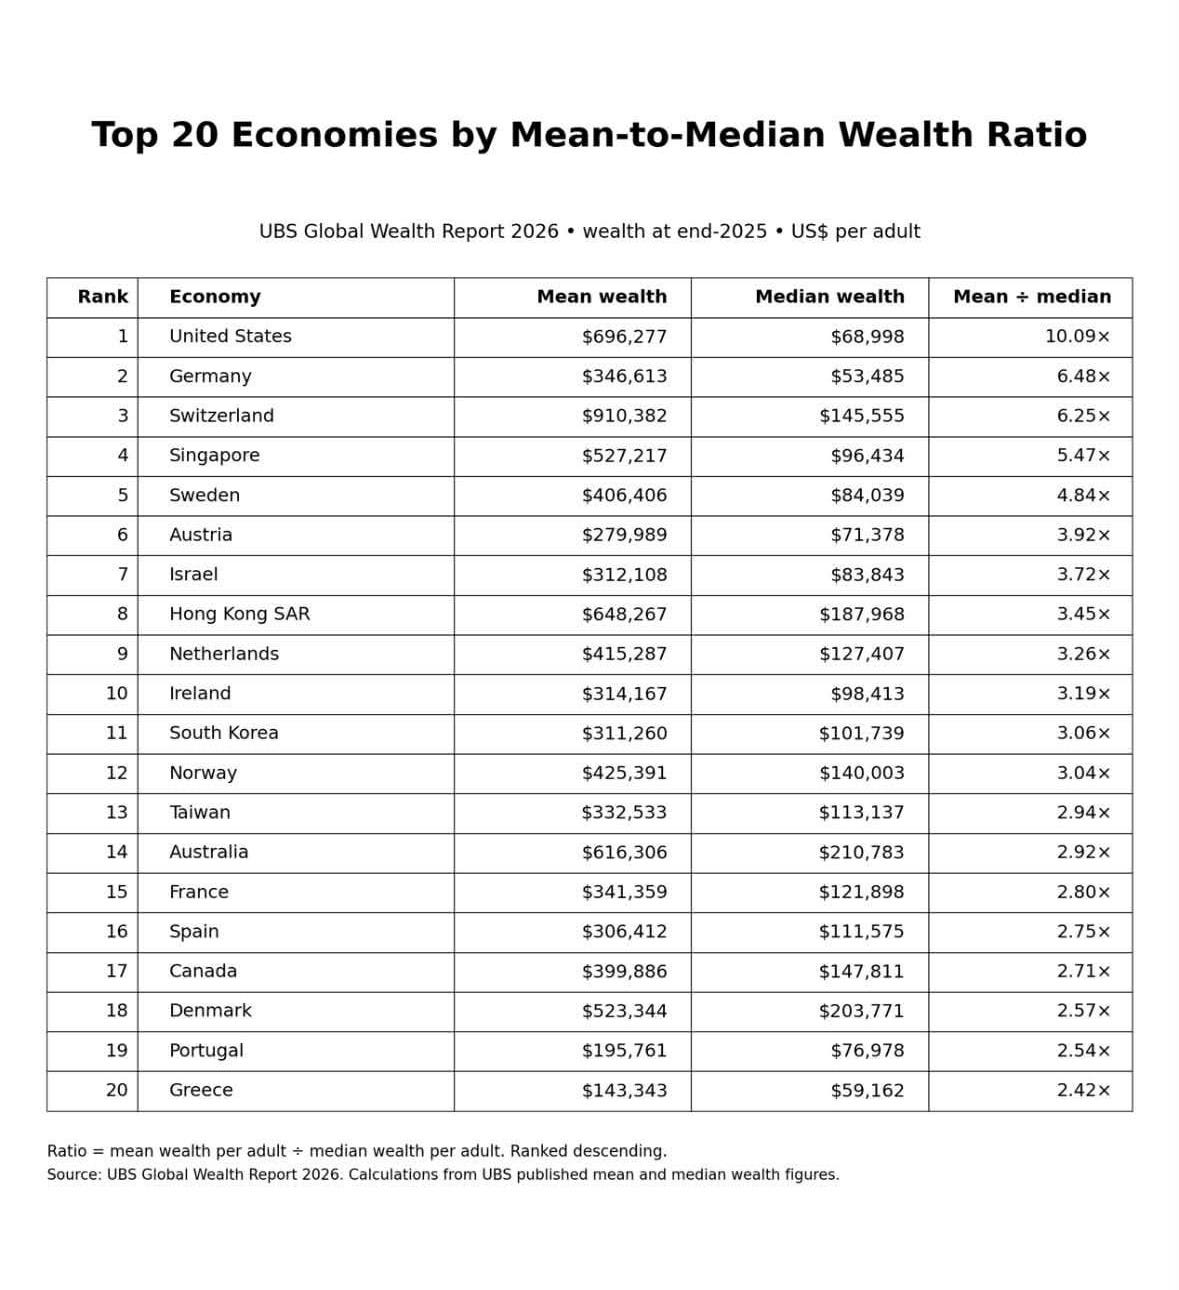
Source: UBS Global Wealth Report 2026. Calculations from UBS published mean and median figures
The Statistical Illusion: Mean Versus Median
We need to address how global institutions measure wealth, because the headline figures you read in the papers can easily mislead you if you don’t know the math behind them. The two most common tools are the mean and the median.
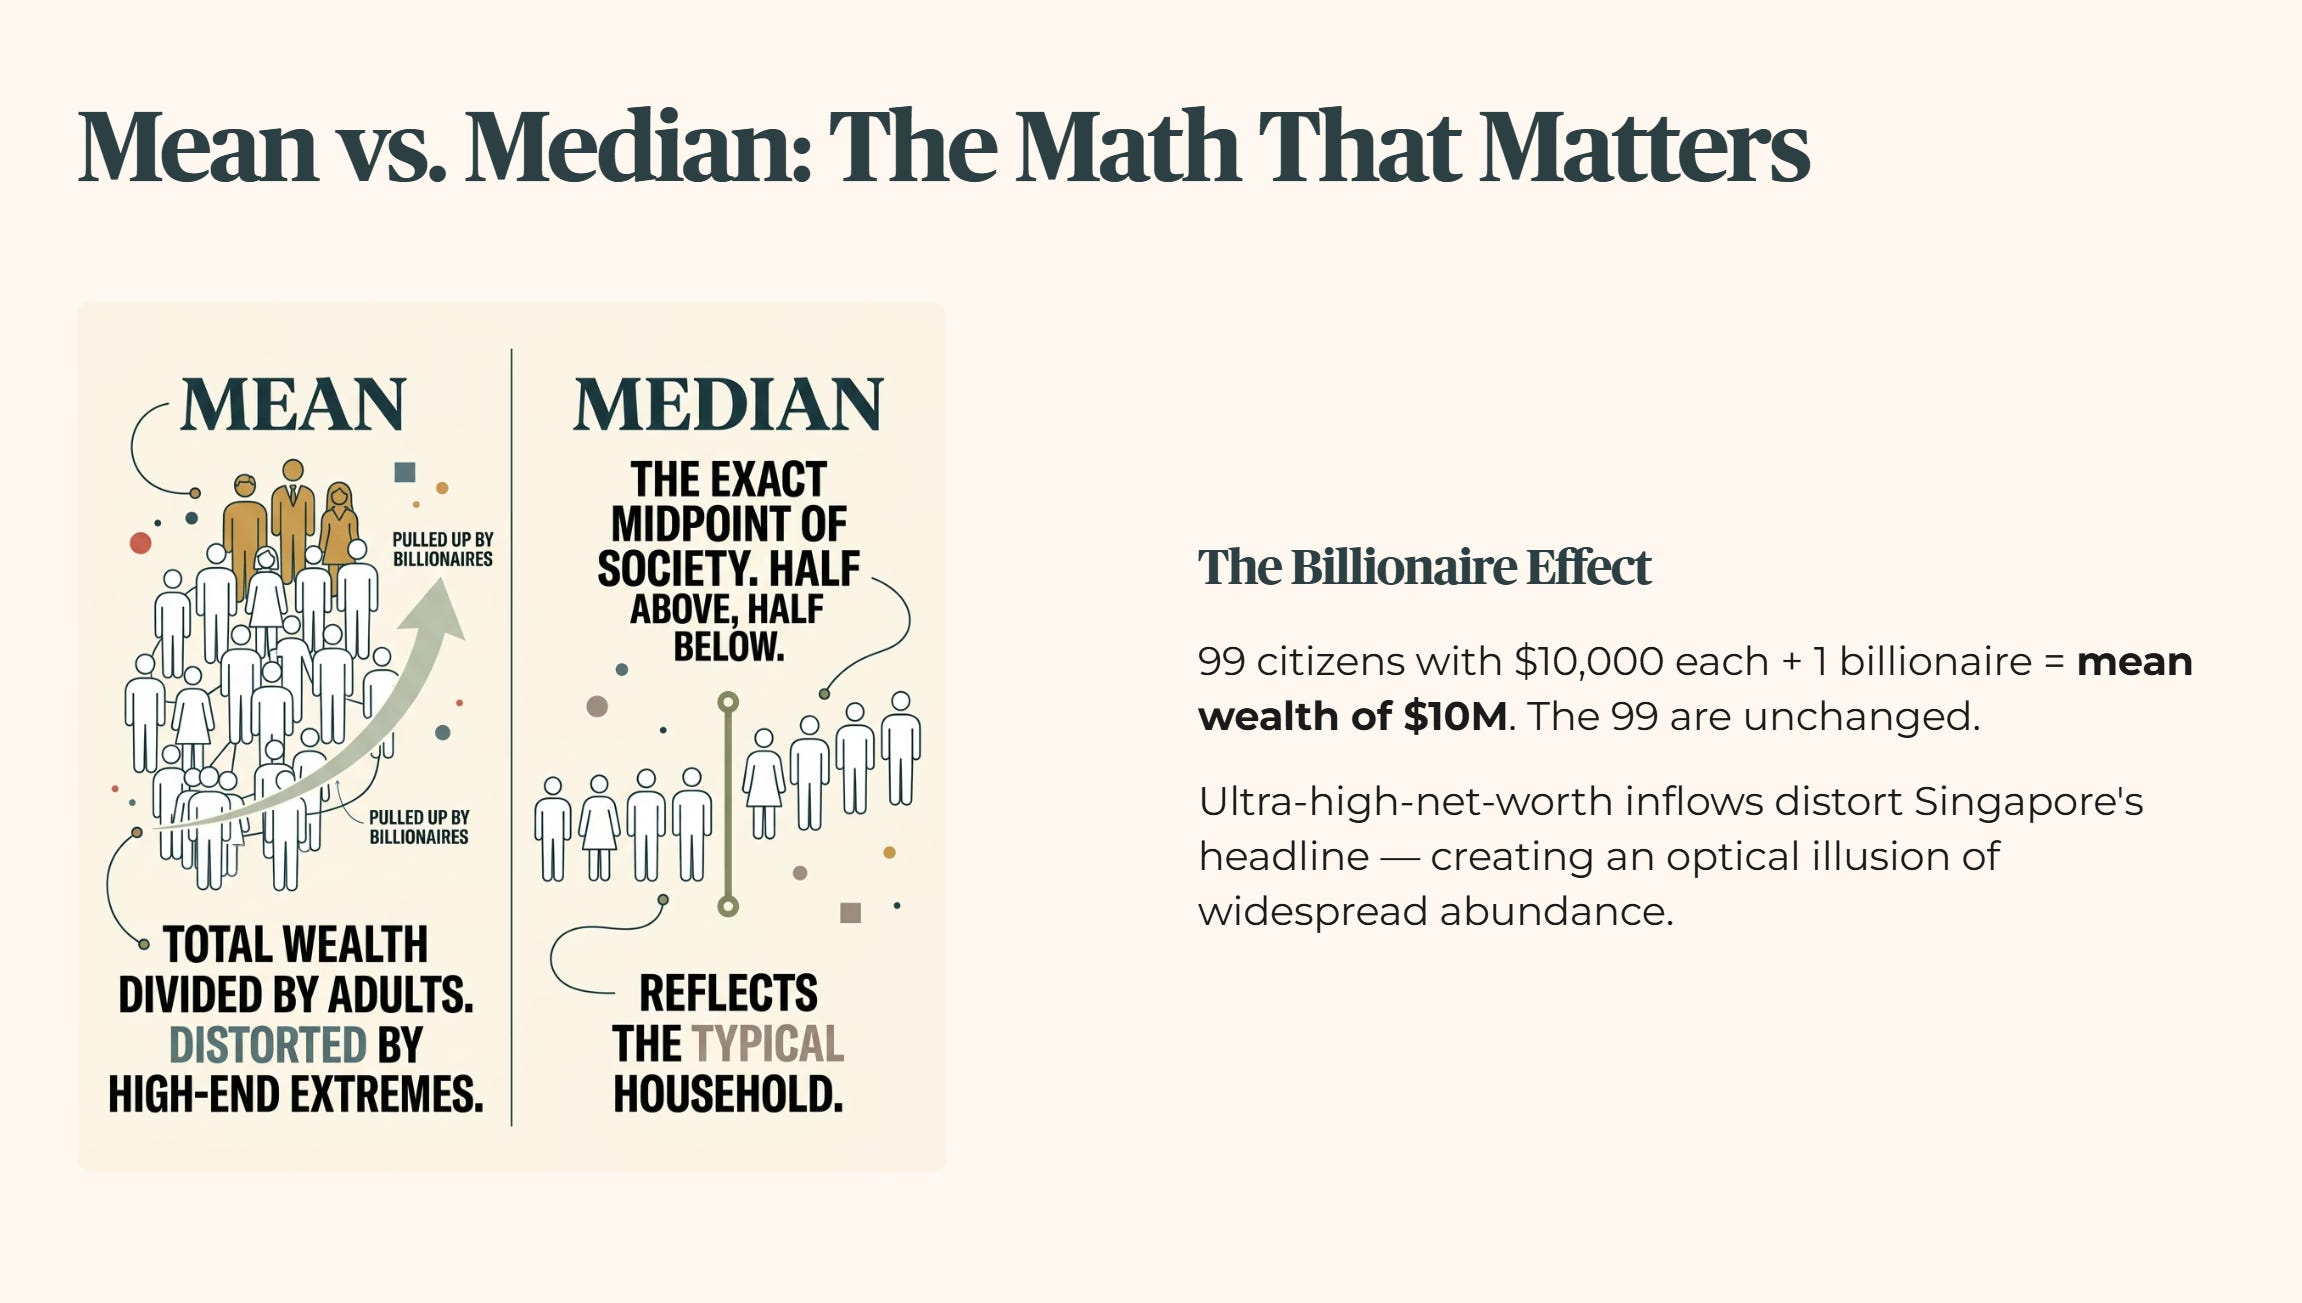
Mean wealth: this is simply the total wealth of the country divided by the number of adults. It is what most people call the average.
Median wealth: in plain terms, this is the exact midpoint of society. If you lined up every adult in Singapore from the poorest to the wealthiest, the median is the person standing right in the middle. Half the population has more than this person, and half has less.
When a country has massive wealth at the very top, the mean gets pulled heavily upward. It doesn’t mean the typical household has that cash; it just means a small group of high-net-worth individuals is tilting the scales. For a retiree trying to figure out if their nest egg is genuinely secure, benchmarking against an average inflated by billionaires is a quick path to financial complacency.
And let’s be honest, the temptation to believe the headline average is strong because it makes our collective economic success feel personal. But when you are sitting down with your own balance sheet on a weekend, trying to calculate how many years your private savings will last, an international trophy numbers aggregate will not fund a single morning at the market. If you mistake a national average for a personal baseline, you risk building a retirement plan on sand.
Understanding this gap requires looking directly at the mechanics of wealth concentration. If a room contains ninety-nine citizens with ten thousand dollars each and one billionaire, the mean wealth of that room is ten million dollars. Yet, the economic reality for ninety-nine percent of the people in that room is completely unchanged by the presence of that single billionaire.
This is exactly what happens when international wealth reports look at global financial hubs. The influx of ultra-high-net-worth capital distort the headline numbers, creating an optical illusion of widespread household abundance that vanishes the moment you apply the midpoint filter.
Singapore’s Wealth Gap in Global Context
According to the UBS Global Wealth Report 2026, Singapore’s mean wealth per adult stands at US$527,217. Yet our median wealth is just US$96,434. That is a massive 5.5x gap between the average and the midpoint.
To see why this matters, we have to look at how other major financial hubs compare.
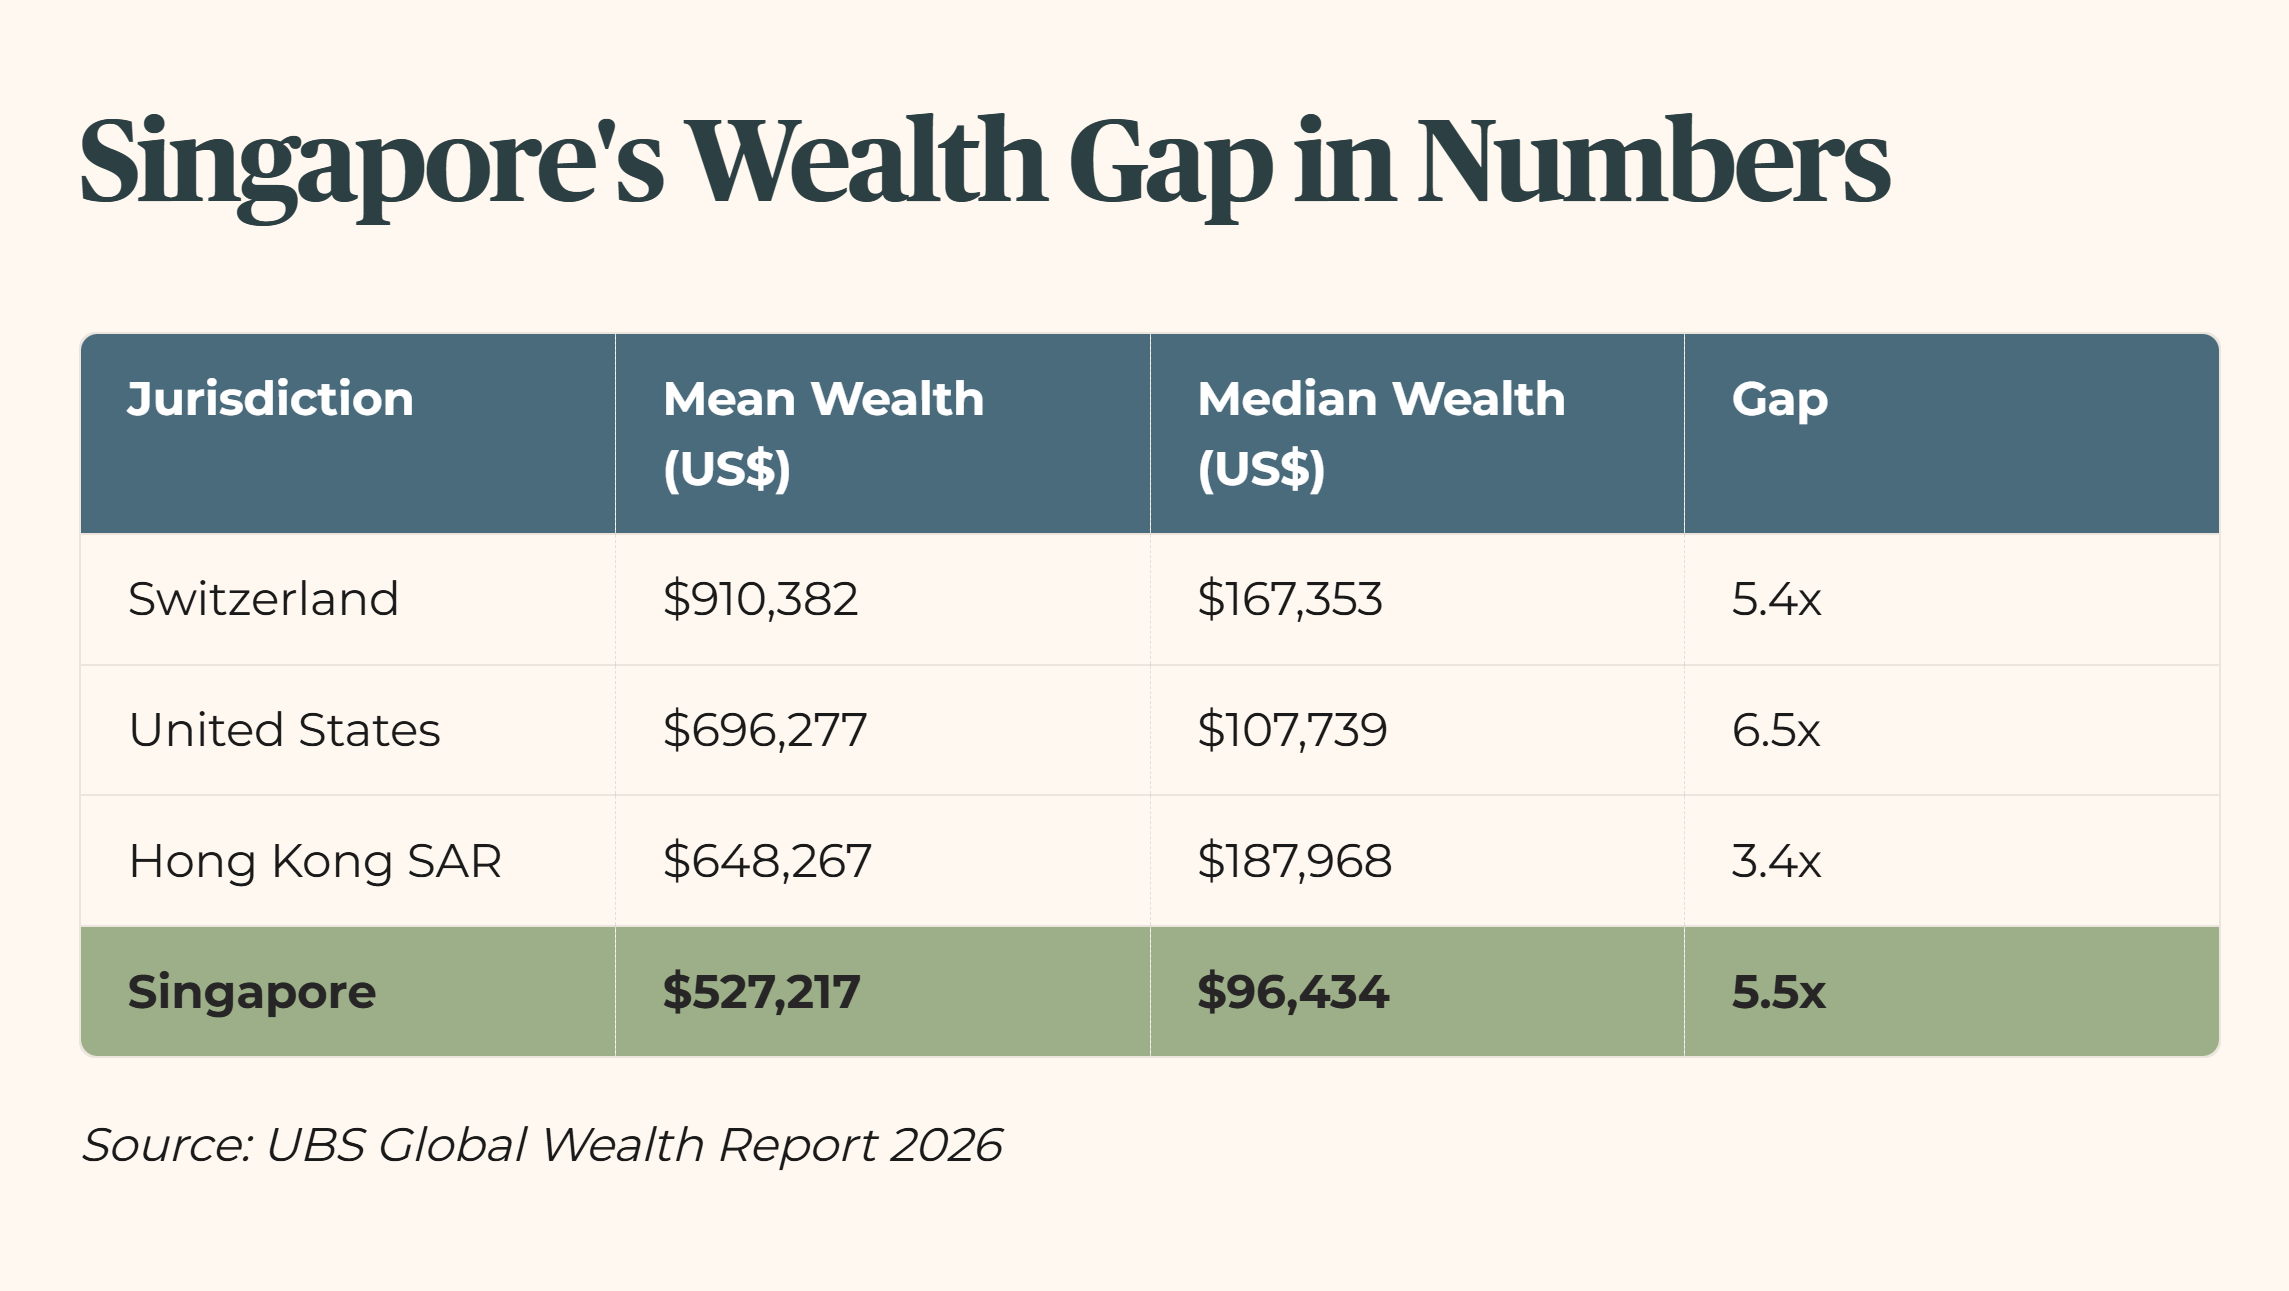
This table tells a fascinating story. The United States shows a 6.5x gap and Switzerland sits at 5.4x, both driven by concentration at the top end of their wealth distributions. But look closely at Hong Kong. While their mean wealth is higher than ours, their median wealth is nearly double Singapore’s at US$187,968, resulting in a much tighter 3.4x gap.
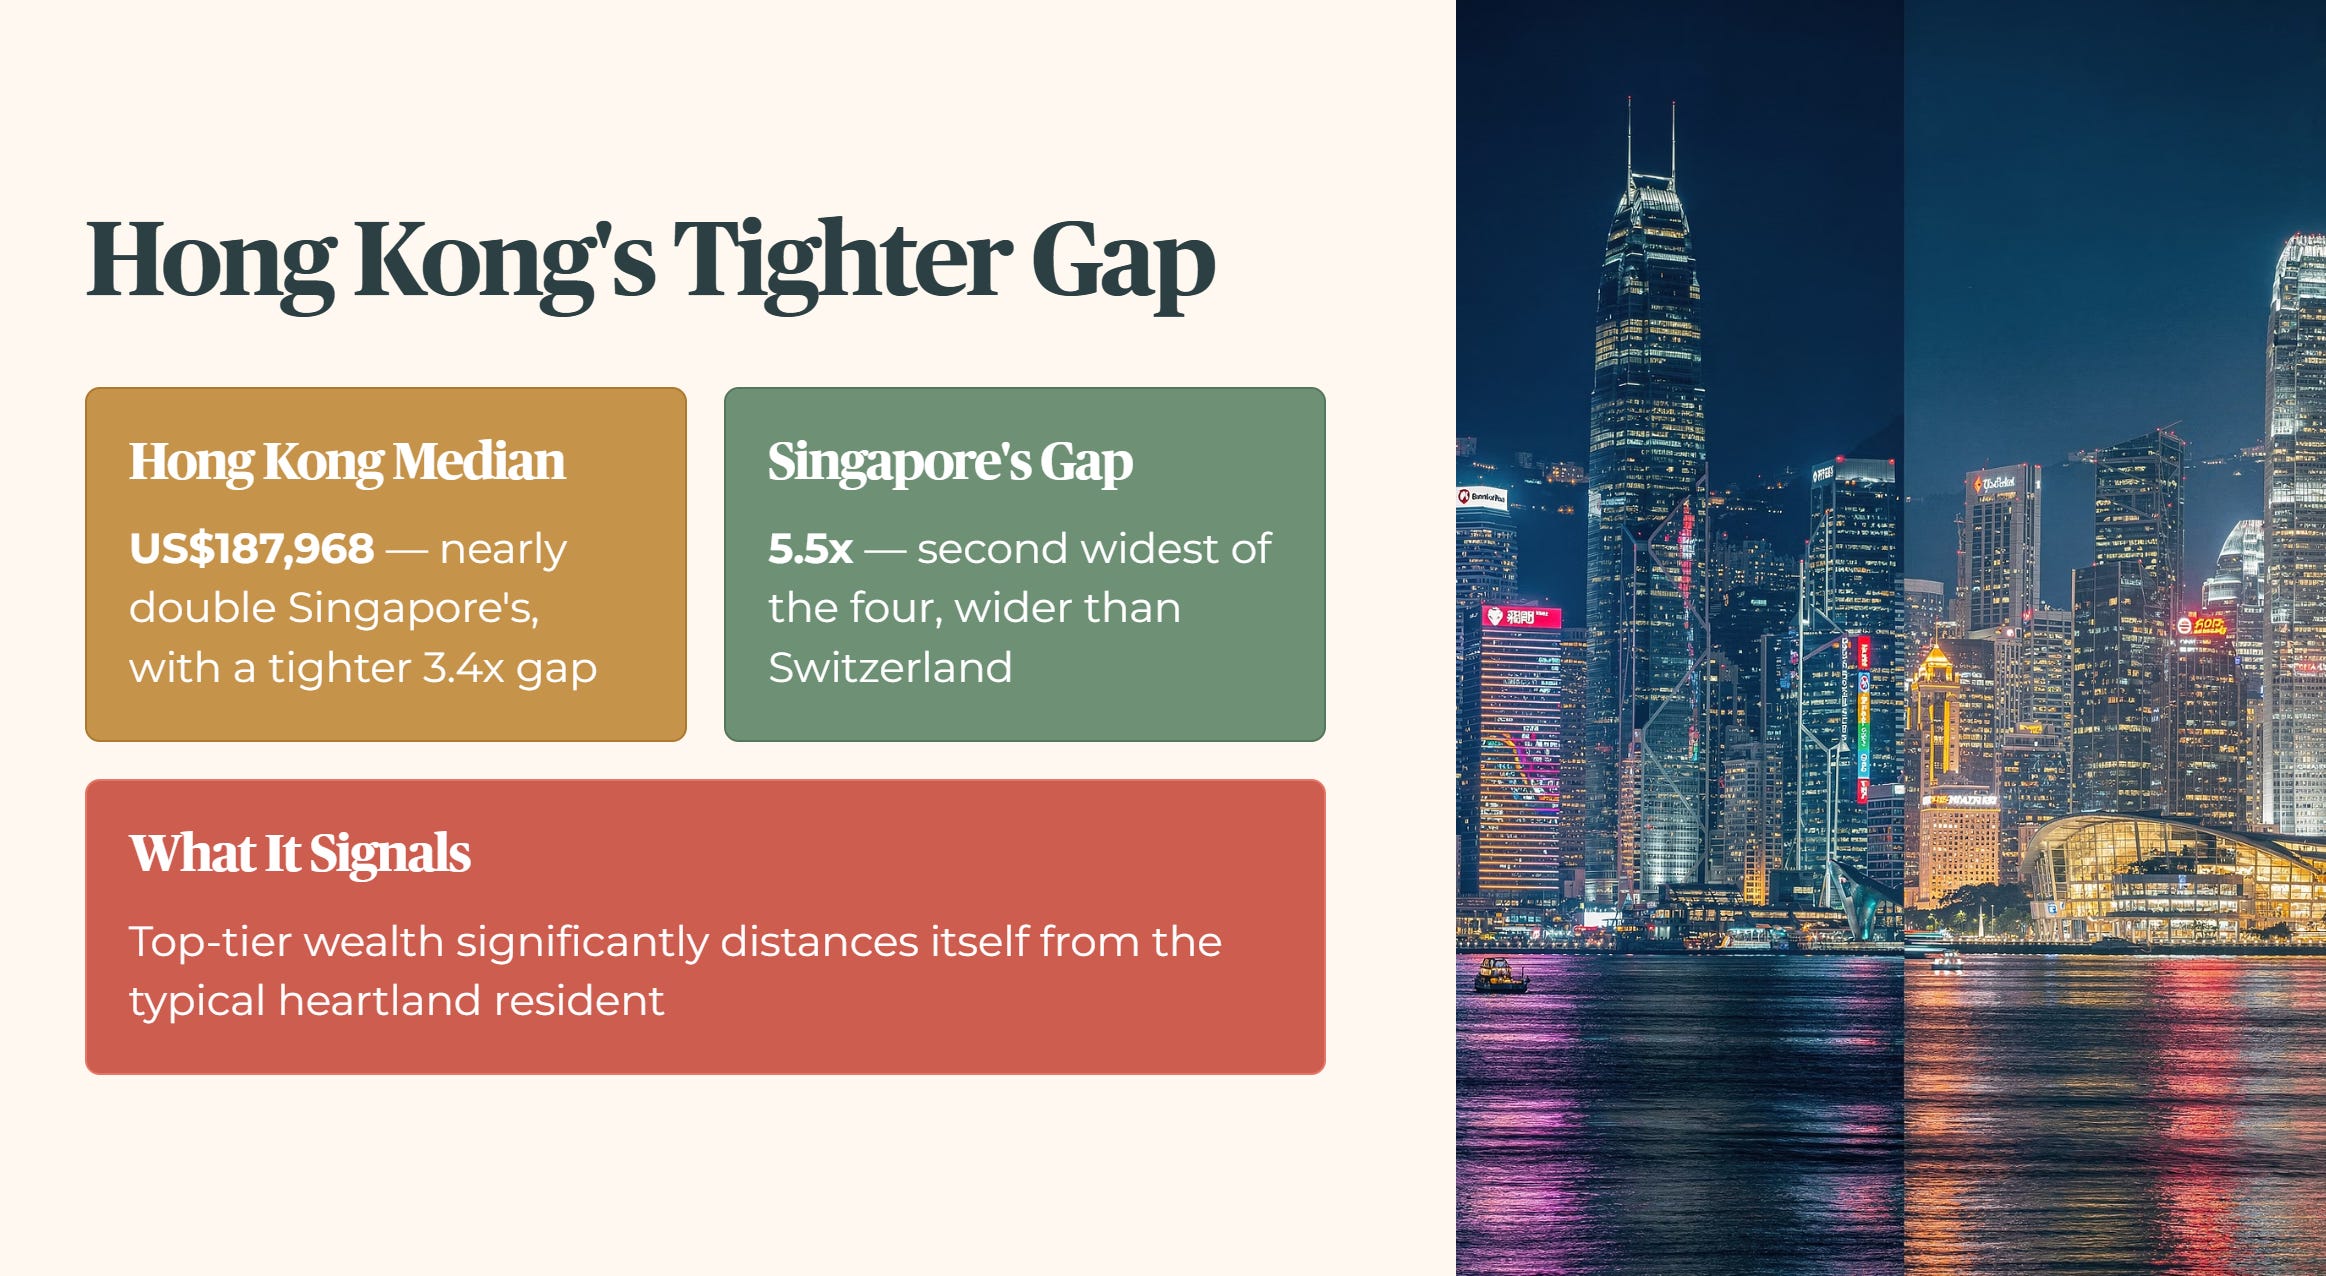
A tighter ratio means the headline wealth is more evenly distributed across the population. Singapore’s 5.5x gap is the second widest of the four markets in this table, wider even than Switzerland’s, and signals that while we are highly effective at attracting global capital and ultra-high-net-worth individuals to our shores, that top-tier wealth significantly distances itself from what a typical middle-class heartland resident actually accumulates.
So what does this mean for you? It means when international indices rank Singapore as one of the prime wealth capitals of the modern world, they are measuring the depth of our institutional reservoirs and the density of our private banking enclaves. They are not measuring the liquid asset runway of a professional trying to transition out of the workforce. When you look at Hong Kong’s tighter 3.4x gap, you see a financial structure where the absolute midpoint citizen holds a significantly larger liquid buffer relative to the headline average. For a local investor, this global context is an explicit warning: relying on general economic buoyancy to secure your personal retirement is a structural error.
🦎 Iggy’s Insight
Global wealth tables are useful for economic agencies, but they are practically useless for personal retirement planning. When the average wealth is five and a half times higher than the median, the average ceases to be a reliable guide for the everyday citizen. Your retirement strategy cannot be based on the financial gravity of the top one percent. True financial security is an individual ledger, not a shared national statistic. Benchmark your progress against structural realities, not international press releases.
Decoding Your Real Household Balance Sheet
If the global averages don’t reflect your reality, what does? The answer lies in how typical local wealth is actually built. SingStat’s Q4 2025 household sector balance sheet data (released on 26 February 2026) provides a very clear picture of how Singaporean households hold their assets.
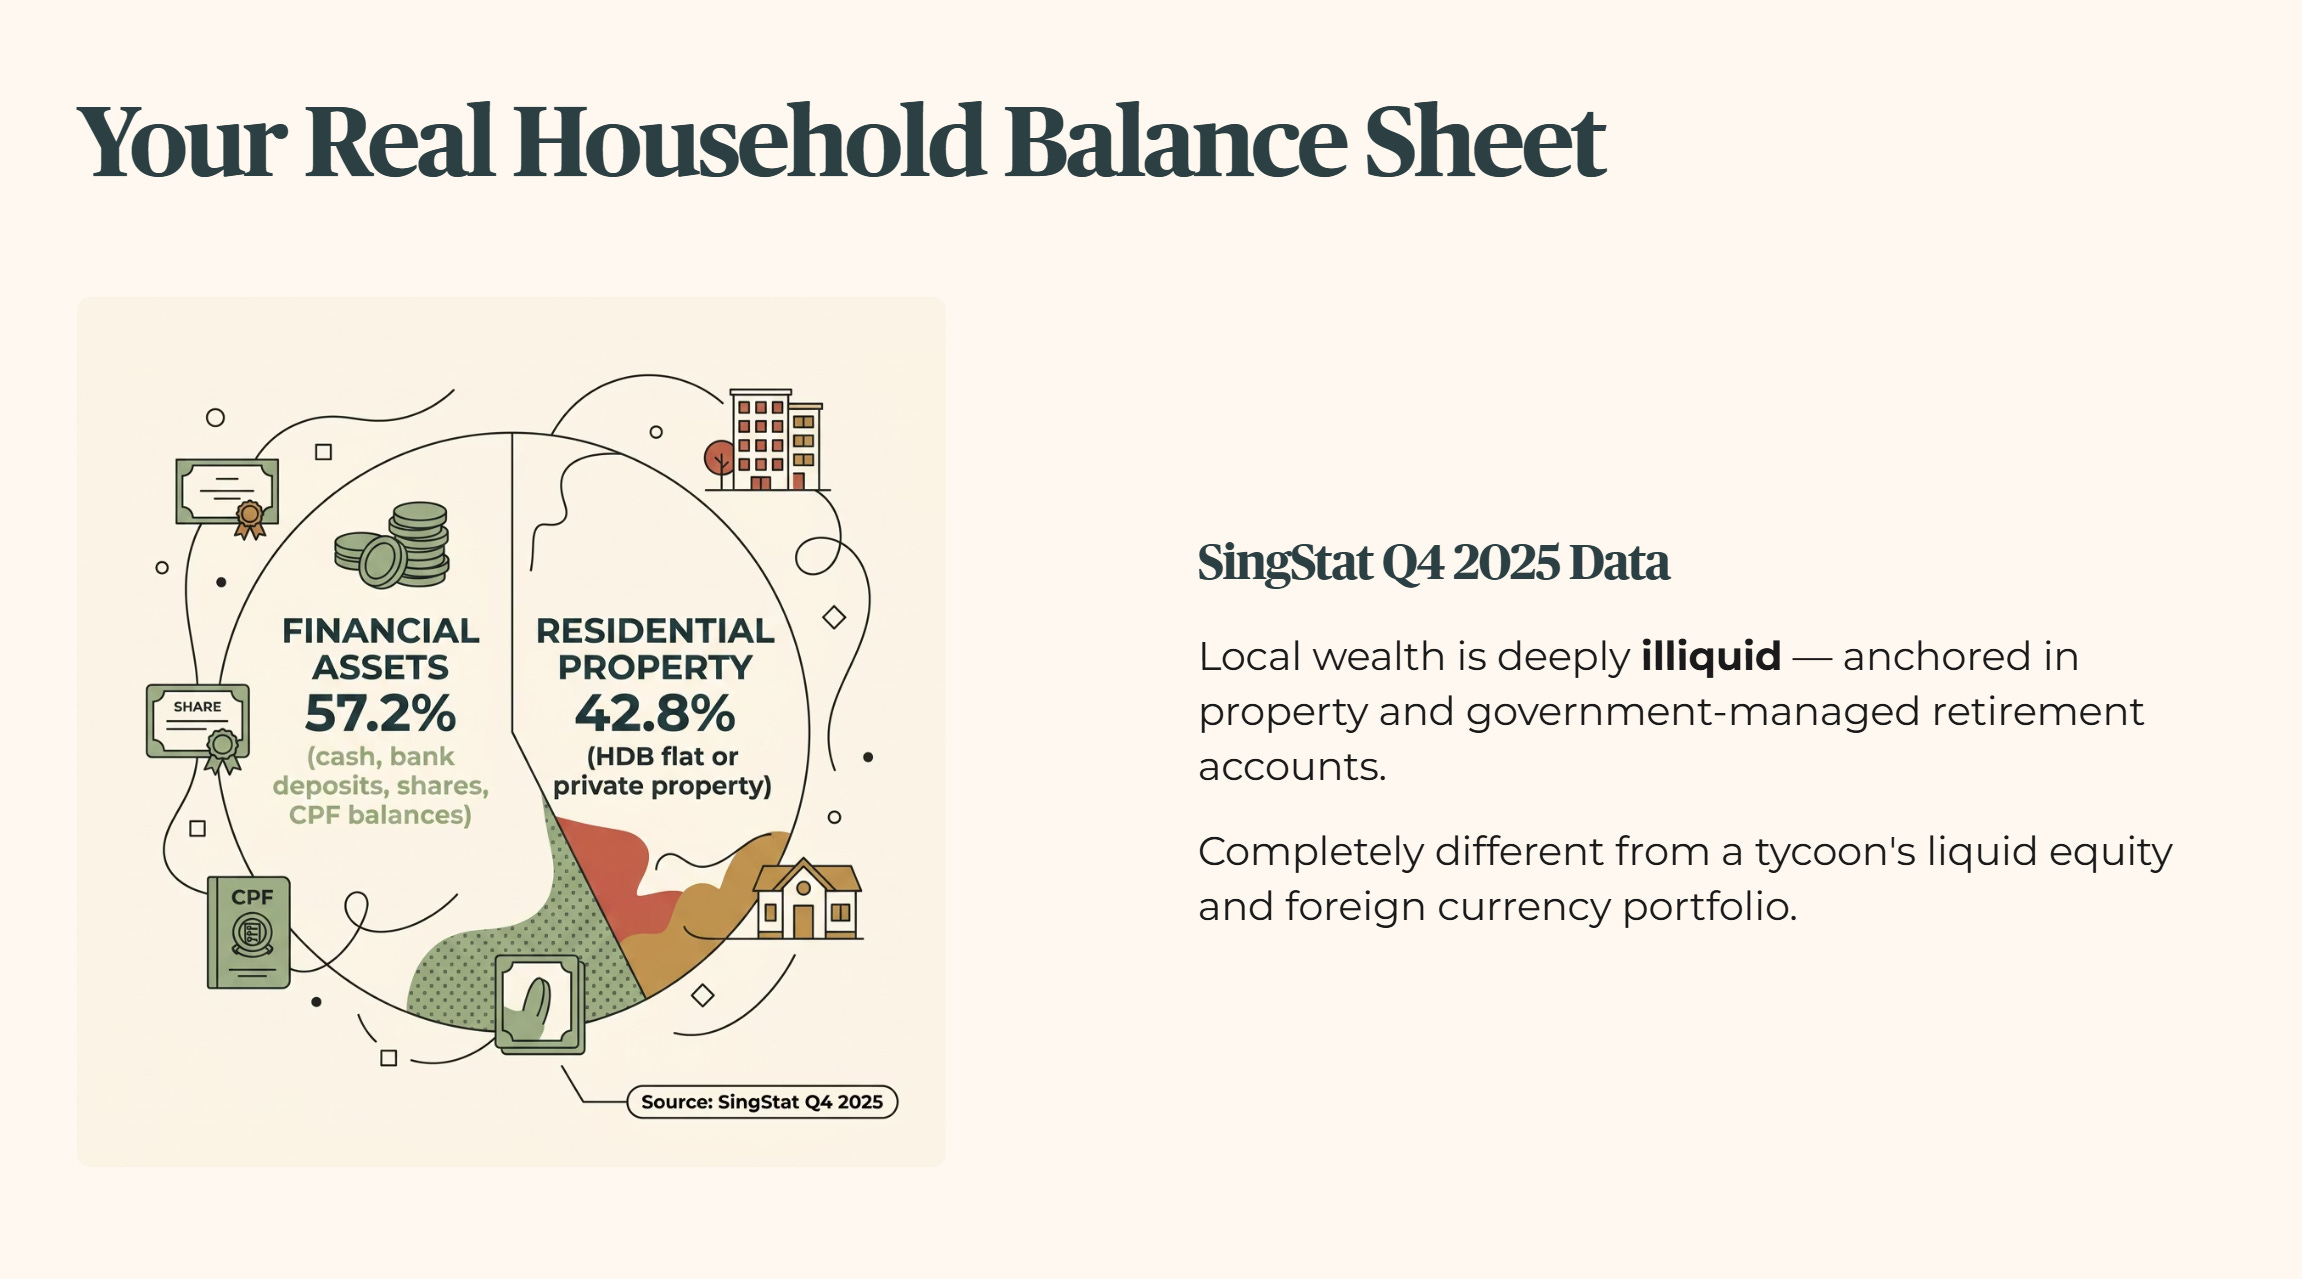
According to SingStat, local household assets are split into two main buckets: 57.2% financial assets and 42.8% residential property.
Financial assets: this includes your cash, bank deposits, shares, and crucially, your CPF balances.
Residential property: this represents the value of your HDB flat or private property.
For the vast majority of Singaporeans, wealth is deeply illiquid, anchored heavily in the roof over their heads and the government-managed retirement accounts beneath them. This structure is completely different from a wealthy tycoon whose portfolio consists of liquid equity, foreign currency, and corporate bonds.
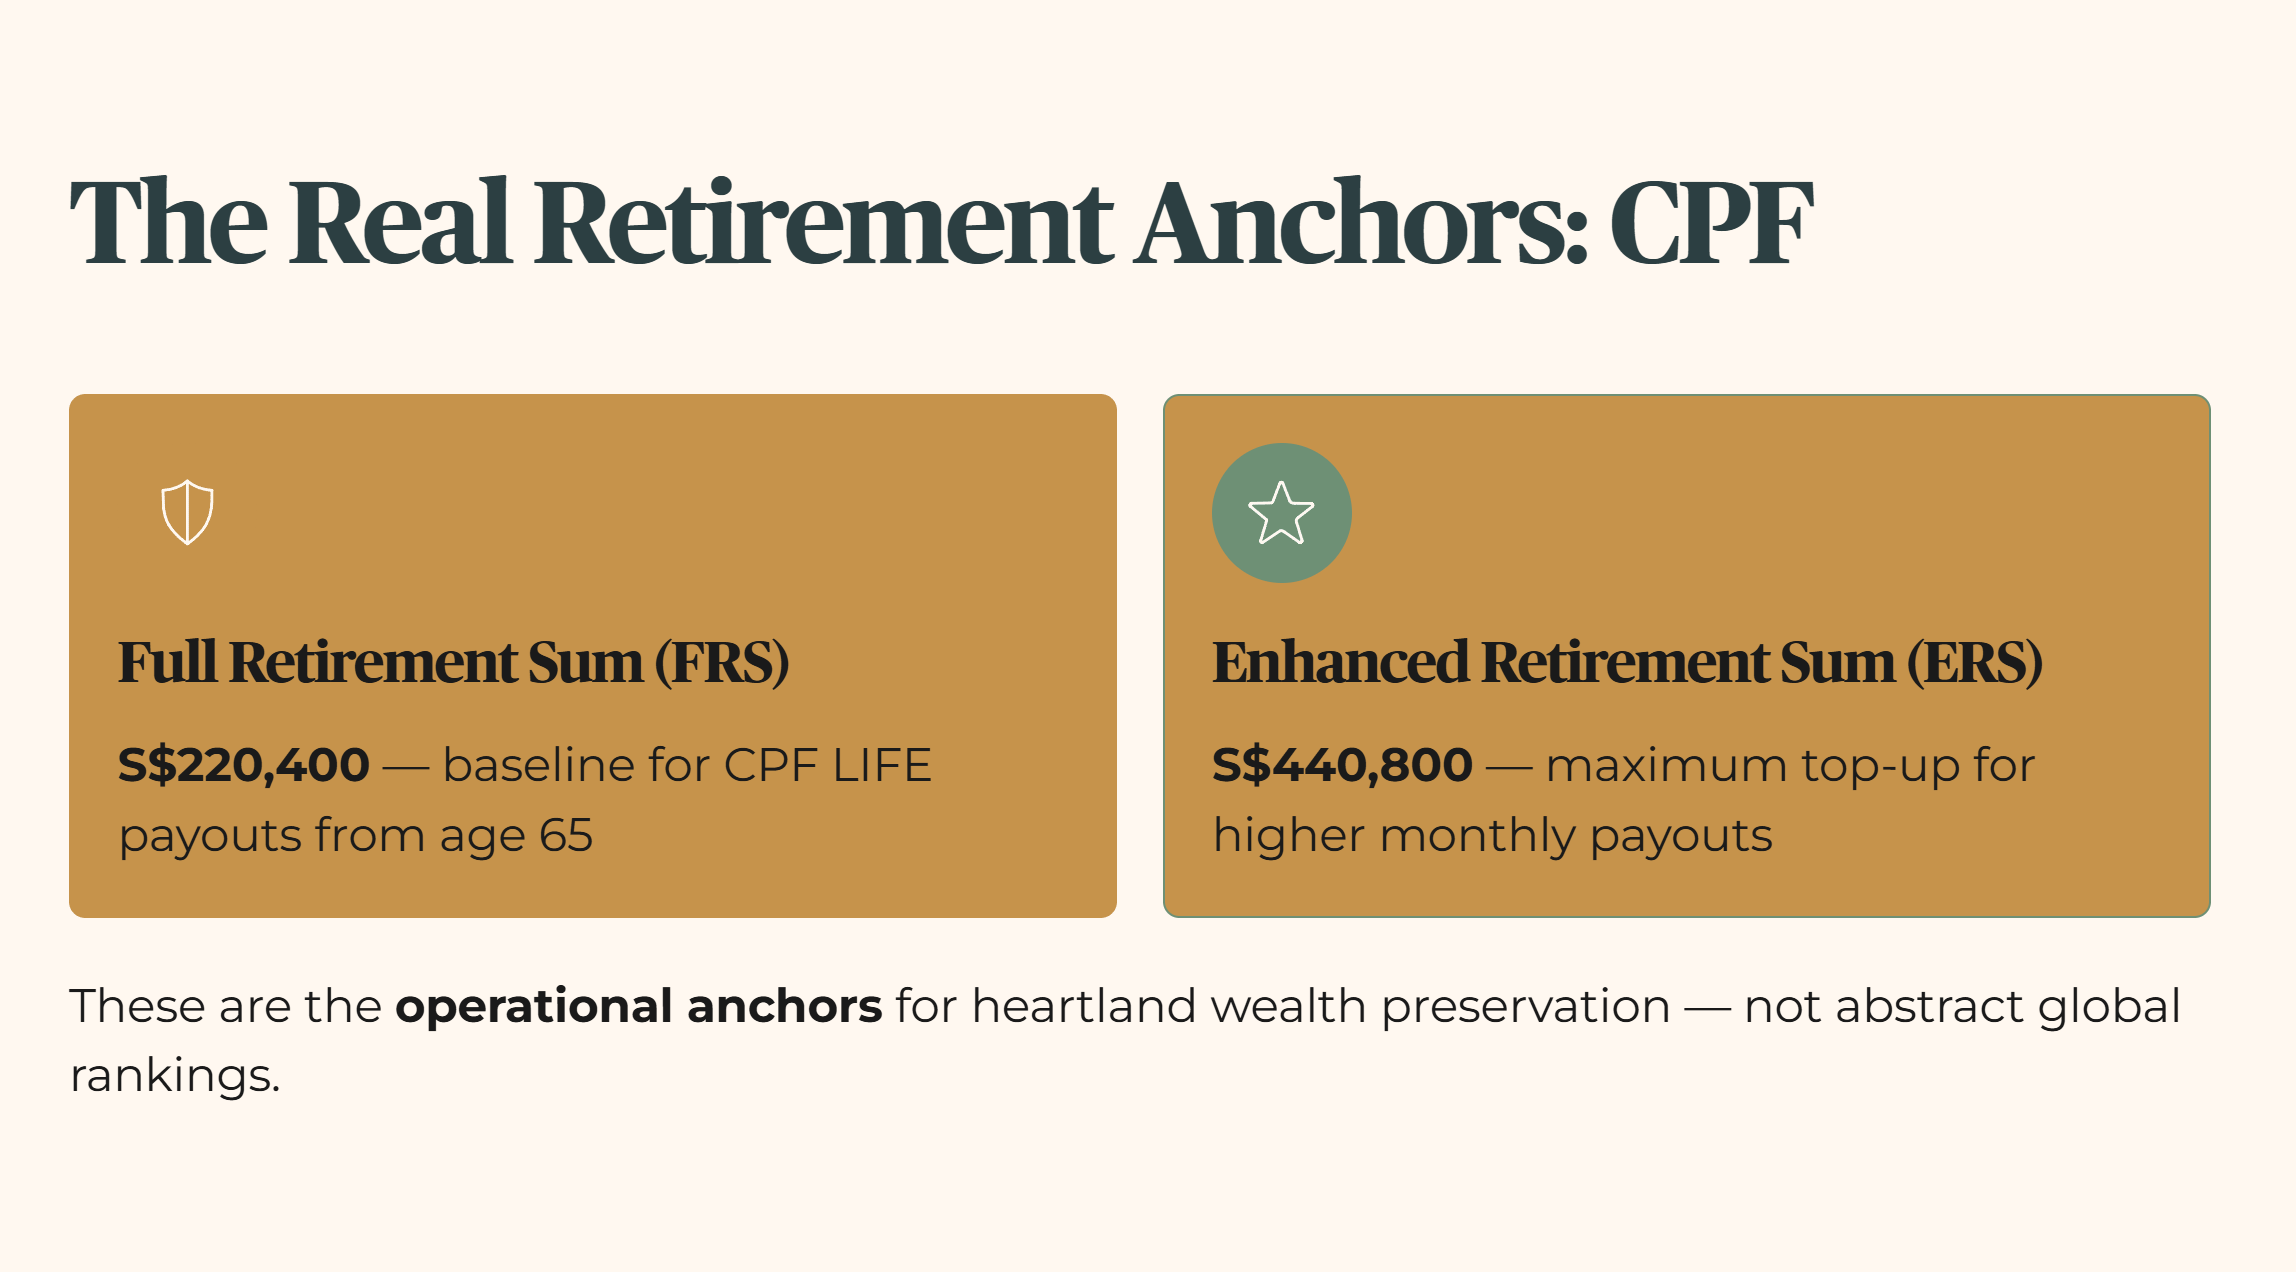
To run an honest audit on your own net worth, you should ignore global rankings and look at our native retirement yardsticks managed by the CPF Board. For the 2026 cohort, the FRS (Full Retirement Sum, the benchmark amount used to calculate baseline retirement payouts) is set at S$220,400 and the ERS (Enhanced Retirement Sum, the maximum permitted top-up level for higher monthly payouts) is set at S$440,800. These are the real operational anchors for heartland wealth preservation.
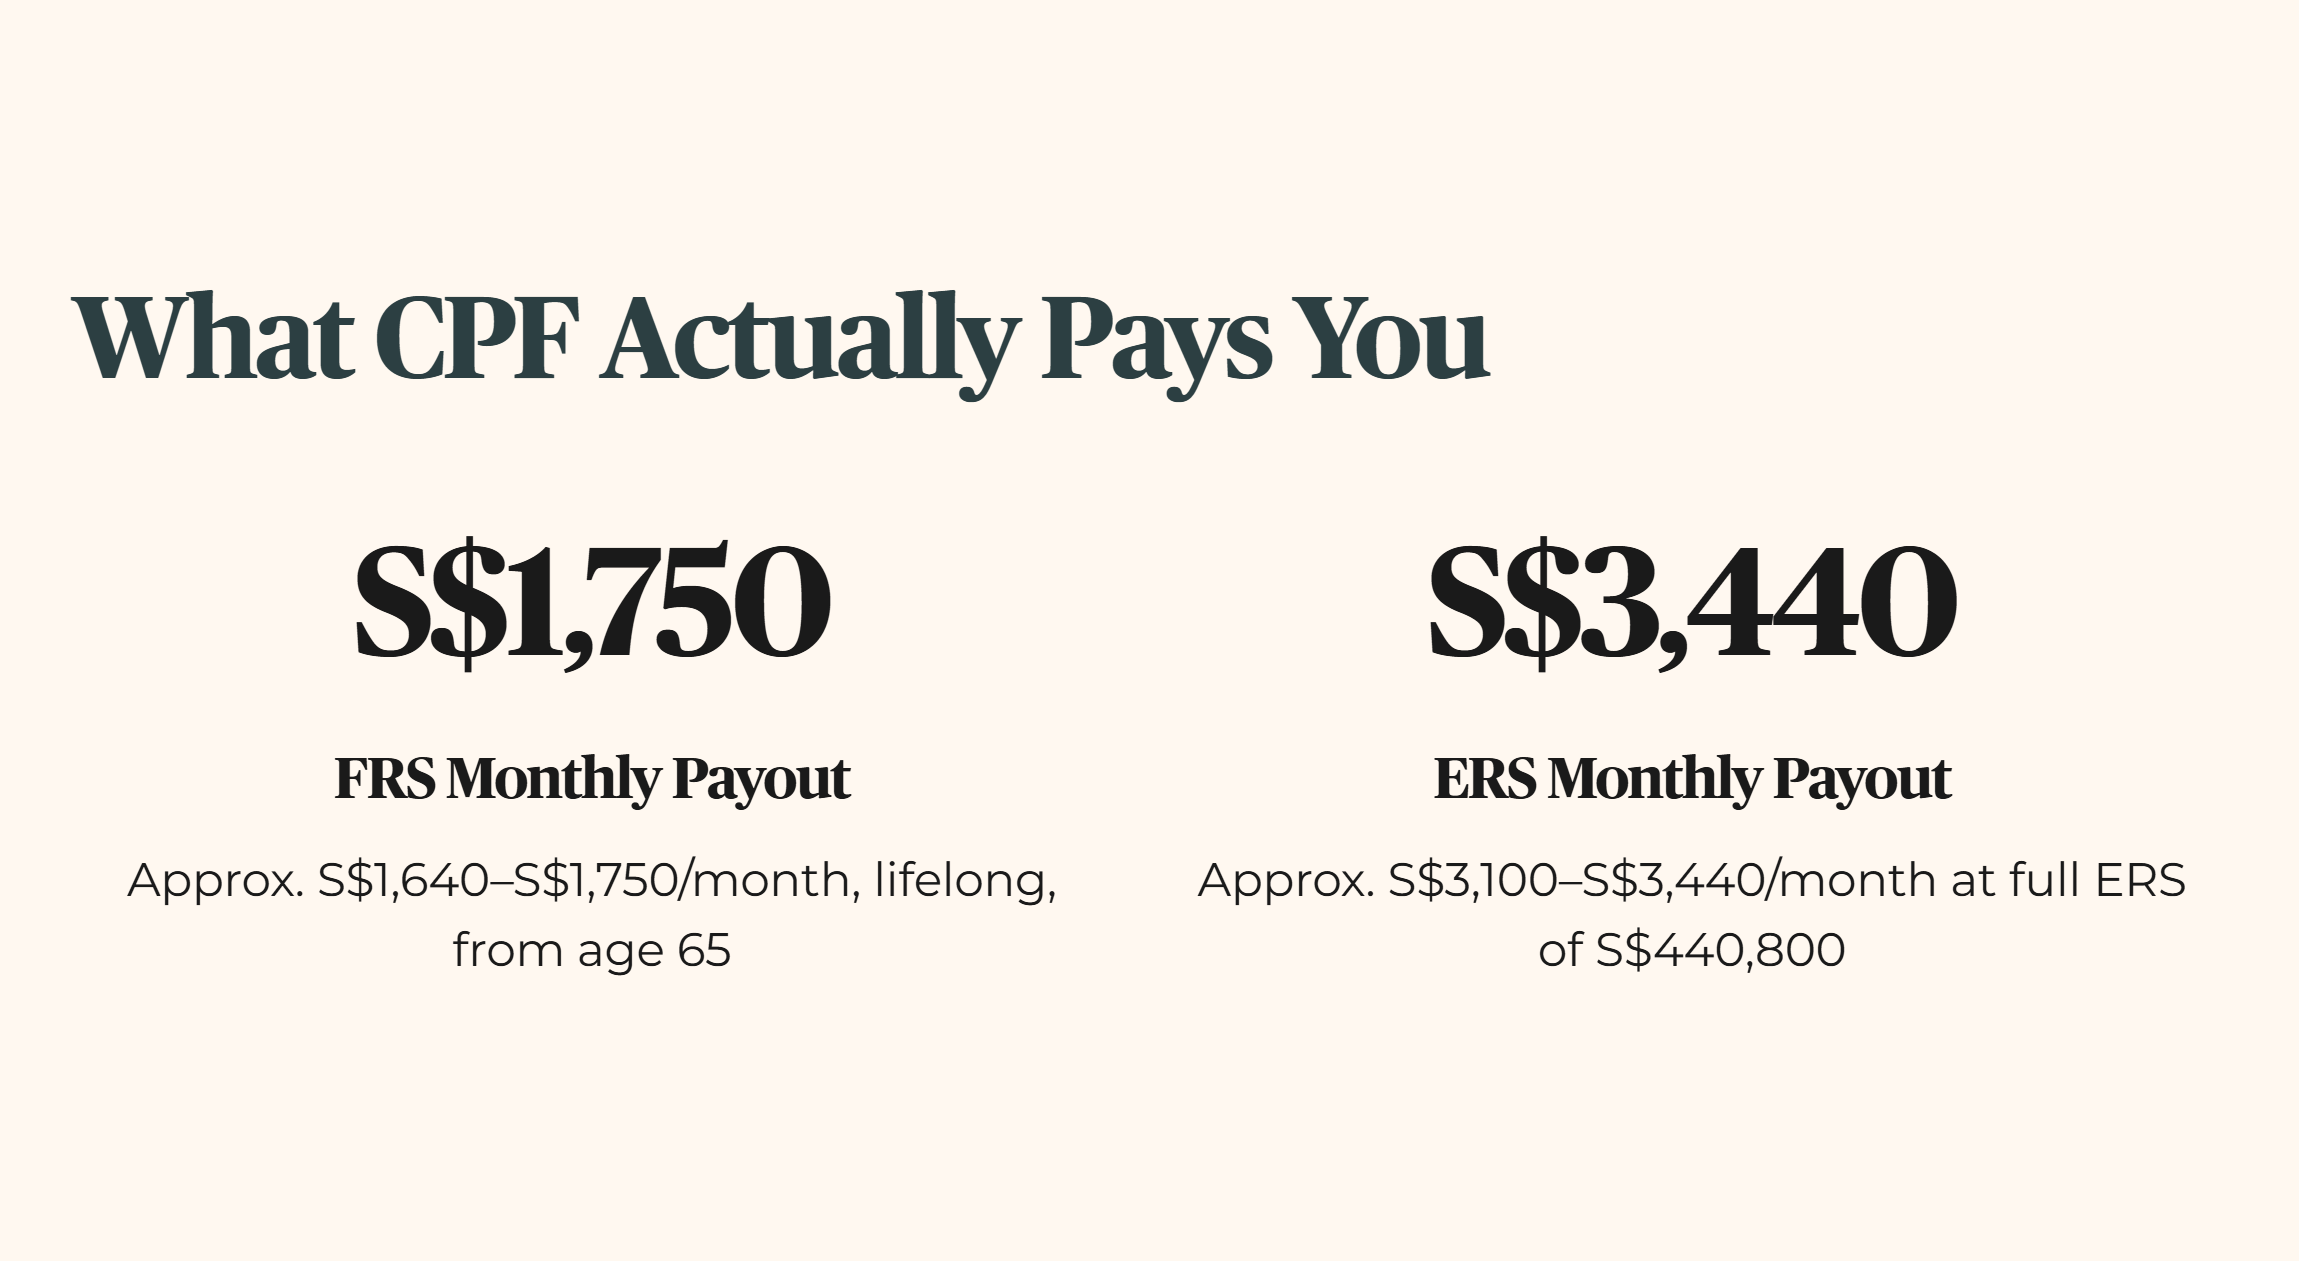
Let’s unpack what these CPF Board benchmarks actually deliver in practical terms, because this is where the paper wealth numbers convert into real-world cash flow. If a member hits the FRS of S$220,400 at age 55, this capital is set aside in their Retirement Account to fund their CPF LIFE payouts starting from age 65. Under regular cohorts, this translates to a guaranteed, lifelong monthly payout of roughly S$1,640 to S$1,750 depending on gender and the exact plan chosen. If they max out their account to the ERS level of S$440,800, that monthly lifelong payout steps up proportionally to an estimated S$3,100 to S$3,440.
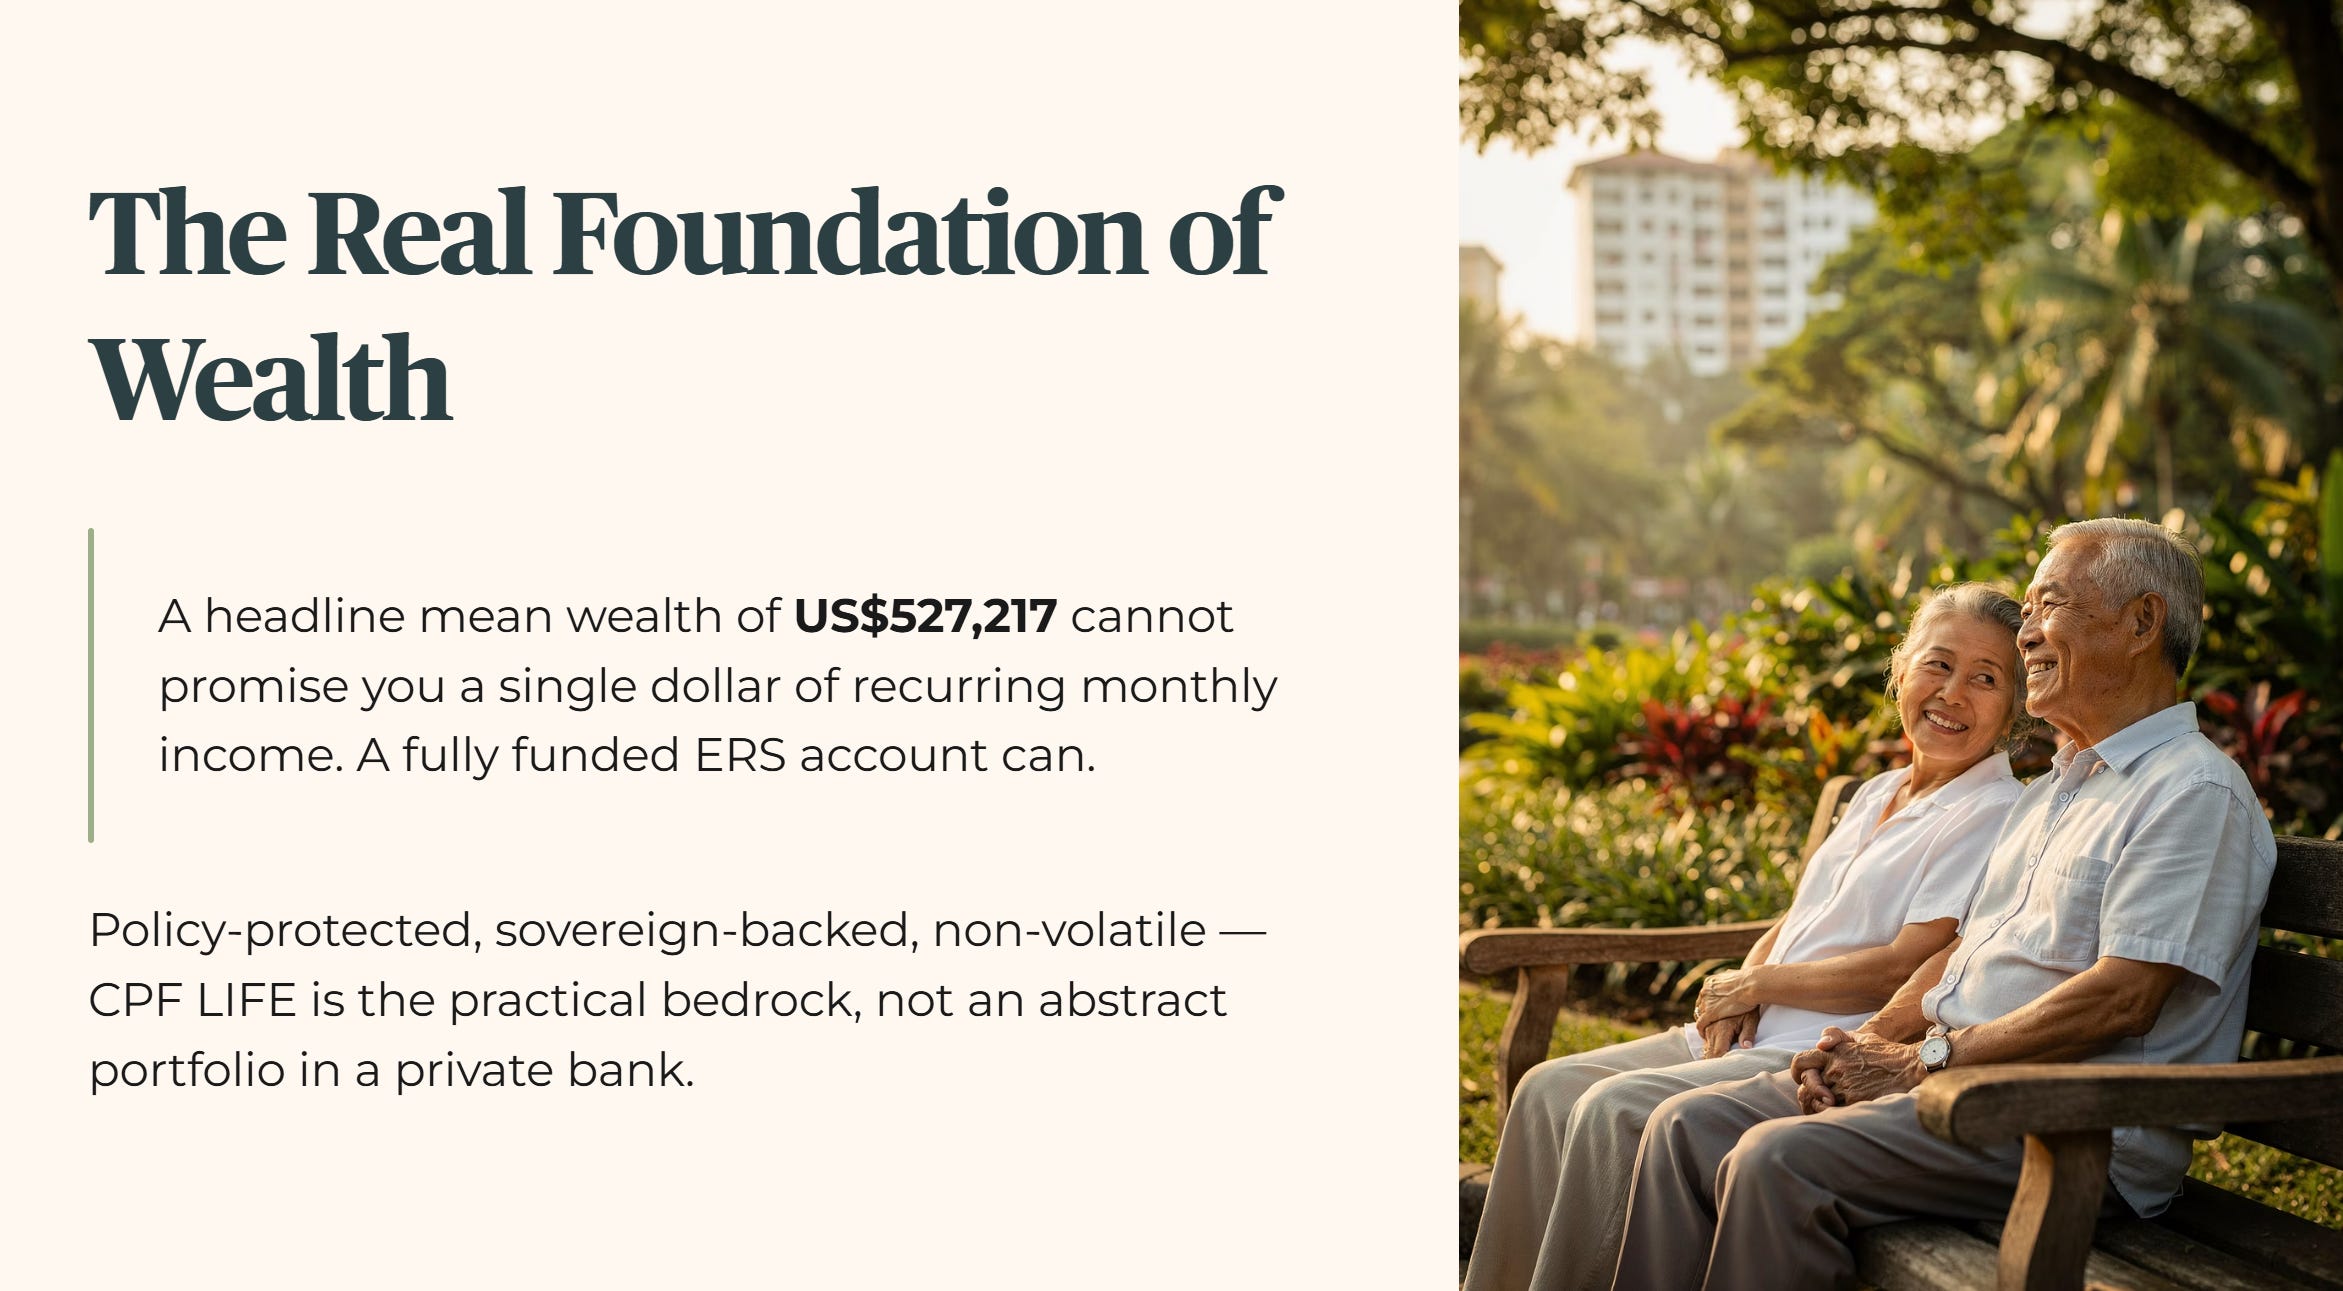
This is the real foundation of Singaporean wealth. It is not an abstract portfolio floating in a private bank; it is a highly structured, policy-protected income stream. When you compare a guaranteed monthly payout backed by the sovereign balance sheet against a volatile global ranking average, the practical utility becomes clear. A headline mean wealth of half a million US dollars cannot promise you a single dollar of recurring monthly sustenance. A fully funded ERS account can.
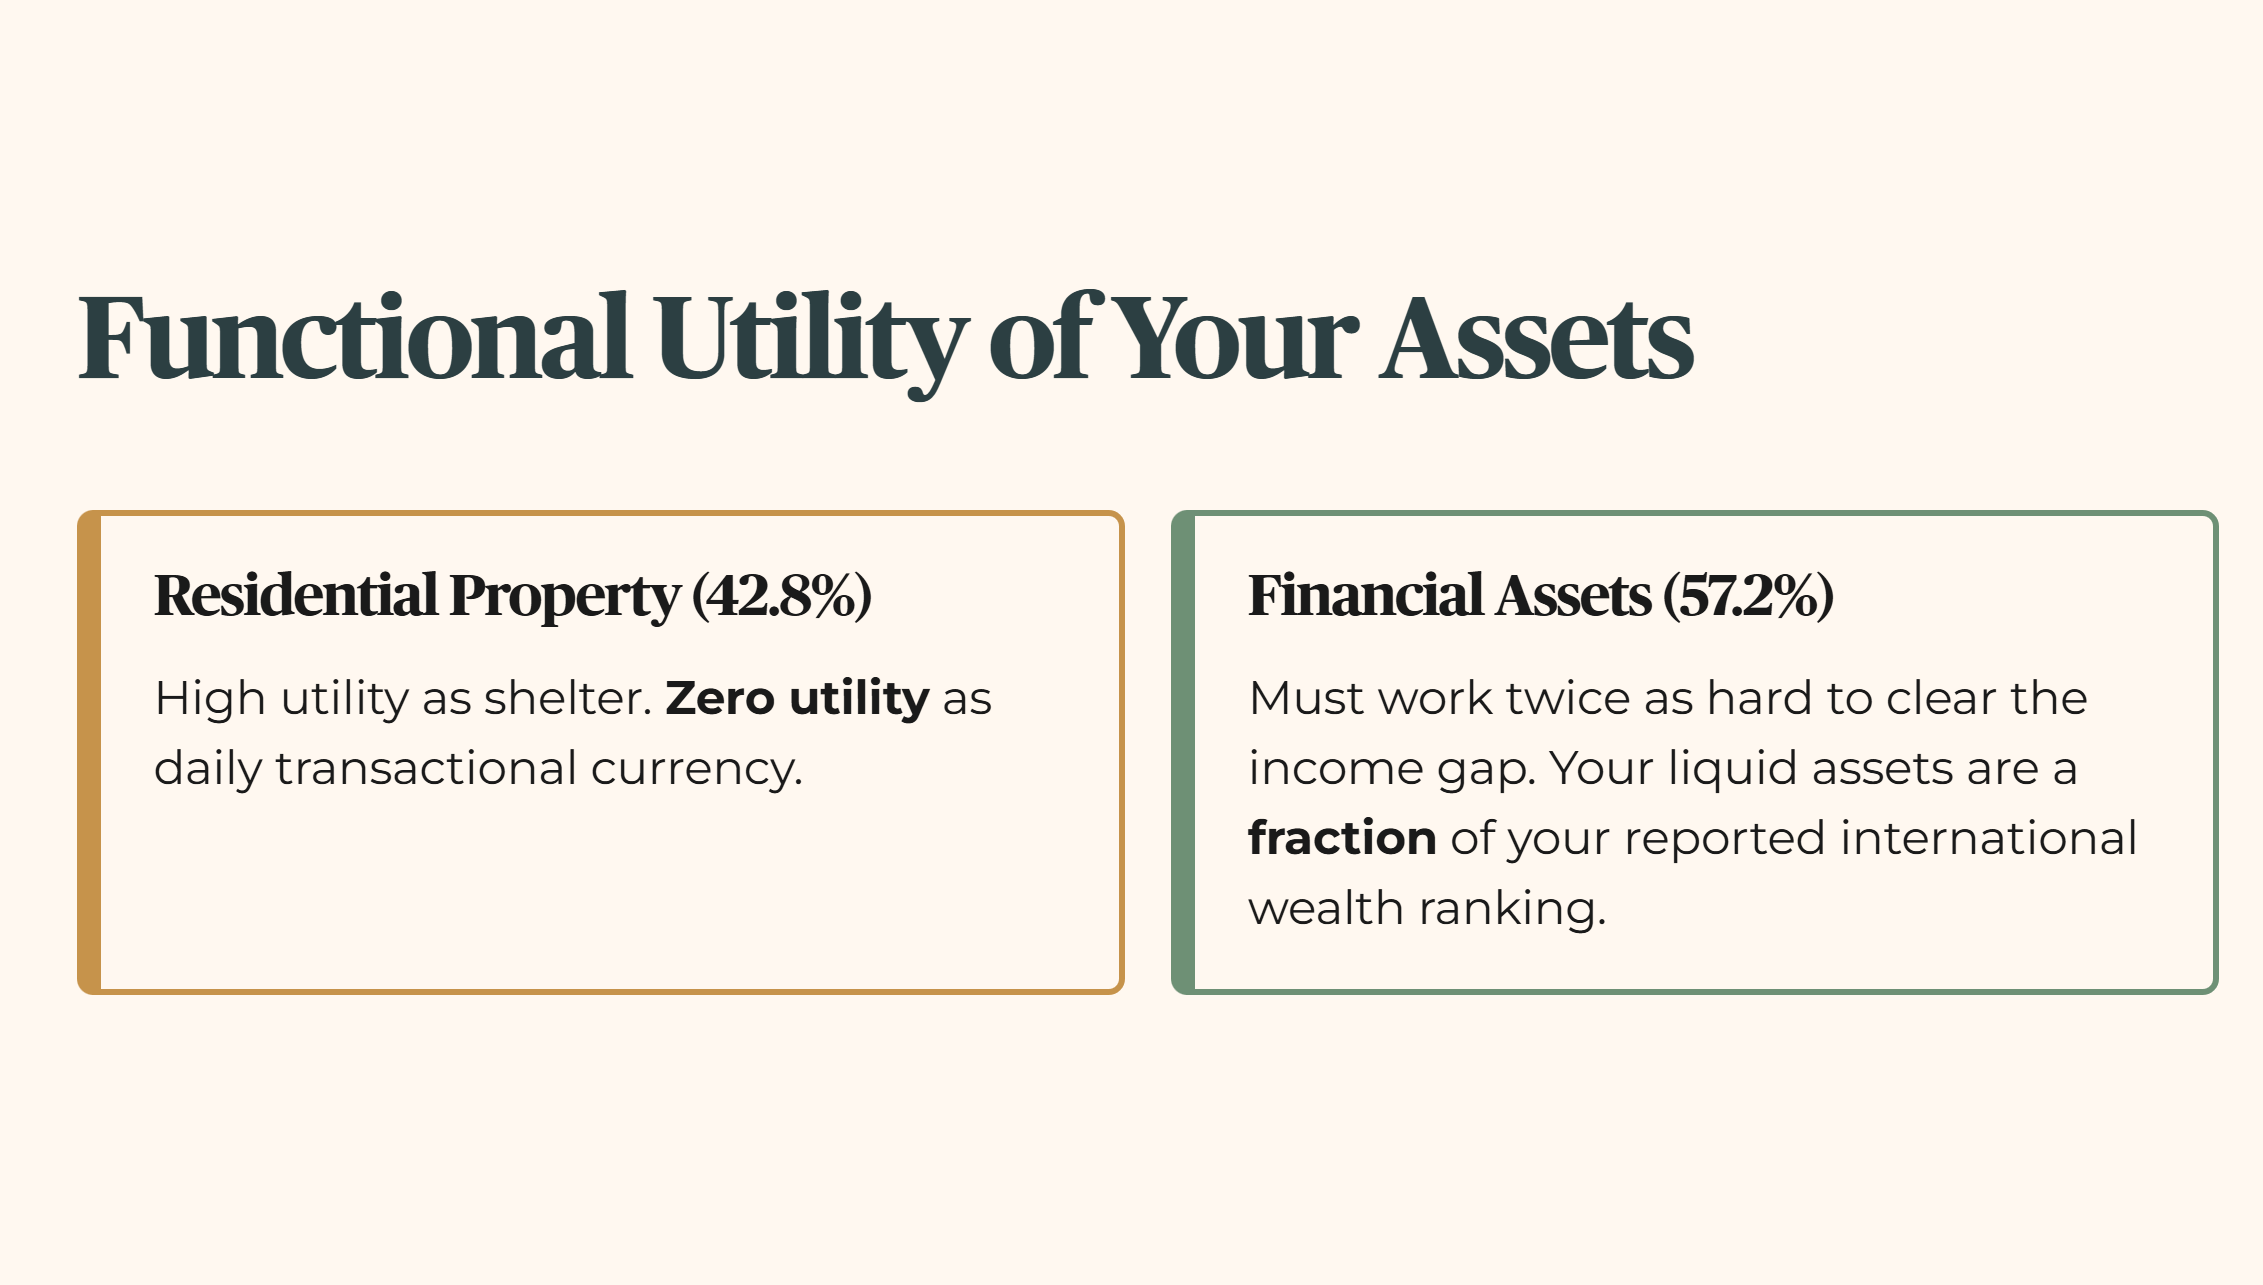
This asset allocation reality means that when you evaluate your net worth, you must separate your assets by their functional utility. Your residential property, representing more than forty percent of the typical household balance sheet, provides high utility as a shelter but zero utility as a daily transactional currency. Your financial assets must therefore work twice as hard to clear the income gap. For an individual holding core retirement capital, understanding that your liquid financial assets represent only a fraction of your reported international wealth ranking is the first step toward true data literacy.
🦎 Iggy’s Insight
Having 42.8% of household wealth tied up in residential property is a double-edged sword for retirees. On one hand, it represents a stable, safe asset class that has grown alongside Singapore’s economy. On the other hand, you cannot buy your groceries with brick and mortar. Unless you plan to downsize, lease buyback, or sublet, that property wealth remains structurally locked away from your daily retirement cash flow. Real wealth in retirement isn’t about what your property is worth on paper. It is about the monthly yield your liquid assets can generate.
The Wallet Impact: Choosing the Honest Yardstick
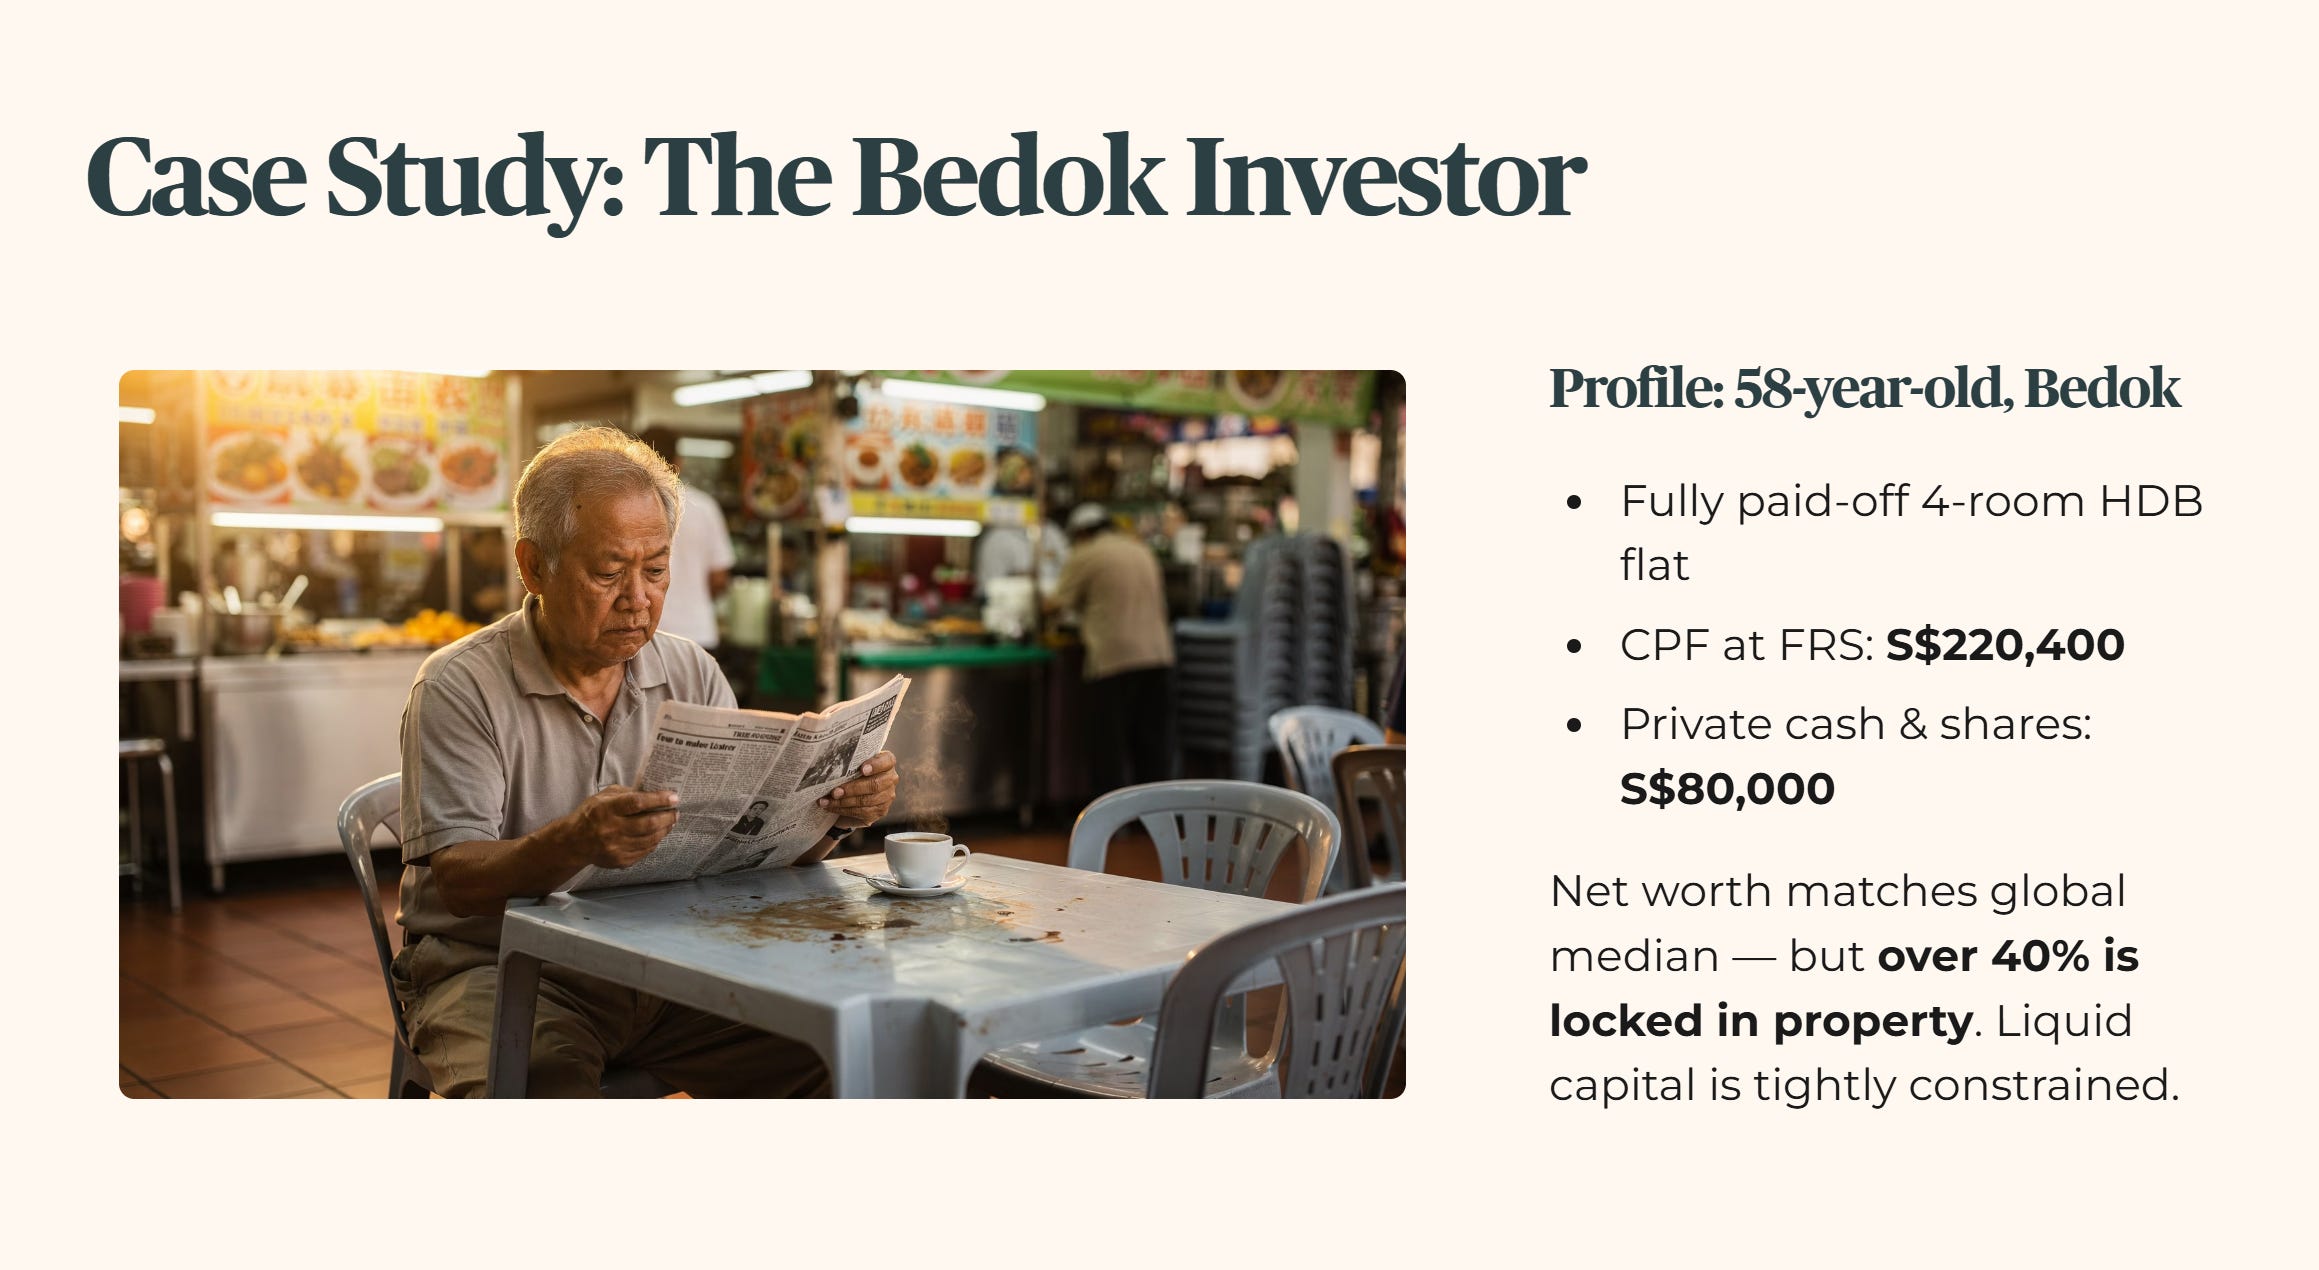
Let’s look at the real-world impact of this wealth gap through the lens of a 58-year-old retail investor, Simon, living in Bedok. Simon reads the financial news, sees Singapore celebrated as the sixth wealthiest nation on Earth, and looks at his own account. He has fully paid off his 4-room HDB flat, has S$220,400 inside his CPF accounts to hit the Full Retirement Sum, and holds roughly S$80,000 in cash and local shares.
On paper, Simon’s total net worth matches or slightly exceeds the global median of US$96,434 (approximately S$130,000) when his property equity is factored in. But because more than forty percent of a typical local net worth is locked in property, his immediate liquid capital available for private investment is tightly constrained. If he attempts to lifestyle-match the global “average” Singaporean, he will rapidly exhaust his liquidity and fall into a dangerous cash crunch.
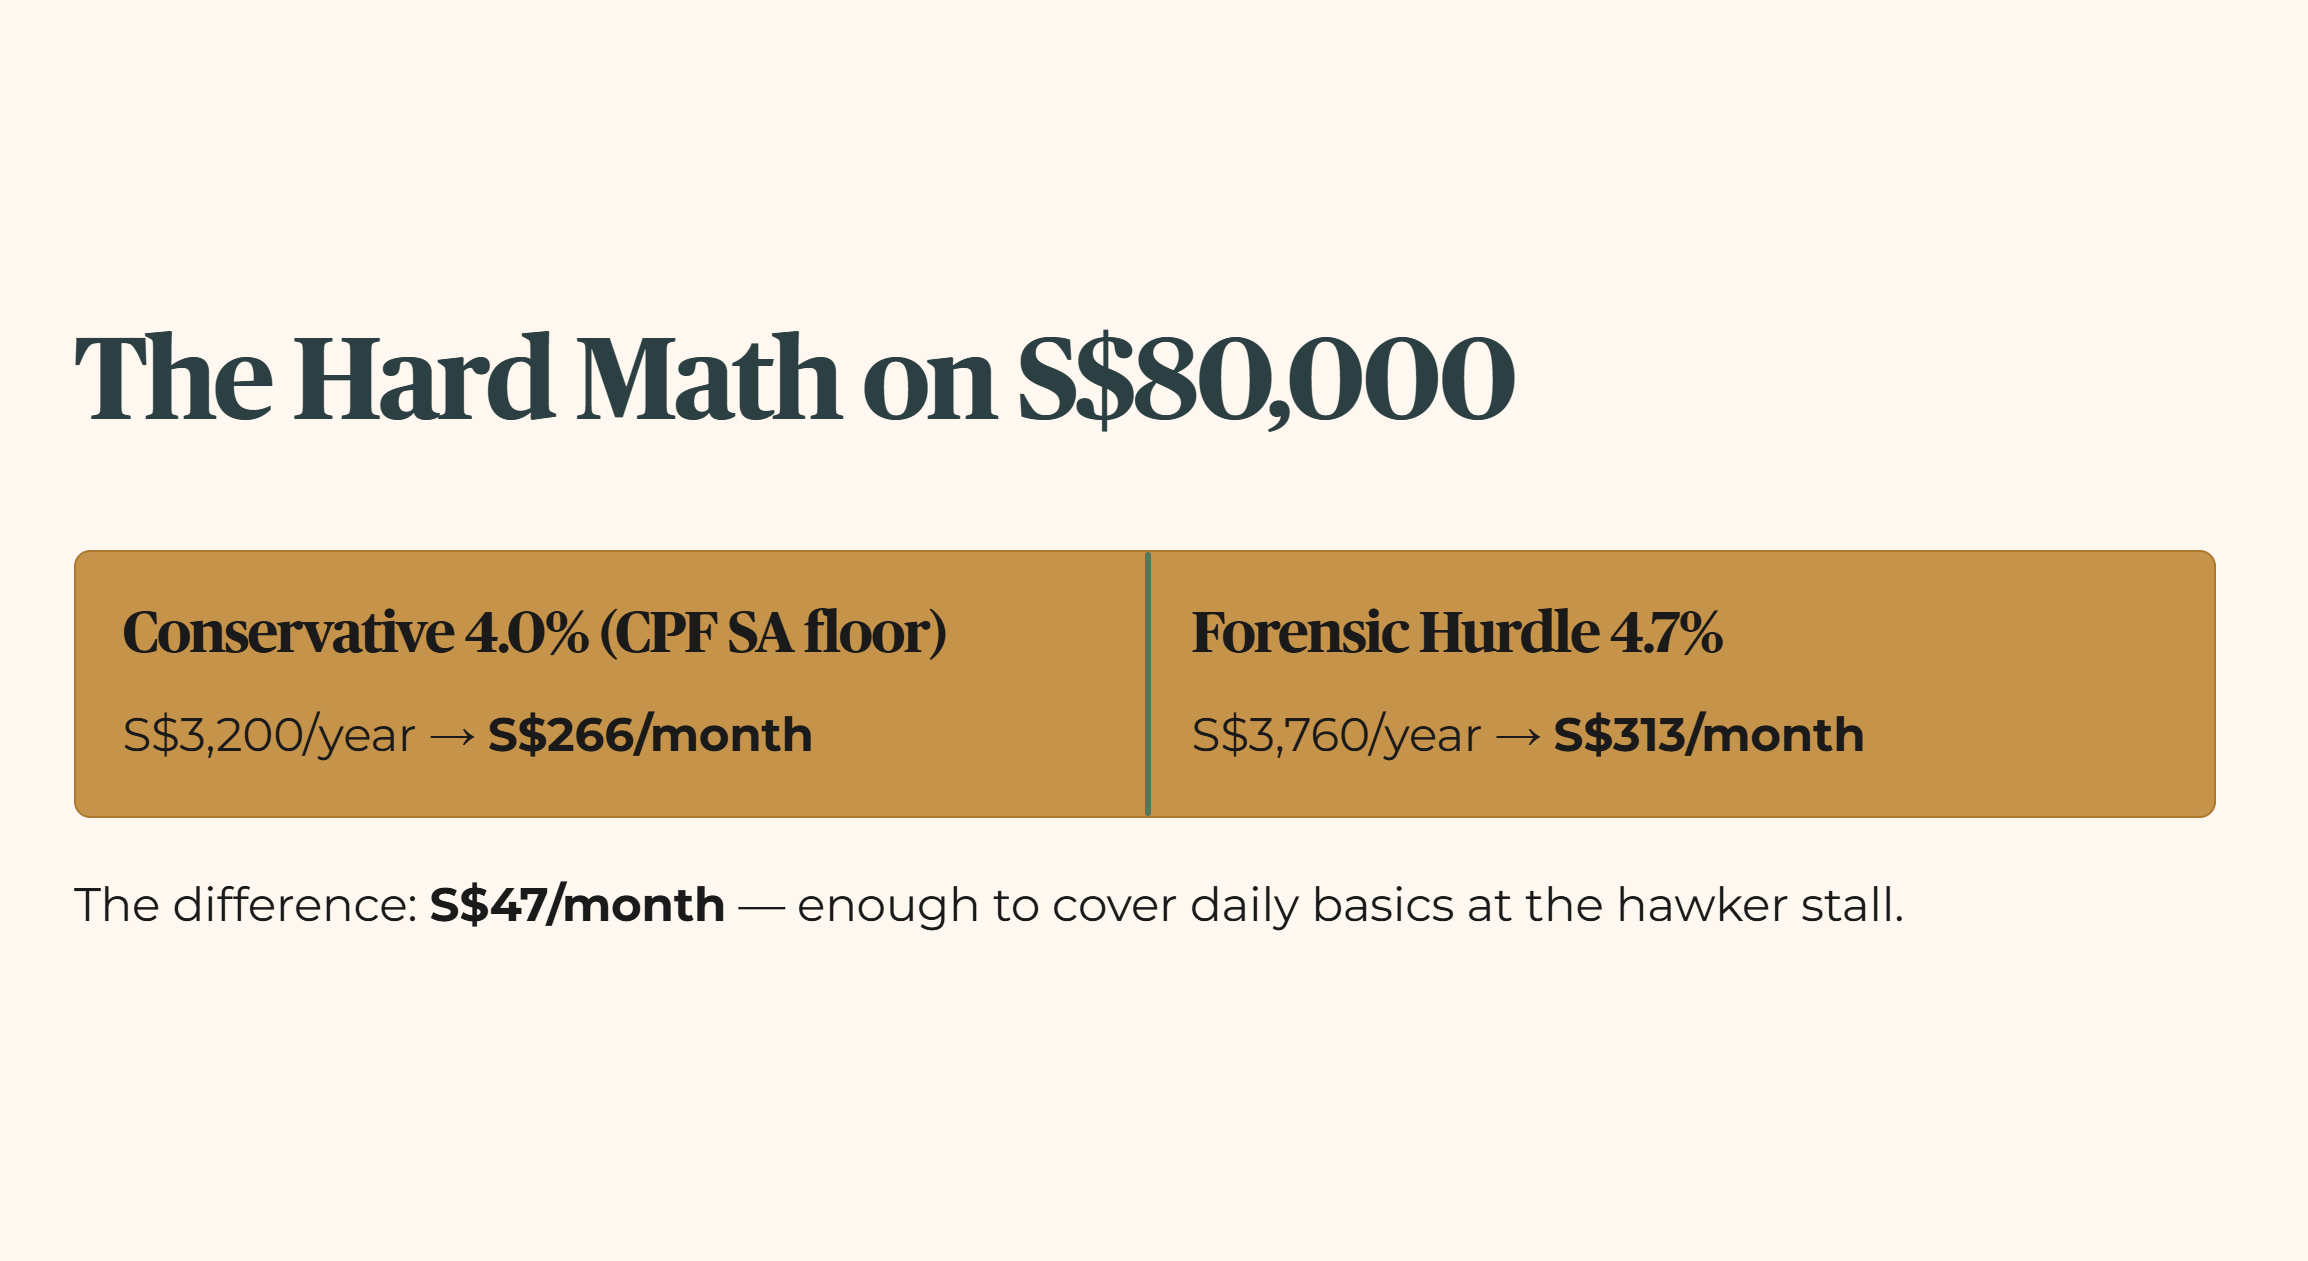
Let’s do the hard math on his S$80,000 private cash and equity buffer to see exactly what it can generate. If he deploys that S$80,000 into a standard retail account, he faces a choice of strategies. If he leaves it in a conservative cash sanctuary or a standard government instrument matching the CPF SA floor of 4.0%, that S$80,000 yields exactly S$3,200 per year. Broken down to a monthly timeline, that is just S$266.
The forensic tension appears when his private yield clears the 4.7% hurdle, because the next step is to stack that S$313 against his projected CPF LIFE payout and test whether a combined S$2,000-plus monthly income actually passes a retirement stress test.
