

Singapore REITs Just Got a Tailwind Nobody's Talking About, A Forensic Scorecard
Eight major SGX retail REITs, ranked by gearing and coverage, the surprising winners, and the one name carrying a real red flag.

The retail investing crowd has spent the last two years bracing for a catastrophic real estate debt cliff, but the primary filings show that the exact opposite is happening for conservative balance sheets. Sector borrowing benchmarks have quietly cratered to cycle lows, turning a widely feared threat into an earnings tailwind for the right operators. If you are holding Singapore real estate investment trusts for retirement income, here is exactly how the refinancing wall just became a myth.
If you are chasing growth and momentum, a higher-risk profile may clear your hurdle. But if you are a retiree focused on wealth preservation and dependable drawdown income, my forensic standard is built to protect that. I went looking into the latest quarterly filings to audit the damage from the feared interest rate wall. Instead, the numbers revealed a major refinancing tailwind that is about to catch the market completely off guard.


The Macro Reframe: Refinancing Tailwind, Not Cliff
The Forensic Gearing Scorecard
The Honest Watch List
Macro Forensic Scorecard
The Window Is Already Open
The Yield Hurdle Spread Monitor
What This Means For Your Income Plan
The Bottom Line
The Macro Reframe: Refinancing Tailwind, Not Cliff
The market consensus is clear, and it is completely wrong. For twenty-four months, analysts warned that Singapore REITs, real estate investment trusts, publicly traded portfolios of property assets, would see their distributions decimated when cheap pandemic-era loans matured and had to be rolled over at higher rates. But the ground has shifted beneath us in 2026.
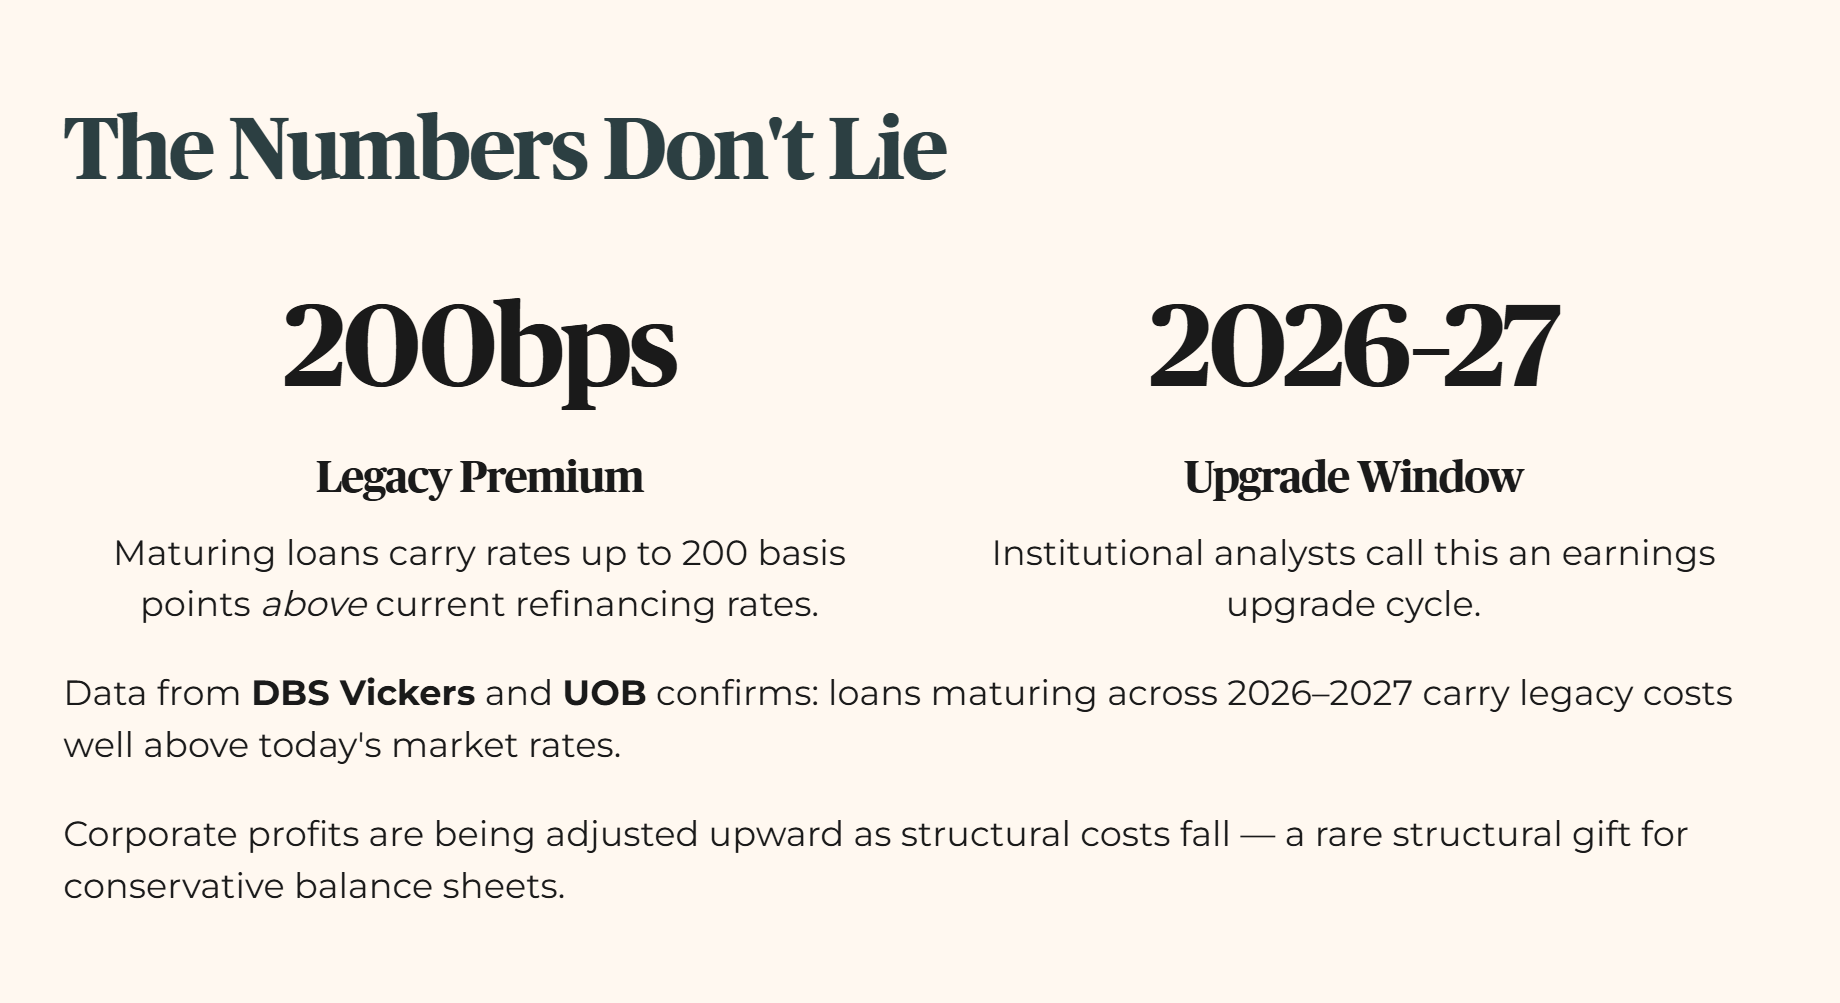
Data from third-party sector coverage, including DBS Vickers and UOB, indicates that loans maturing across the 2026 to 2027 window are actually carrying legacy borrowing costs that sit up to 200 basis points, two full percentage points, above current market refinancing rates. The commercial property sector is entering what institutional analysts call an earnings upgrade cycle, a period where corporate profits are adjusted upward due to falling structural costs.
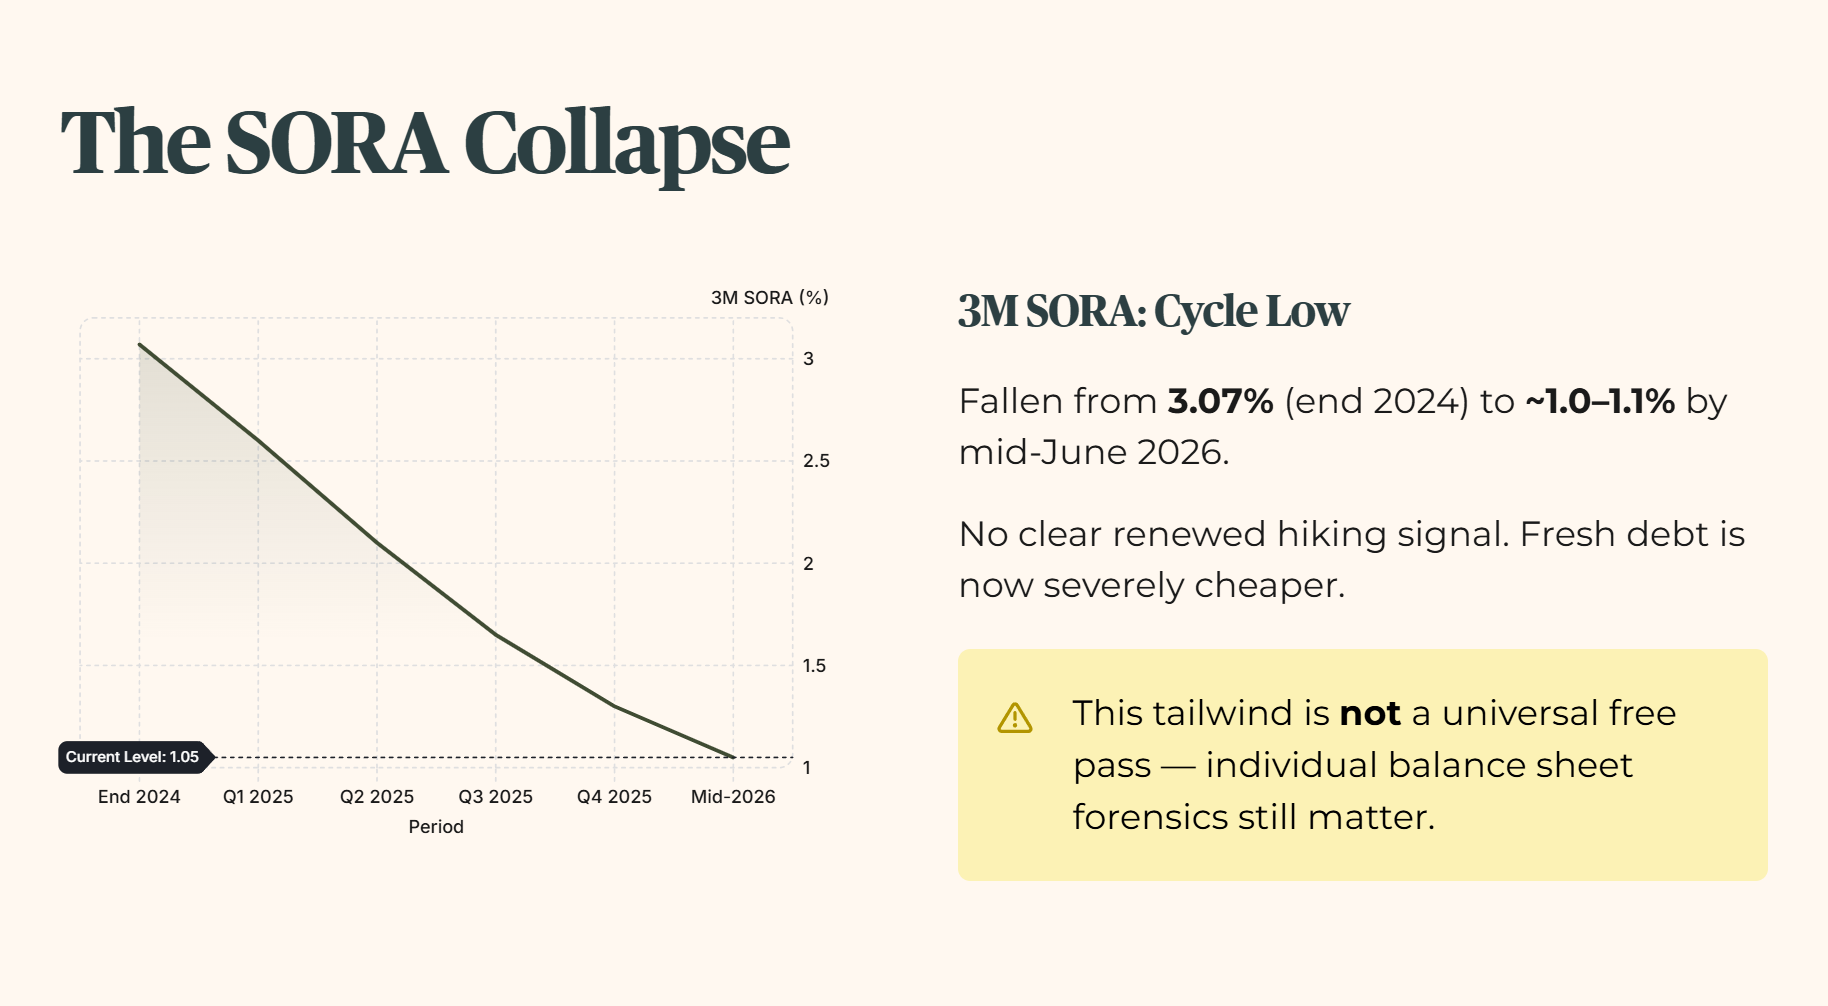
The primary driver is the collapse of the 3M SORA, three-month Singapore Overnight Rate Average, the volume-weighted average rate of borrow transactions in the domestic interbank market. The 3M SORA has fallen from 3.07 percent at the end of 2024 to roughly 1.0 to 1.1 percent as of mid-June 2026, sitting near cycle lows with no clear renewed hiking signal, severely easing the price of fresh debt.
Let’s be honest about the nuances, because this tailwind is not a universal free pass. REITs that concentrated their maturities too heavily in the wrong years or let their operational coverage decay still face severe execution risk. This is where individual balance sheet forensics separate the sanctuary assets from the structural traps.
🦎 Iggy’s Insight
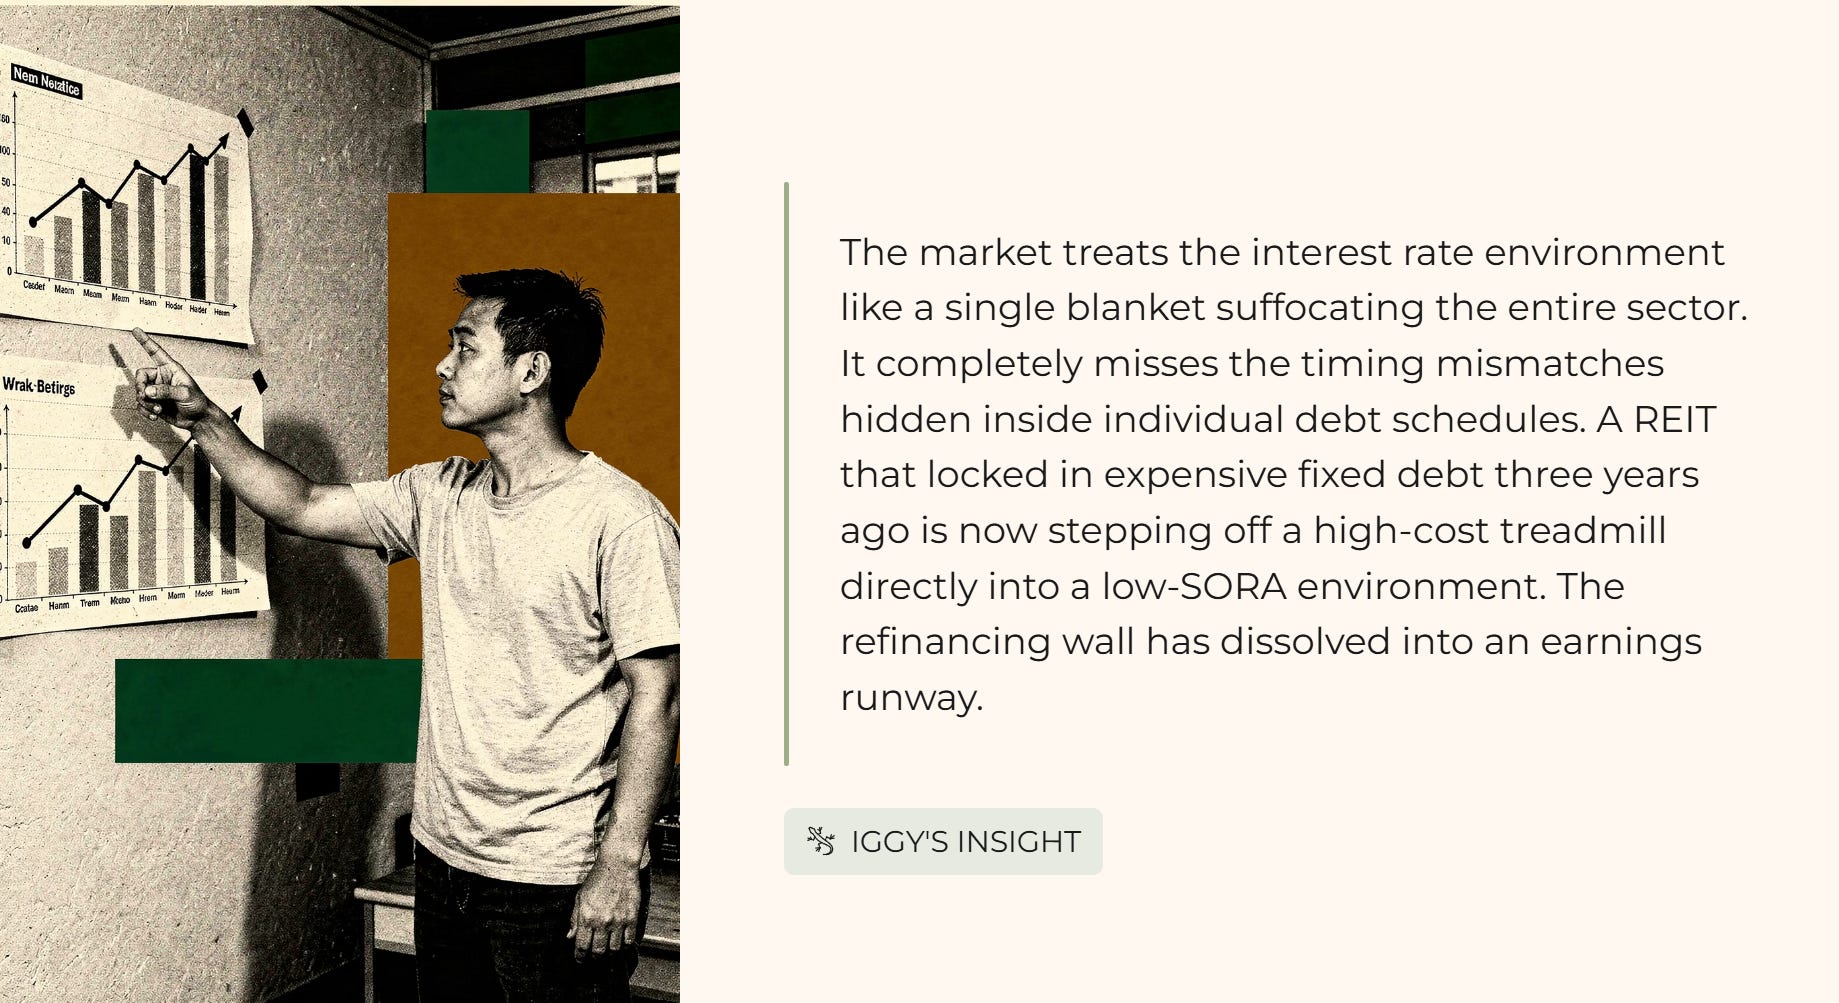
The market treats the interest rate environment like a single blanket suffocating the entire sector. It completely misses the timing mismatches hidden inside individual debt schedules. A REIT that locked in expensive fixed debt three years ago is now stepping off a high-cost treadmill directly into a low-SORA environment. This is not a debt cliff. It is an operational cost-cutting event that prints cash directly into the distribution pool. The crowd is still trading yesteryear’s panic while the smart money is tracking today’s filings. The refinancing wall has dissolved into an earnings runway.
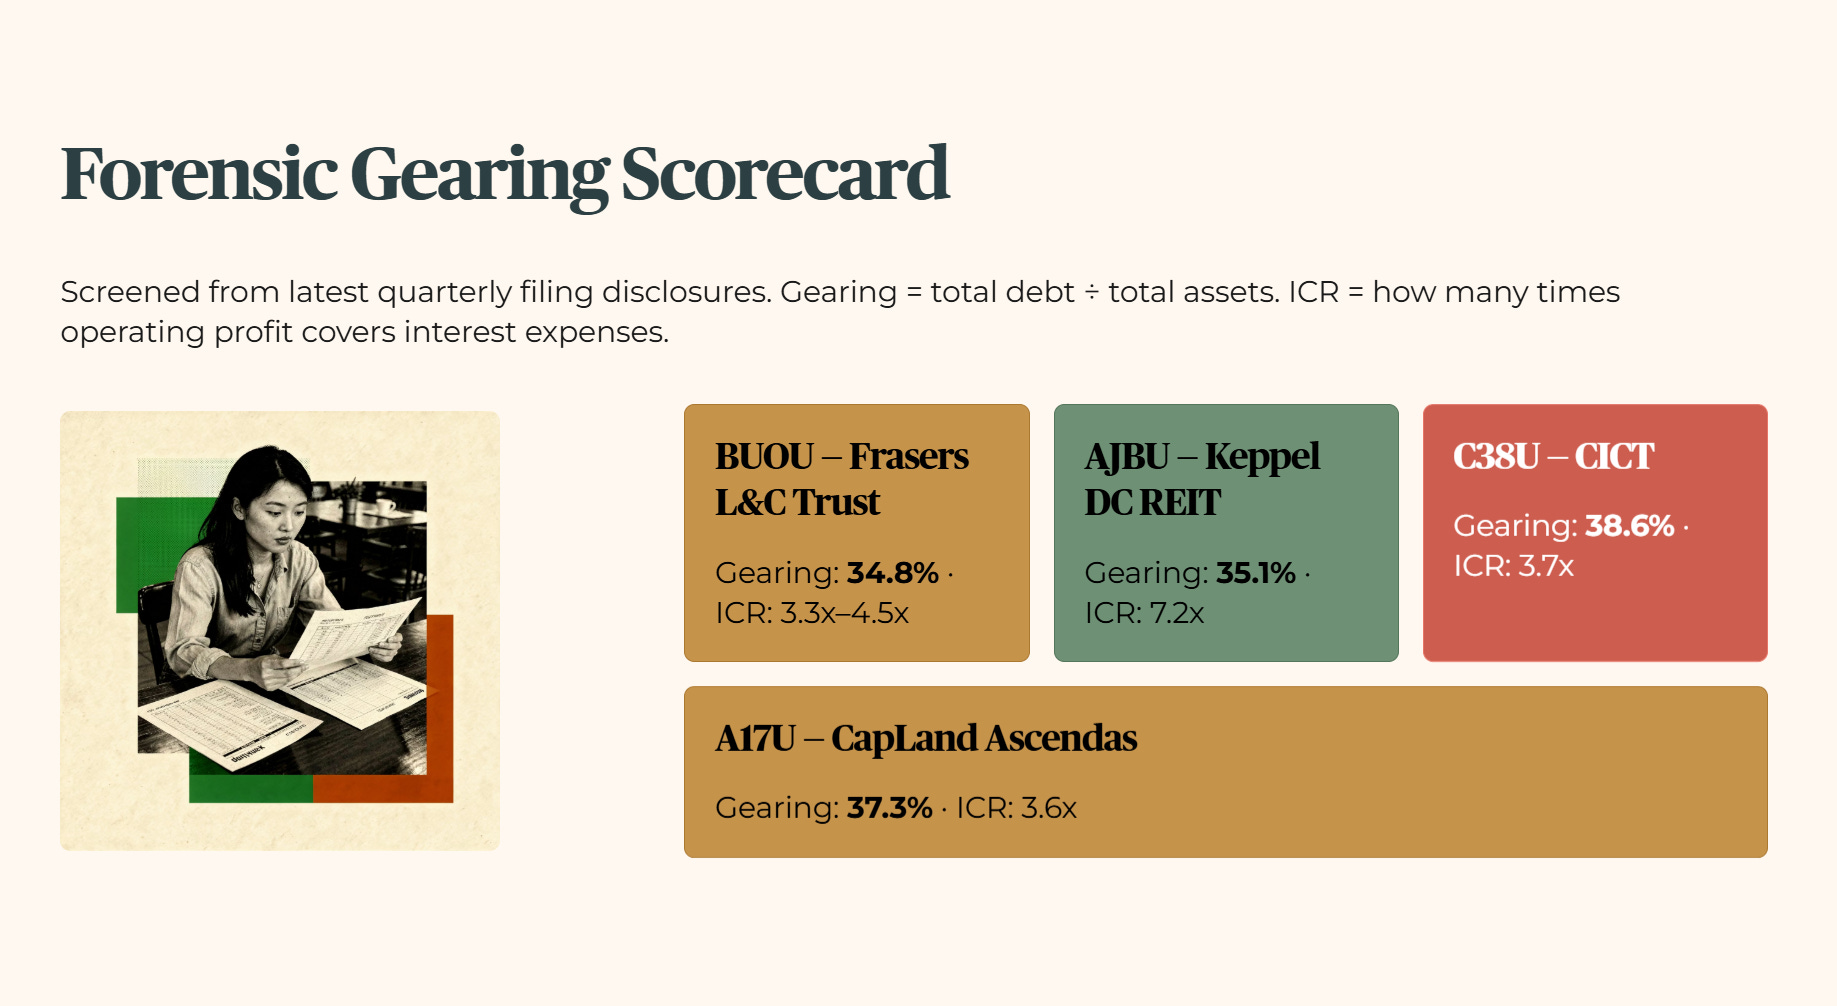
The Forensic Gearing Scorecard
To see who stands to capture this structural windfall, we have to look directly at the leverage profiles of the major retail operators. I have screened the core names based on their latest filing disclosures.
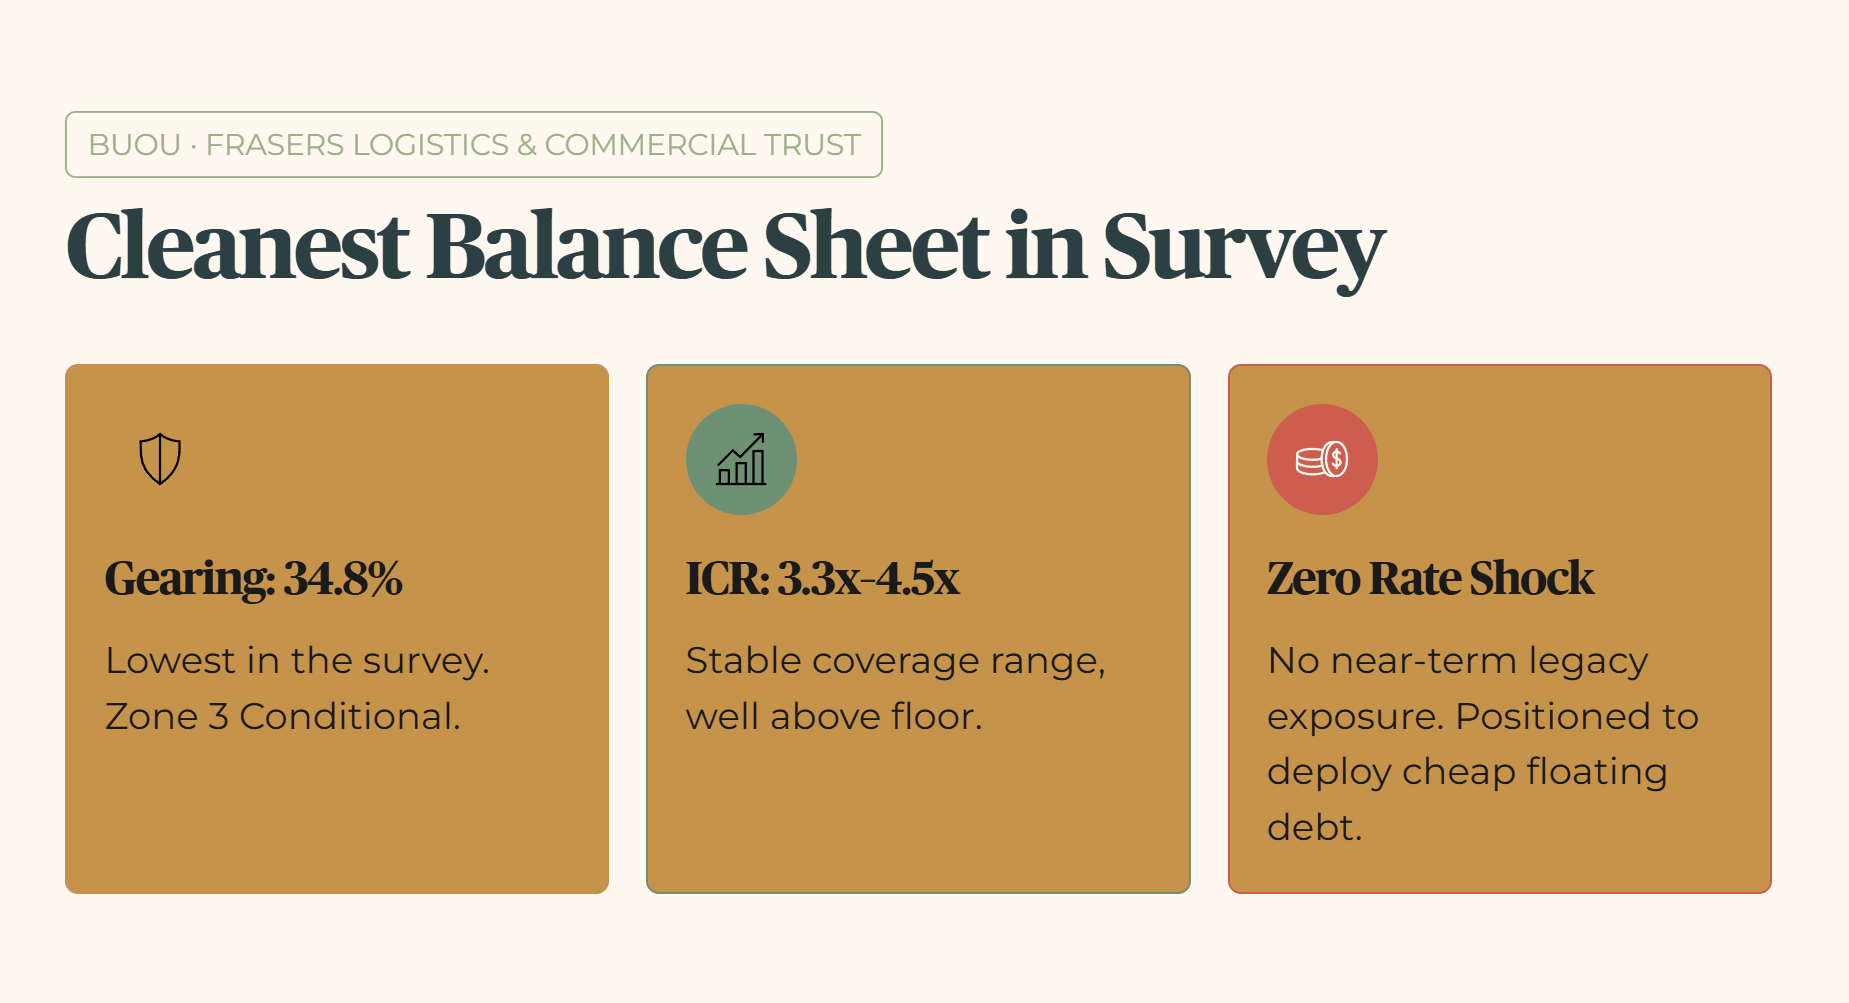
Frasers Logistics & Commercial Trust (BUOU)
The gearing ratio, the ratio of a company’s total debt to its total assets, stands at 34.8 percent. This is the cleanest balance sheet in our macro survey, landing firmly as a Zone 3 Conditional asset due to its operational discipline. Its interest coverage ratio, which measures how many times a company’s operating profit can cover its interest expenses, sits within a stable 3.3x to 4.5x range. It has zero near-term exposure to legacy rate shock and sits perfectly positioned to deploy capital into cheap floating debt.
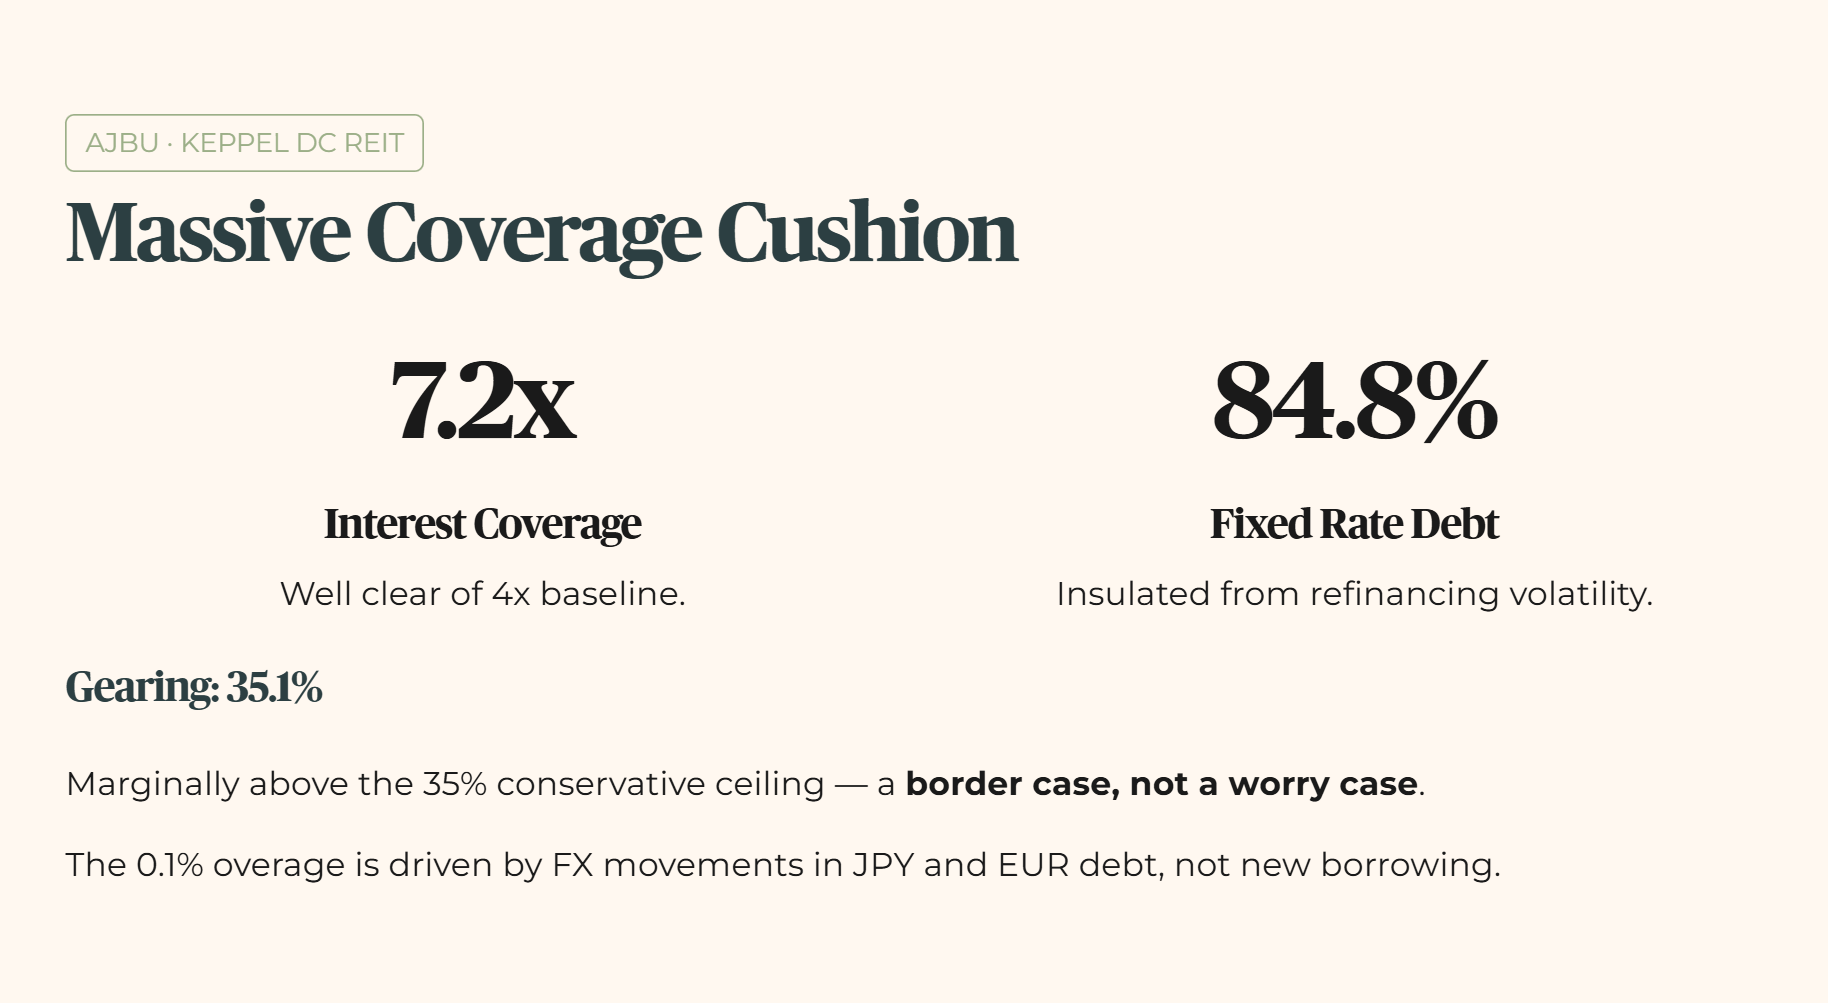
Keppel DC REIT (AJBU)
Gearing sits at 35.1 percent as of the March 31 operational update, down marginally from 35.3 percent due to foreign exchange movements in Japanese Yen and Euro debt rather than direct repayments. While this technically sits just a hair above my conservative 35 percent ceiling, the position is a border case rather than a worry case. Its interest coverage ratio stands at a massive 7.2x, well clear of my 4x baseline. Furthermore, 84.8 percent of its total debt is insulated on fixed interest rates, nullifying immediate refinancing volatility.
Capitaland Integrated Commercial Trust (C38U)
Gearing stands at 38.6 percent. While the raw leverage number appears elevated, CICT carries a highly resilient debt maturity profile. It features 74 percent of its debt fully hedged on fixed rates, negligible maturities across the remainder of 2026 and 2027, and its interest coverage ratio is verified at 3.7x. It holds roughly S$2.3 billion in debt headroom before hitting regulatory limits.
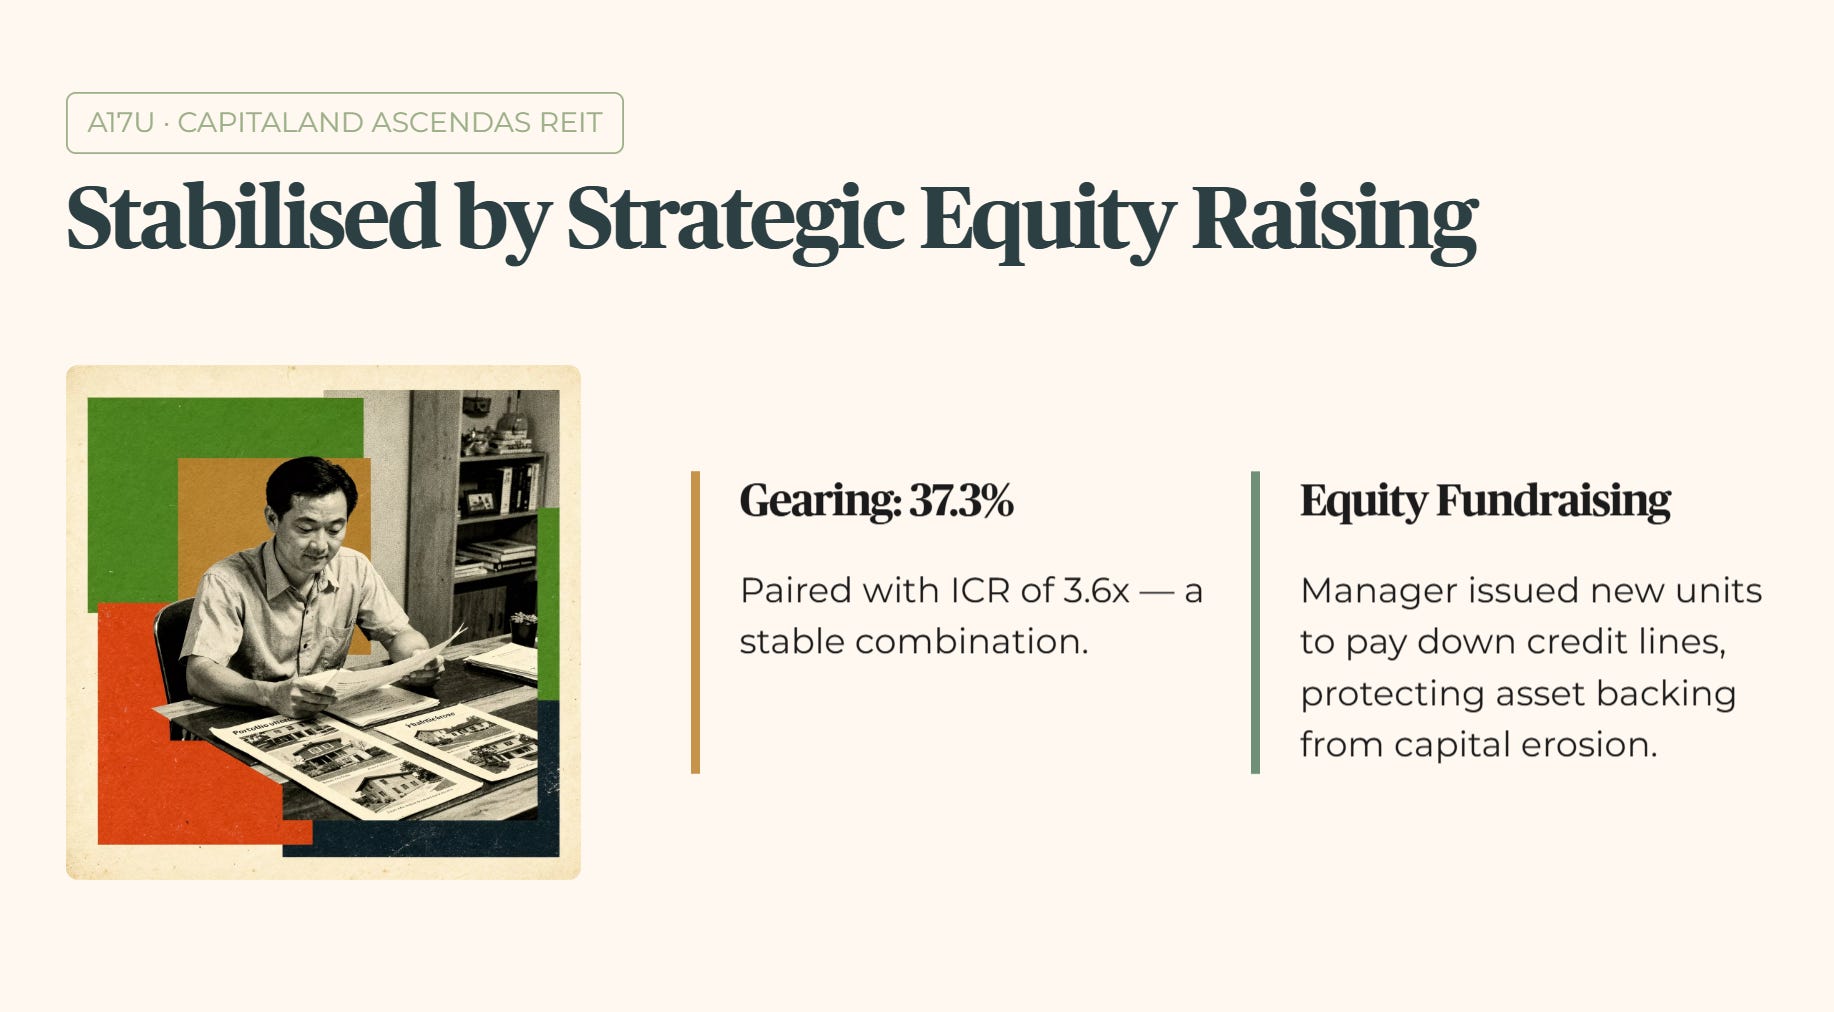
Capitaland Ascendas REIT (A17U)
Gearing sits at 37.3 percent, paired with an interest coverage ratio of 3.6x. This stable metric reflects the direct benefit of recent equity fundraising, where the manager issued new units to pay down outstanding credit lines, protecting the underlying asset backing from capital erosion.
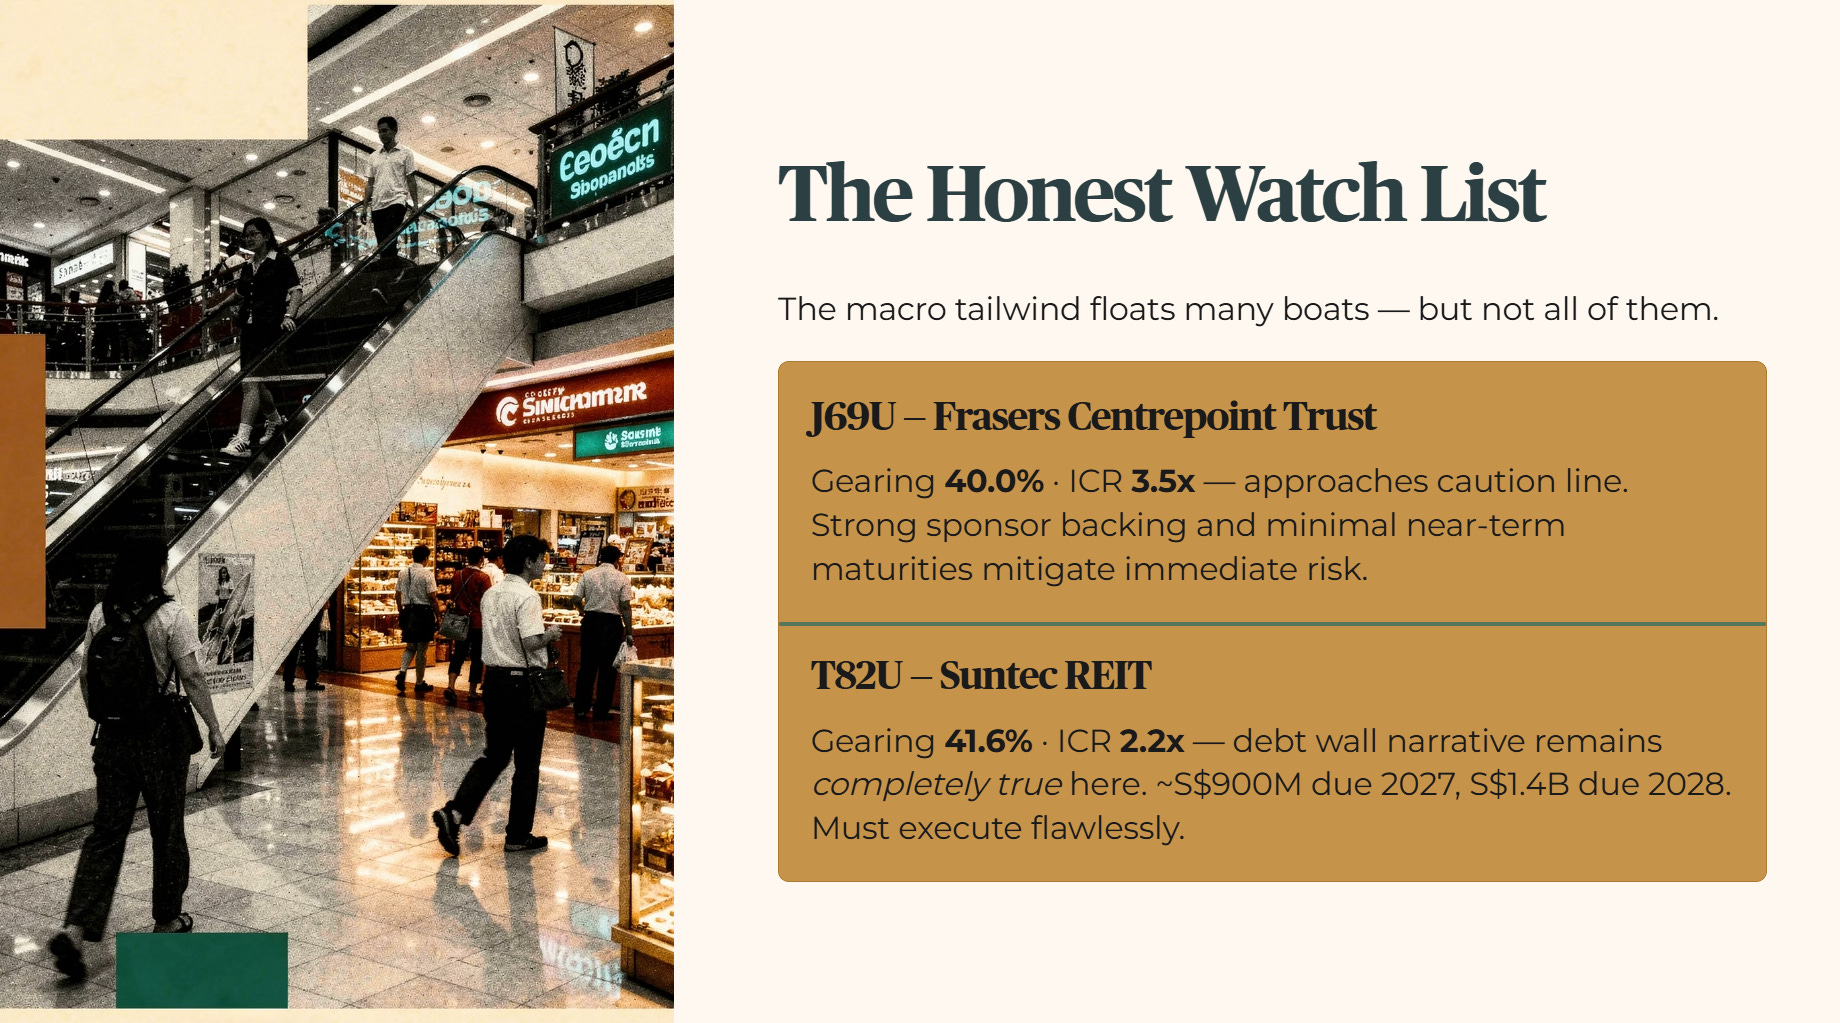
The Honest Watch List
The macro tailwind will float many boats, but my forensic floor exists to highlight where structural pressure remains dangerous. Two specific names in the survey show why generic sector optimism will get you trapped.
Frasers Centrepoint Trust (J69U) shows a gearing ratio of 40.0 percent alongside an interest coverage ratio of 3.5x. This directly approaches the caution line, though strong sponsor backing and minimal near-term debt maturities mitigate immediate rollover risk.
Suntec REIT (T82U) carries a gearing ratio of 41.6 percent and an interest coverage ratio of 2.2x. Suntec represents the exact profile where the debt wall narrative remains completely true. It faces a steep maturity concentration, with approximately S$900 million due in 2027 and a massive S$1.4 billion coming due in 2028. This heavy concentration means management must execute flawlessly to avoid cash-flow strain.
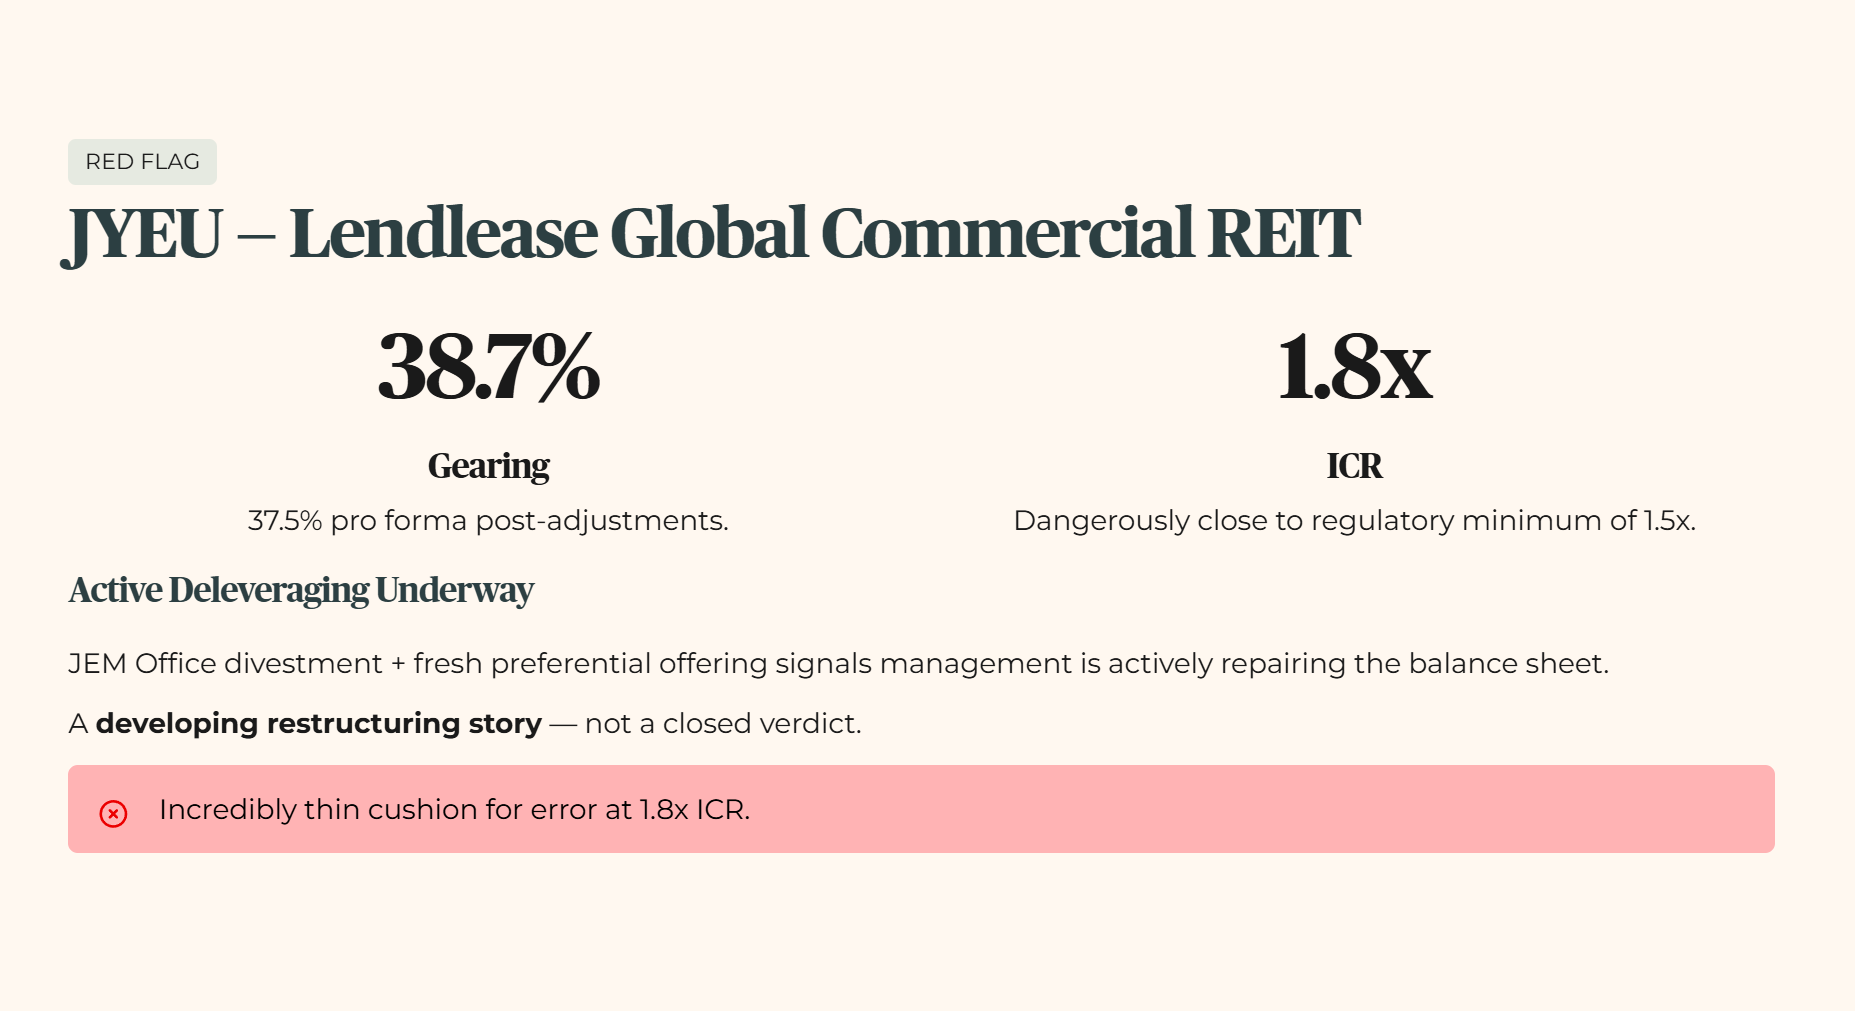
The single sharpest finding in the entire scorecard belongs to Lendlease Global Commercial REIT (LREIT), trading under ticker JYEU. Its gearing ratio stands at 38.7 percent, or 37.5 percent on a pro forma basis following recent adjustments. Its interest coverage ratio has deteriorated to 1.8x, sitting dangerously close to the regulatory minimum floor of 1.5x. This leaves an incredibly thin cushion for error.
The moment you combine that 1.8x coverage with its refinancing calendar, the entire Lendlease Global Commercial REIT profile flips from “high yield” to a very different forensic classification.
